2024 wrap-up and the year ahead
December 17, 2024

December 17, 2024
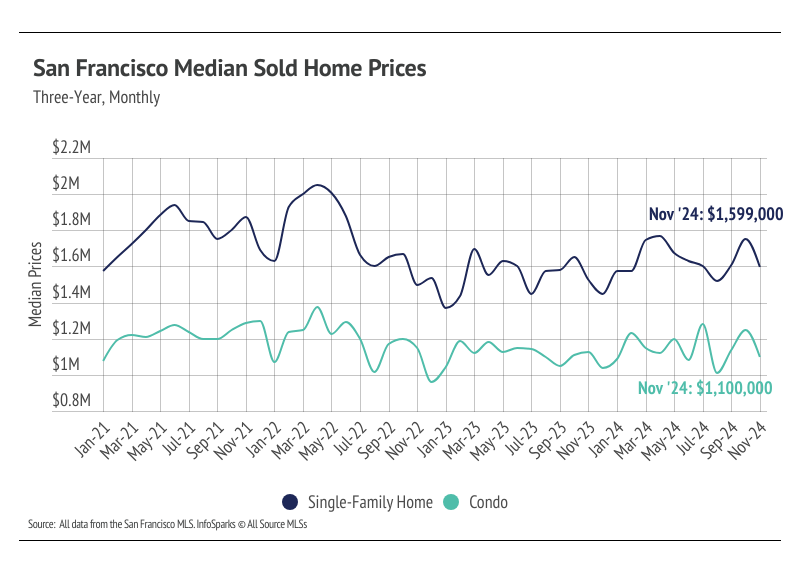
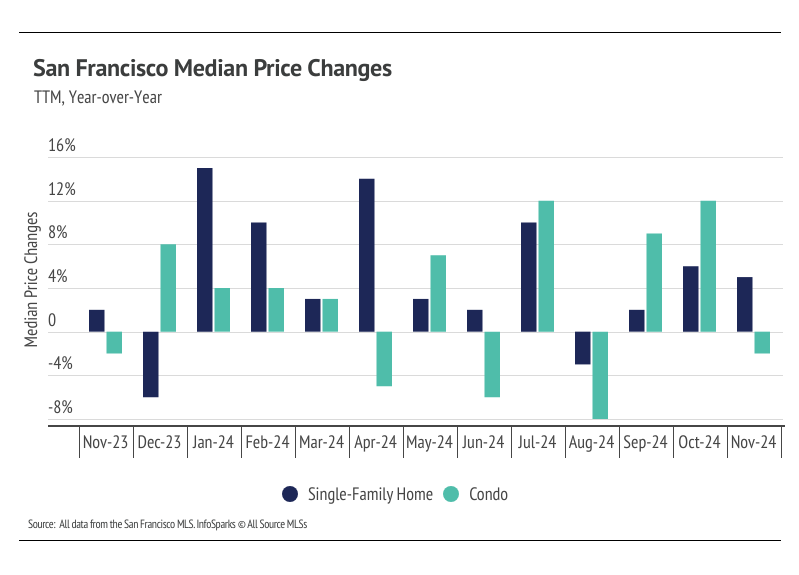
In San Francisco, home prices haven’t been largely affected by rising mortgage rates after the initial period of price correction from April 2022 to August 2022. Single-family home prices peaked at $2.05 million in April 2022 as mortgage rates rose rapidly; $2 million homes are simply far more affordable with a 4-5% mortgage than a 6-7% mortgage. Because of the relatively high prices of homes in San Francisco, prices had to come down to keep buyers in the market. Since August 2022, the median single-family home and condo prices have hovered around $1.6 million and $1.1 million, respectively. In November, prices were almost exactly in line with those averages. Year over year, the median price was up 5% for single-family homes but down 2% for condos. Inventory is once again so low that rising supply only increases prices as buyers are better able to find the best match.
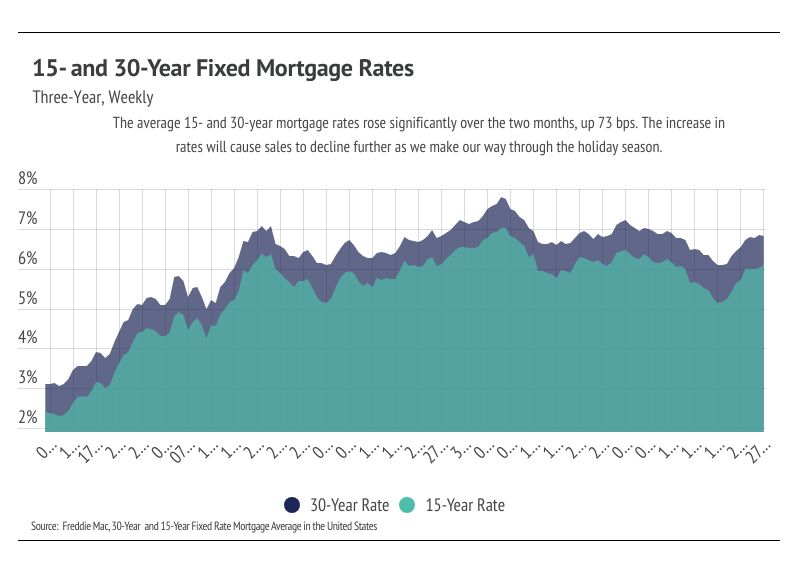
High mortgage rates soften both supply and demand, but home buyers and sellers seemed to tolerate rates near 6% much more than around 7%. Mortgage rates fell significantly from May through September, but rose significantly in October. Now, rates are far closer to 7% than 6%, so we expect sales to slow further.
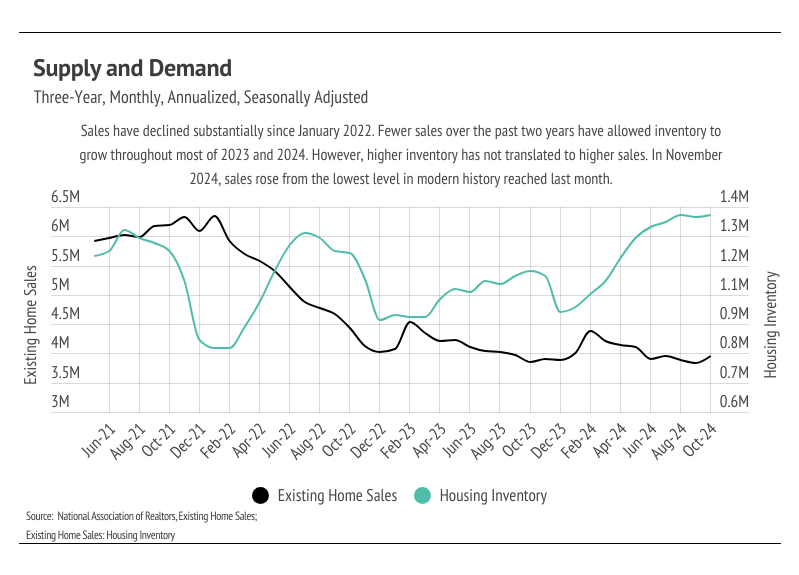
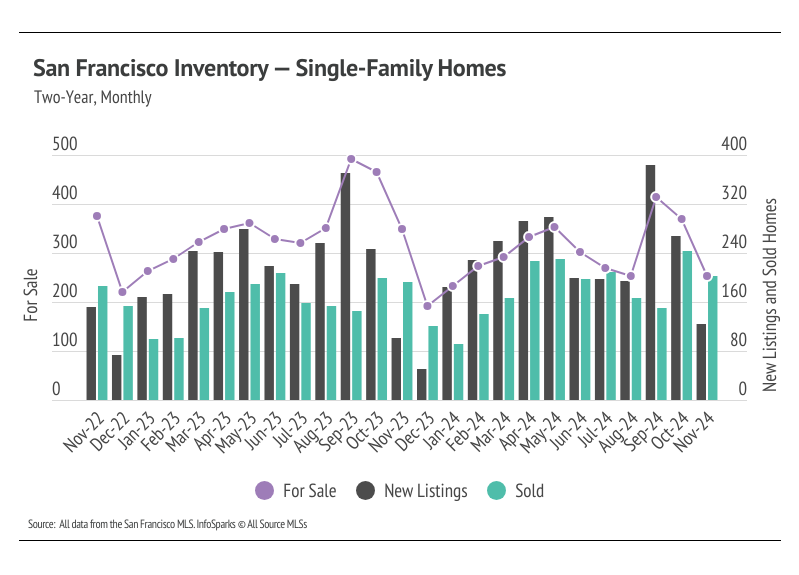
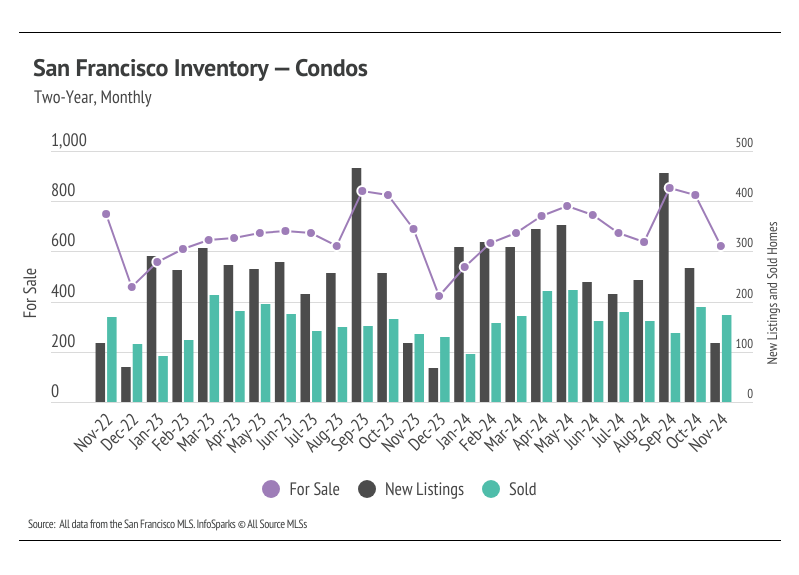
Total inventory has trended lower essentially since 2010, but active listings fell precipitously from October 2020 to December 2021, as sales outpaced new listings, before stabilizing to a degree from January 2022 to the present at a depressed level. Low inventory and new listings, coupled with high mortgage rates, have led to a substantial drop in sales and a generally slower housing market. Typically, inventory begins to increase in January or February, peaking in July or August before declining once again from the summer months to the winter. In 2023, sales didn’t resemble the typical seasonal inventory peaks and valleys. It’s looking like 2024 inventory, sales, and new listings will follow historically seasonal patterns, albeit at a depressed level. Supply will remain tight until spring 2025 at the earliest.
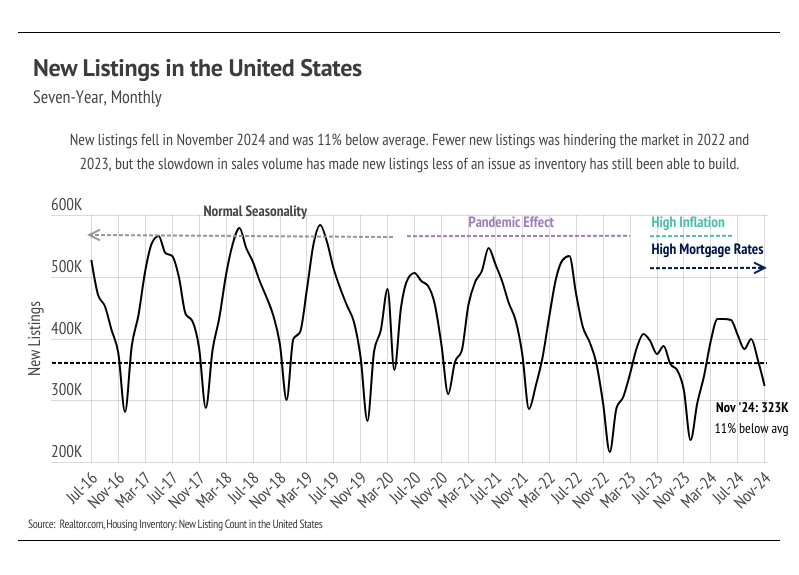
In November, sales far outpaced new listings, causing inventory to decline by 27%. Compared to last year, however, new listings are up 22%, which contributed to the year-over-year increase in sales, up 5%.
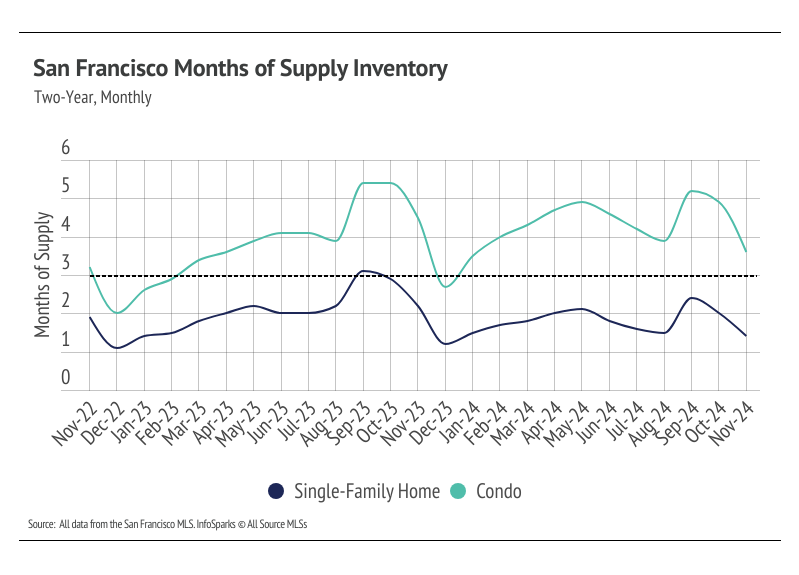
Months of Supply Inventory (MSI) quantifies the supply/demand relationship by measuring how many months it would take for all current homes listed on the market to sell at the current rate of sales. The long-term average MSI is around three months in California, which indicates a balanced market. An MSI lower than three indicates that there are more buyers than sellers on the market (meaning it’s a sellers’ market), while a higher MSI indicates there are more sellers than buyers (meaning it’s a buyers’ market). The San Francisco housing market tends to favor sellers, which is reflected in its low MSI, at least for single-family homes. MSI has been below three months since October 2023 for single-family homes. From May to August, MSI declined meaningfully. In September, MSI jumped higher as new listings spiked. However, in October, sales jumped and MSI fell. MSI continued to decline in November. Currently, condo MSI indicates a buyers’ market, while single-family home MSI still implies a sellers’ market.
Stay up to date on the latest real estate trends.

July 24, 2026
June 2026 market data shows record-low inventory, rising home prices, and one of California's strongest seller's markets.
July 23, 2026
More than 140 San Francisco homes sold over $1 million above asking in early 2026.

July 17, 2026
Explore Life Near the Panhandle at 536 Broderick

July 14, 2026
June 2026 Pacifica housing market data, including median sale price, days on market, price per square foot, and sale-to-list price trends.
You’ve got questions and we can’t wait to answer them.