December San Francisco Market Analysis
December 30, 2019

December 30, 2019

Welcome to our December newsletter. We hope you had a nice holiday and the New Year brings you health, happiness, and joy! We look forward to answering any of your real estate questions in the New Year.
This month we’ll take a dive into the most recent housing numbers and provide a Market Update for San Francisco through an examination of:
Market Update for San Francisco
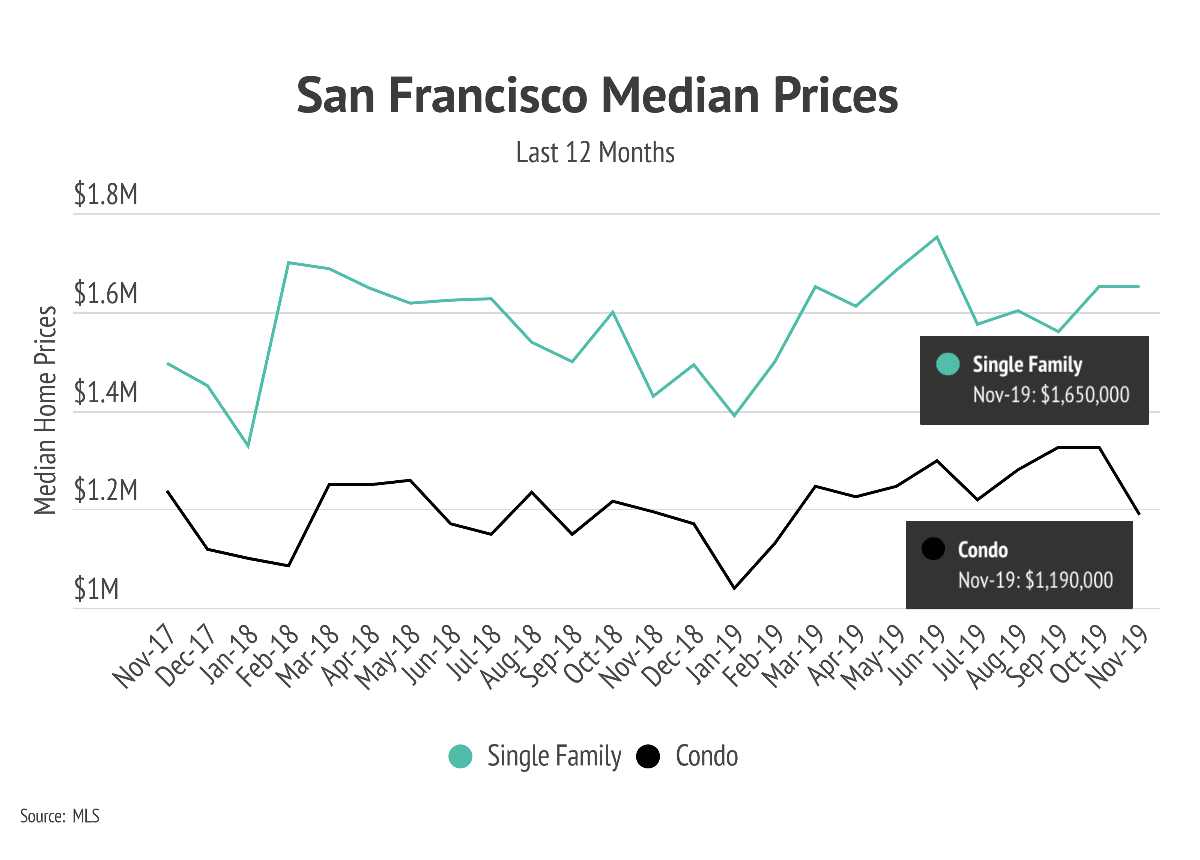
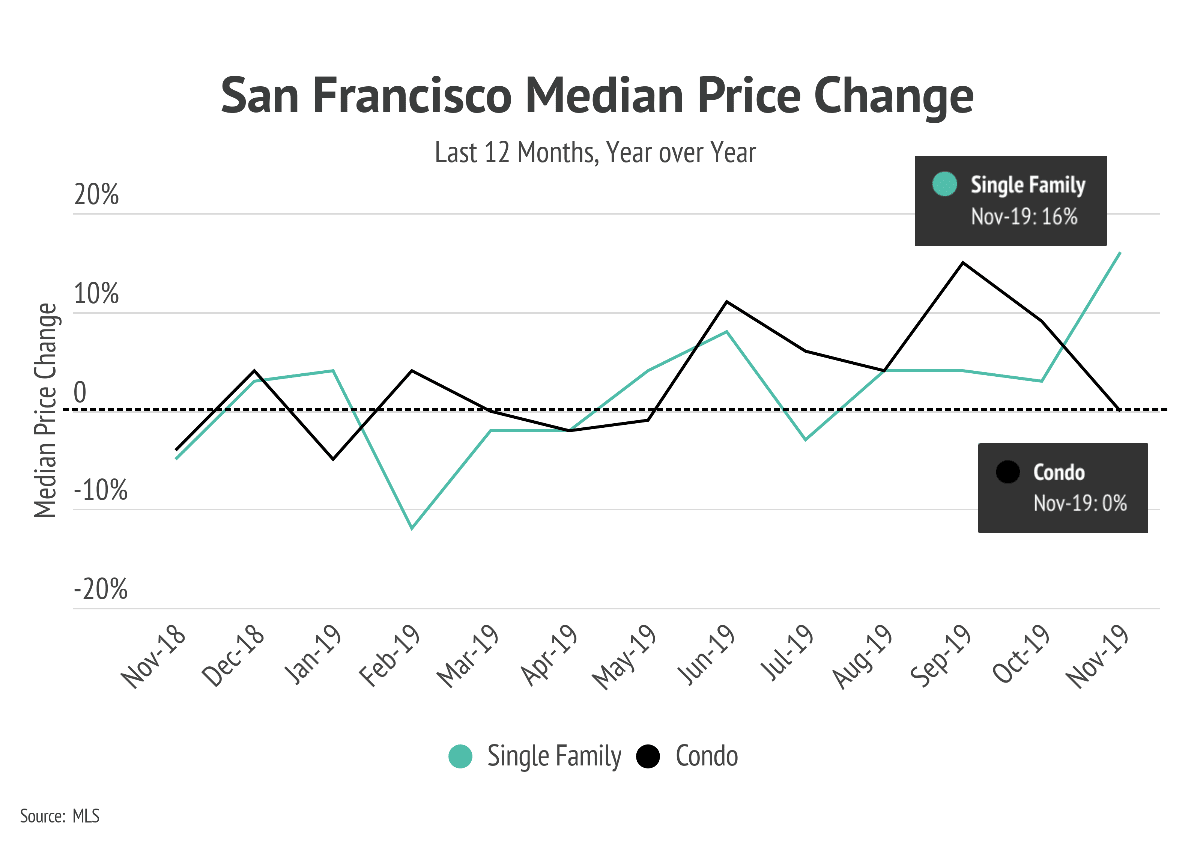
Here’s a snapshot of this month’s housing market in San Francisco across four key indicators: home prices, month’s supply, days on market, and the sales-to-list price.
Home Prices
The takeaway:
For single-family homes, appreciating prices signal a healthy demand for housing and should encourage sellers to price their homes slightly above comparables. Sellers should price their condos in line with recent comparables.
Month’s Supply
The takeaway:
It’s a seller’s market. Supply levels are extremely low and tightening further compared to the previous year, giving sellers the advantage of robust demand and rising home prices.

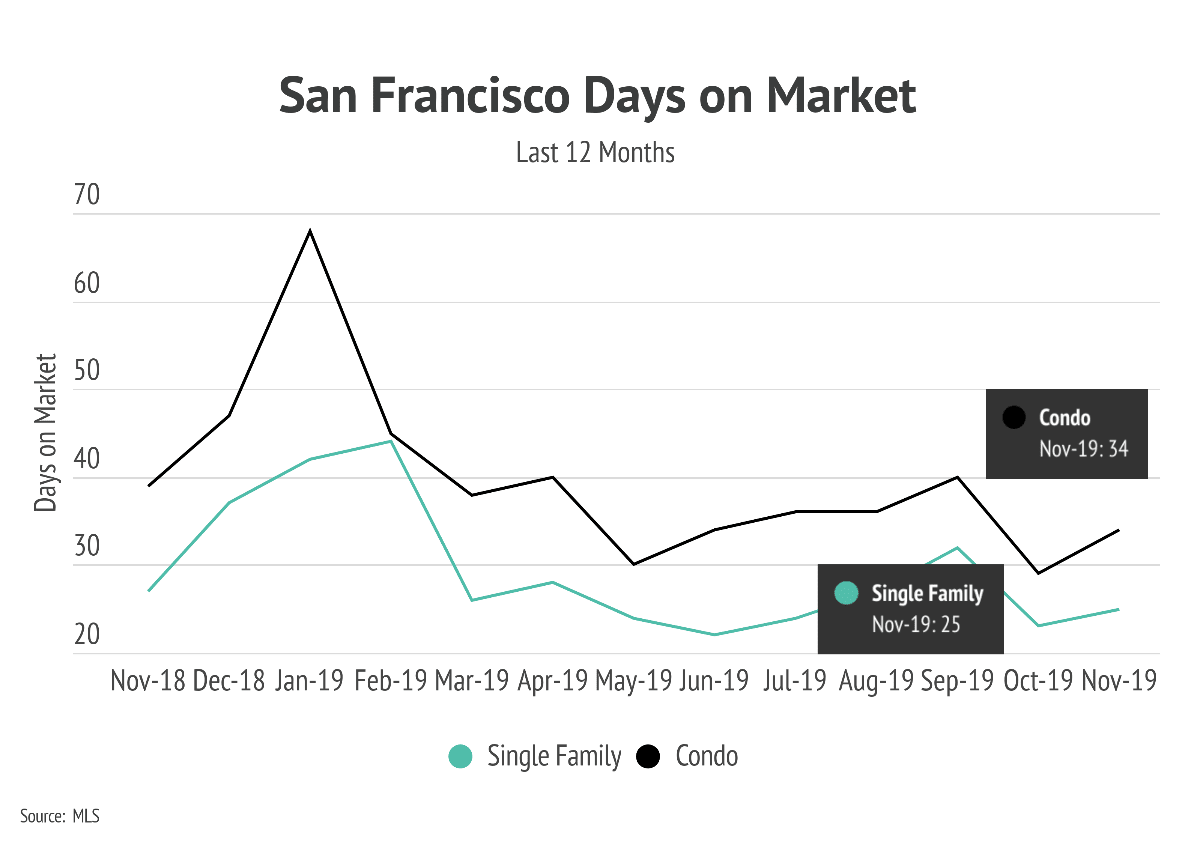
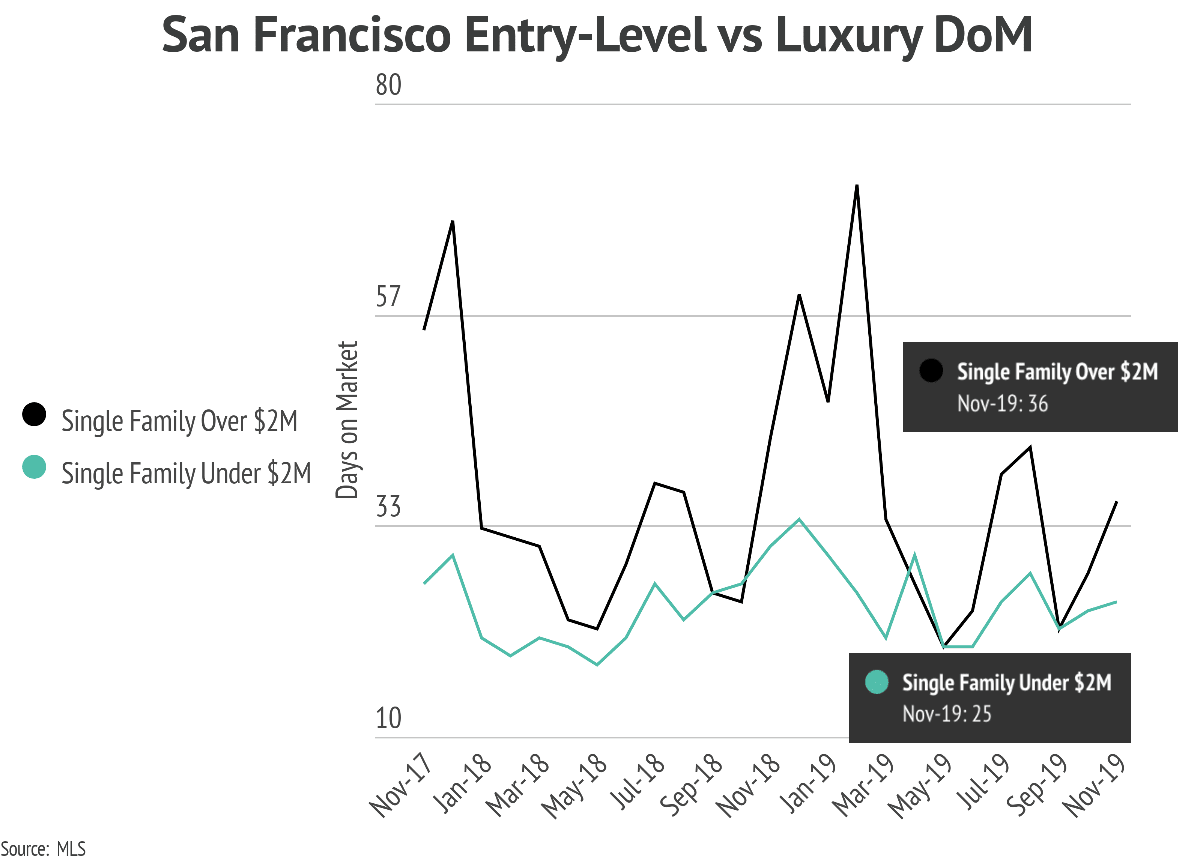
Days on Market
The takeaway:
Sellers of luxury homes should have realistic expectations about how long it will take to sell their property. Days on market declined significantly from a year ago.
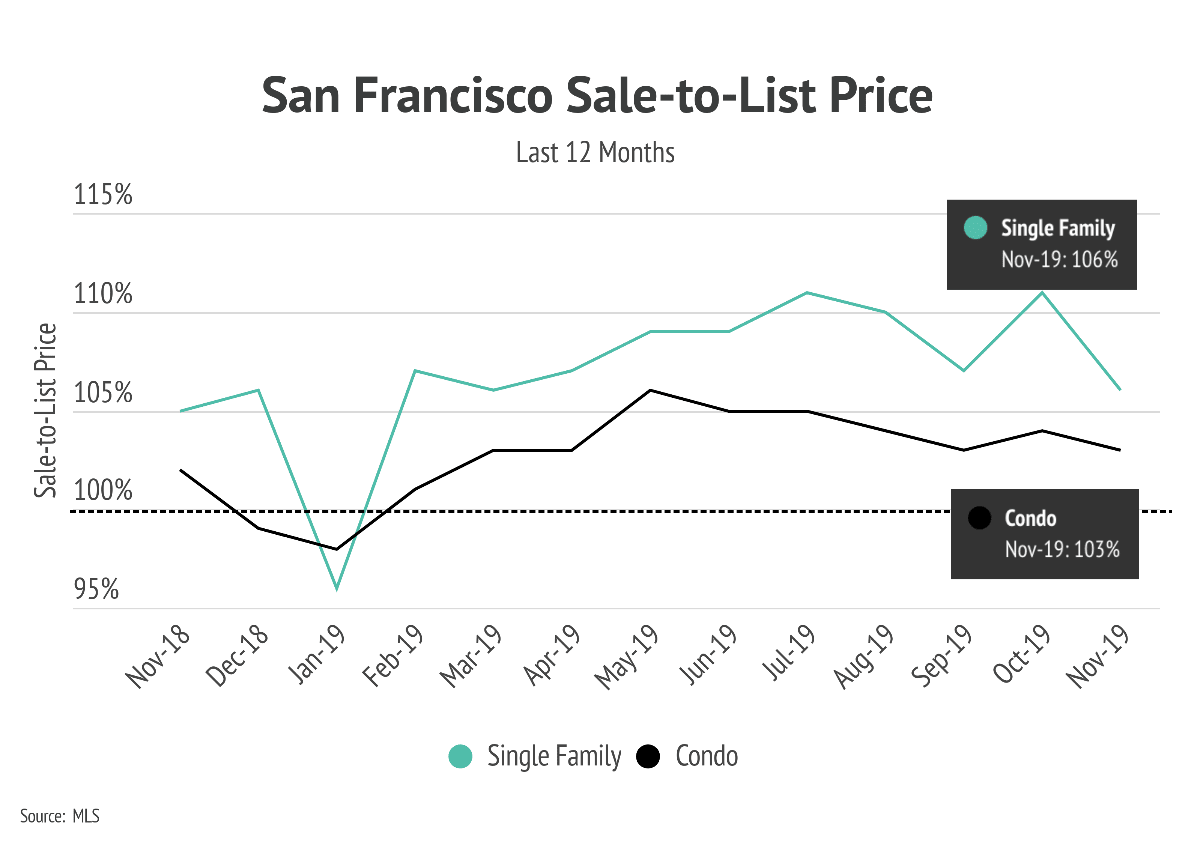
Sale-to-List Price
The takeaway:
Both condos and single-family homes are selling well above their listing price. Both buyers and sellers should be prepared to negotiate prices accordingly.
Stay up to date on the latest real estate trends.
November 9, 2026
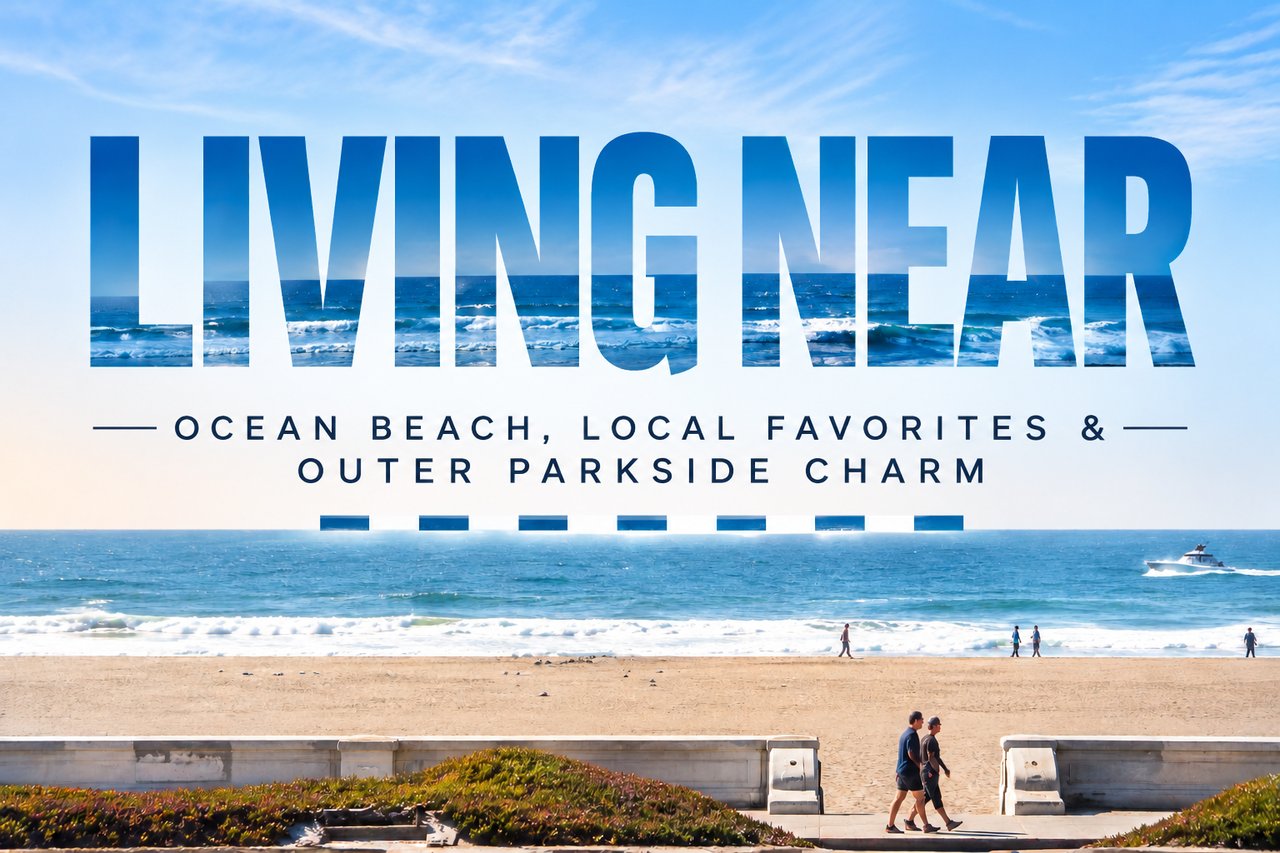
Discover the laid-back coastal lifestyle of Outer Parkside, from Ocean Beach and neighborhood favorites to the local charm that makes this San Francisco community spec… Read more

November 4, 2026
Twenty-seven homes closed in October. The median sale price remained at $1.3 million, while nearly three-quarters of sales found buyers within 30 days.

November 2, 2026
September 2026 Market Insights: Rising Prices, Limited Inventory, and a Faster-Moving Condo Market
October 27, 2026
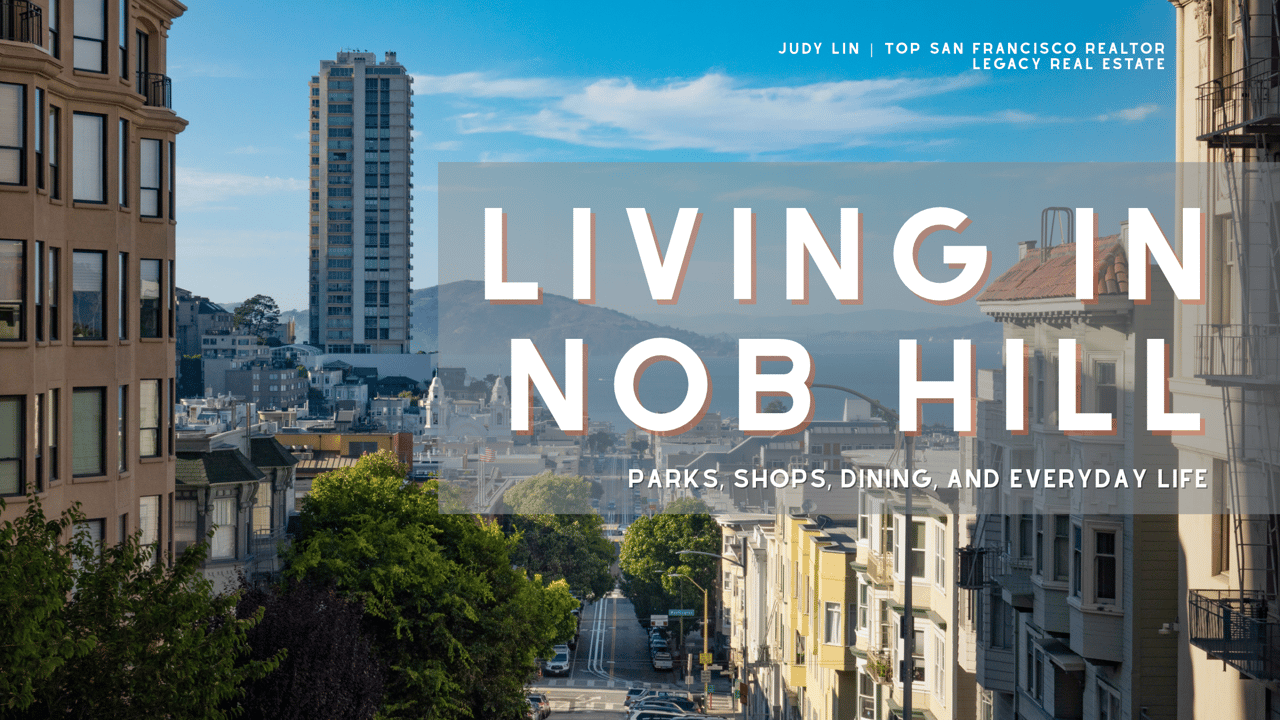
Discover what living in Nob Hill, San Francisco is really like, from charming cafés to iconic cable cars, city views, and beautiful homes in this historic hilltop neig… Read more
You’ve got questions and we can’t wait to answer them.