Is the Housing Market Shifting? July 2025 Housing Market Update
July 25, 2025

July 25, 2025
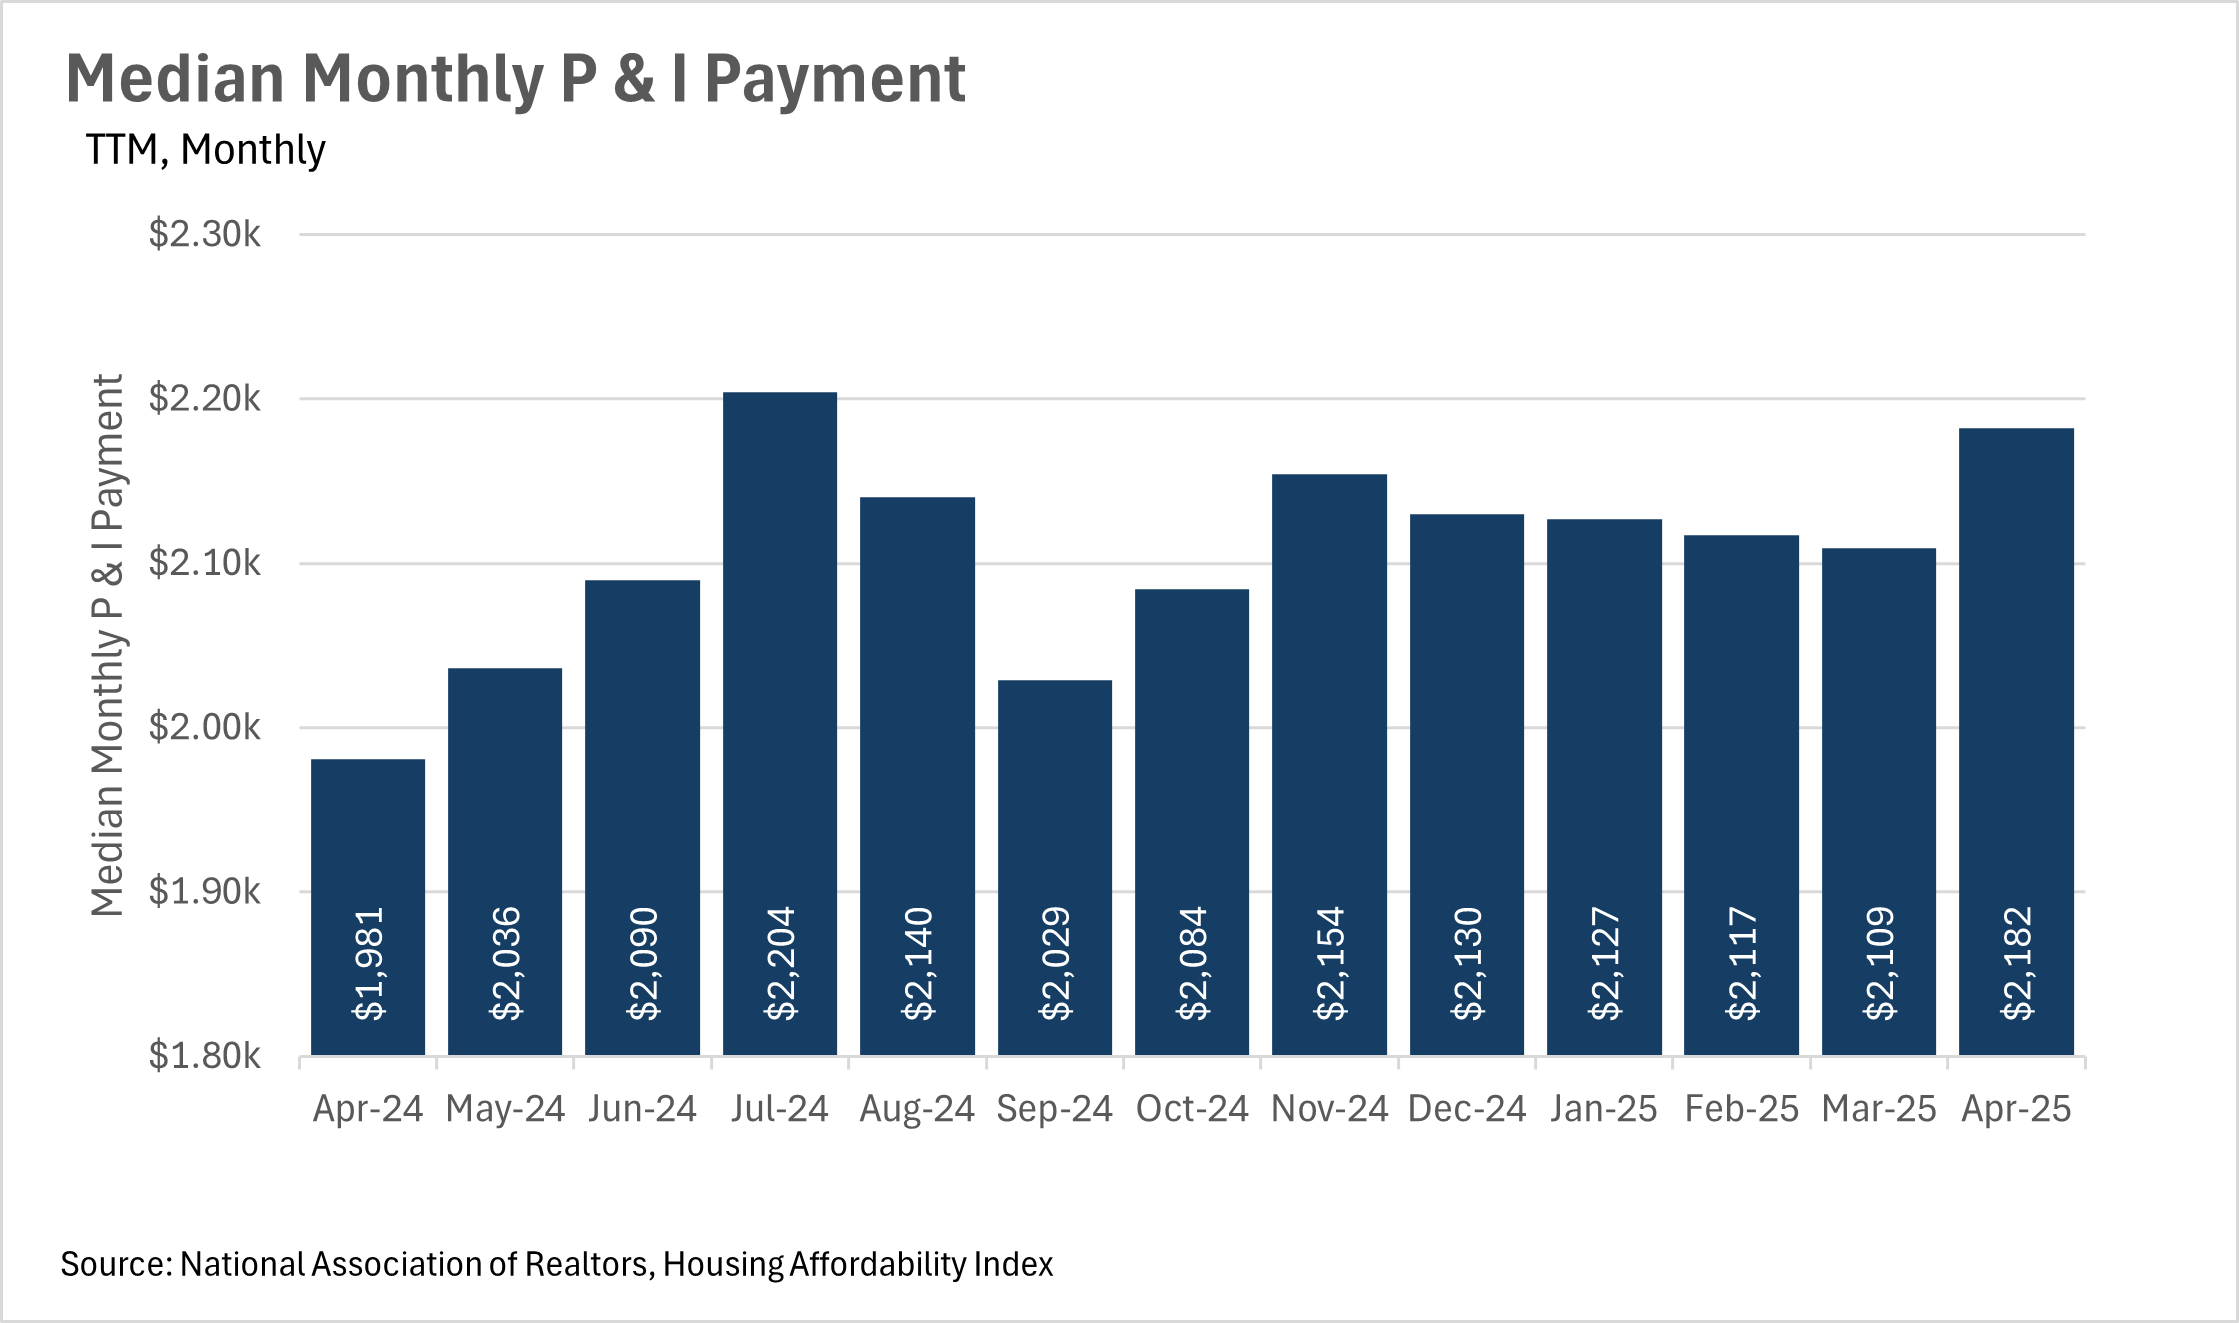
Affordability remains an issue nationwide, as the median monthly P&I payment ticked up by 10.15% year-over-year at the end of April.
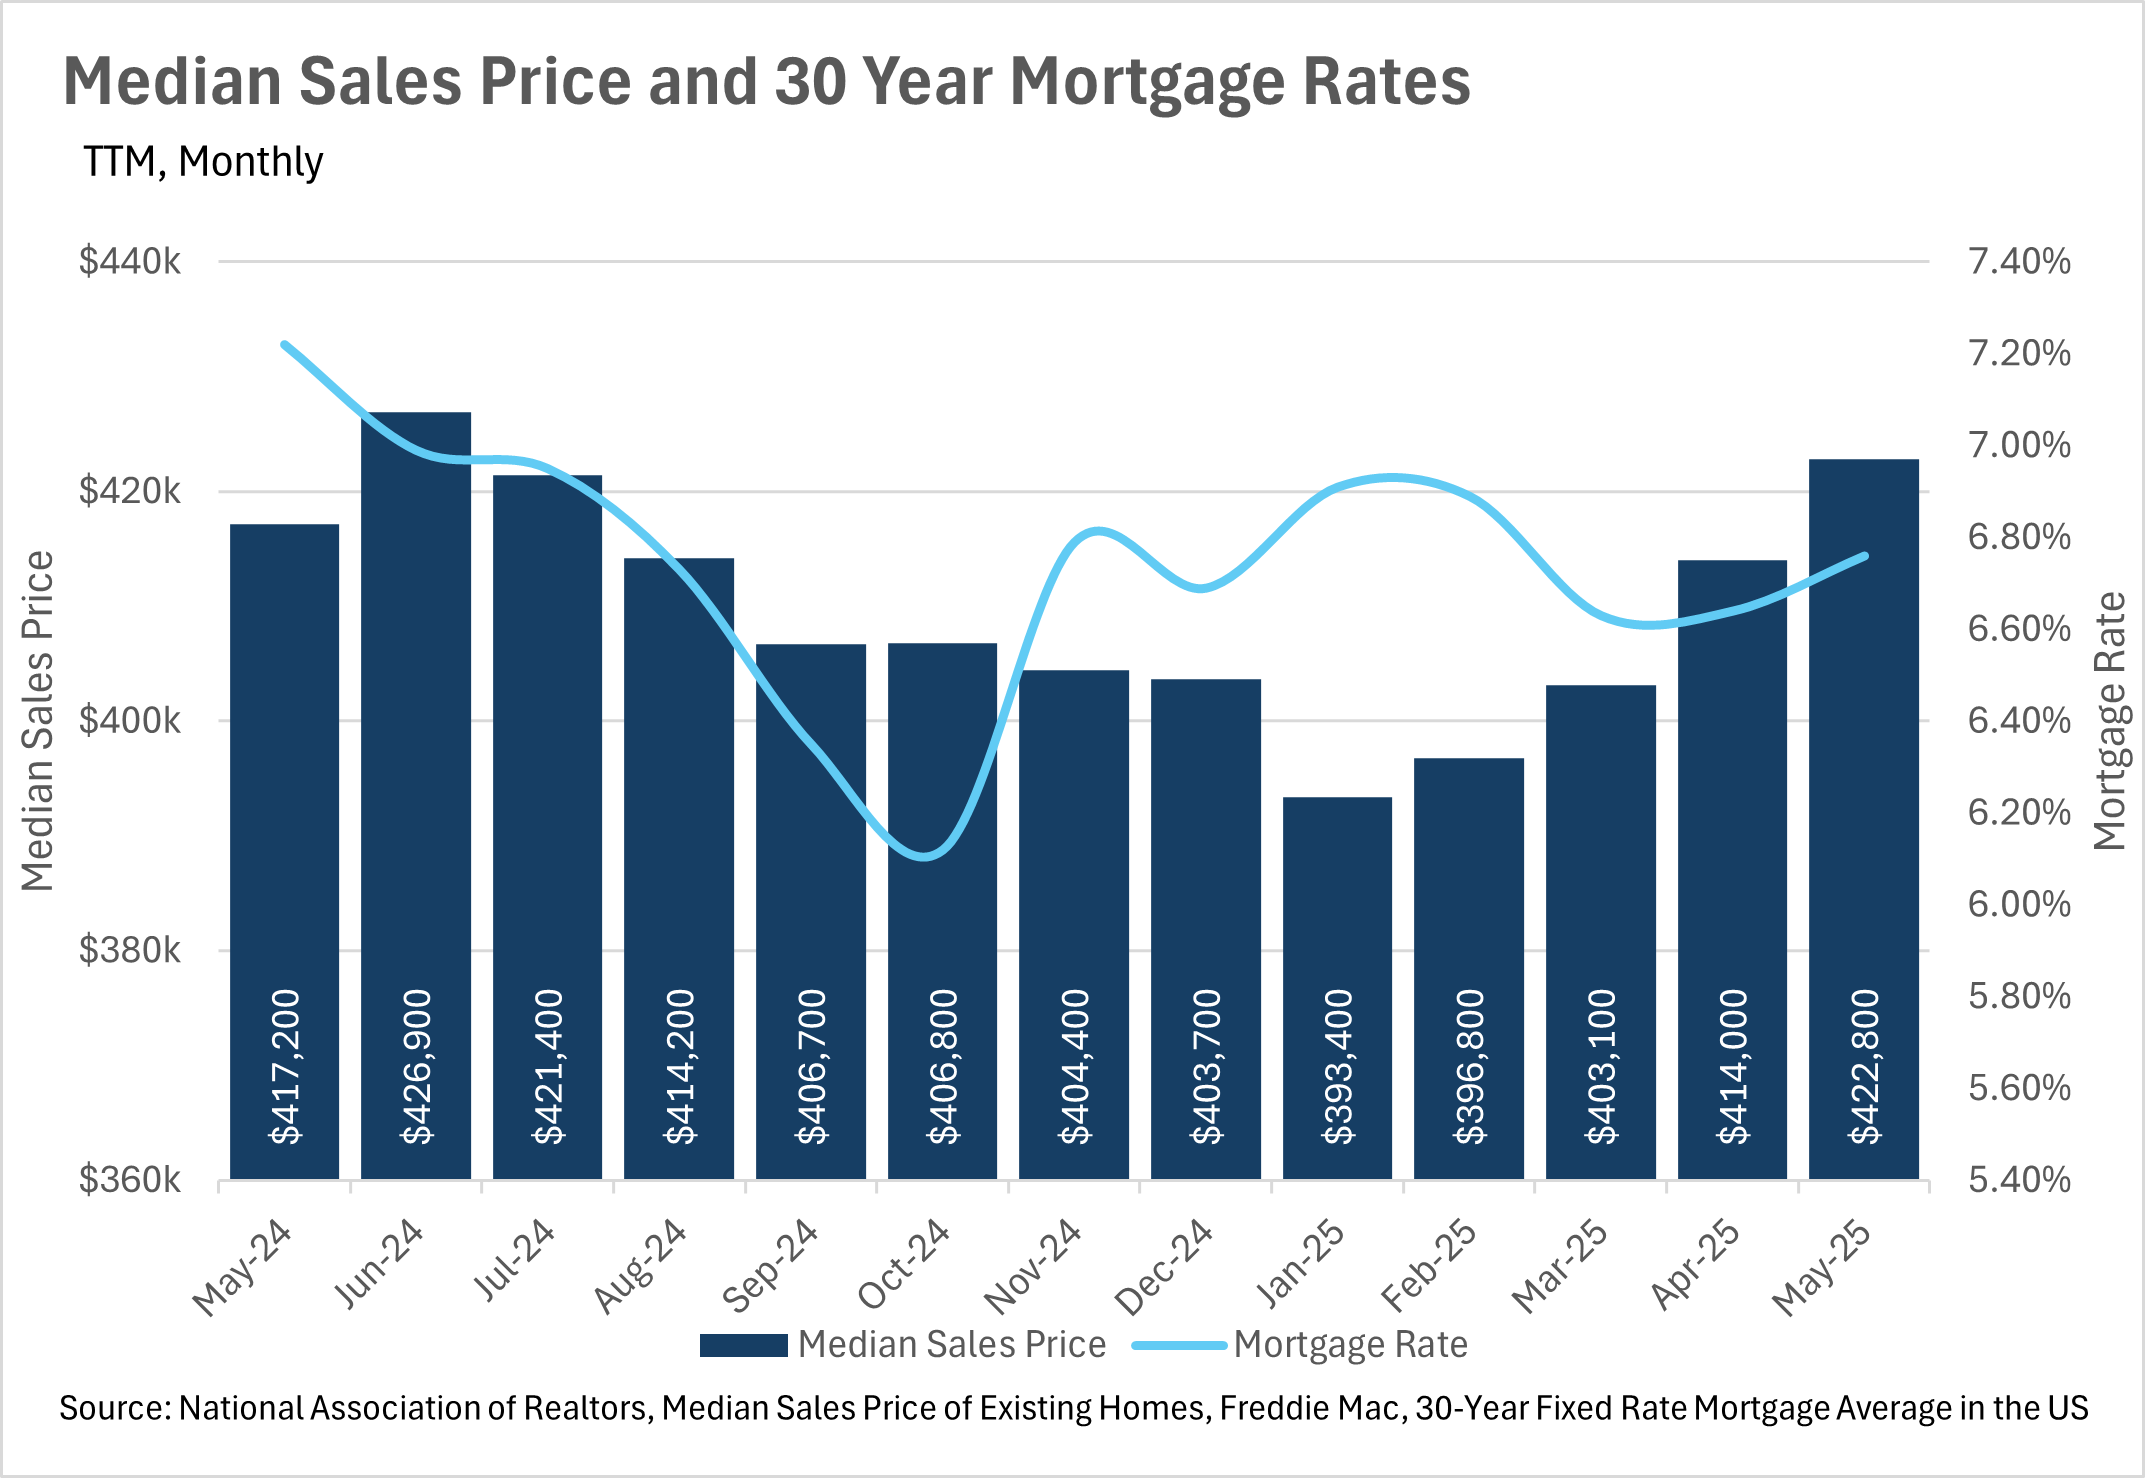
Mortgage rates have continued to hold the mid-six percent range that we’ve seen for over six months.
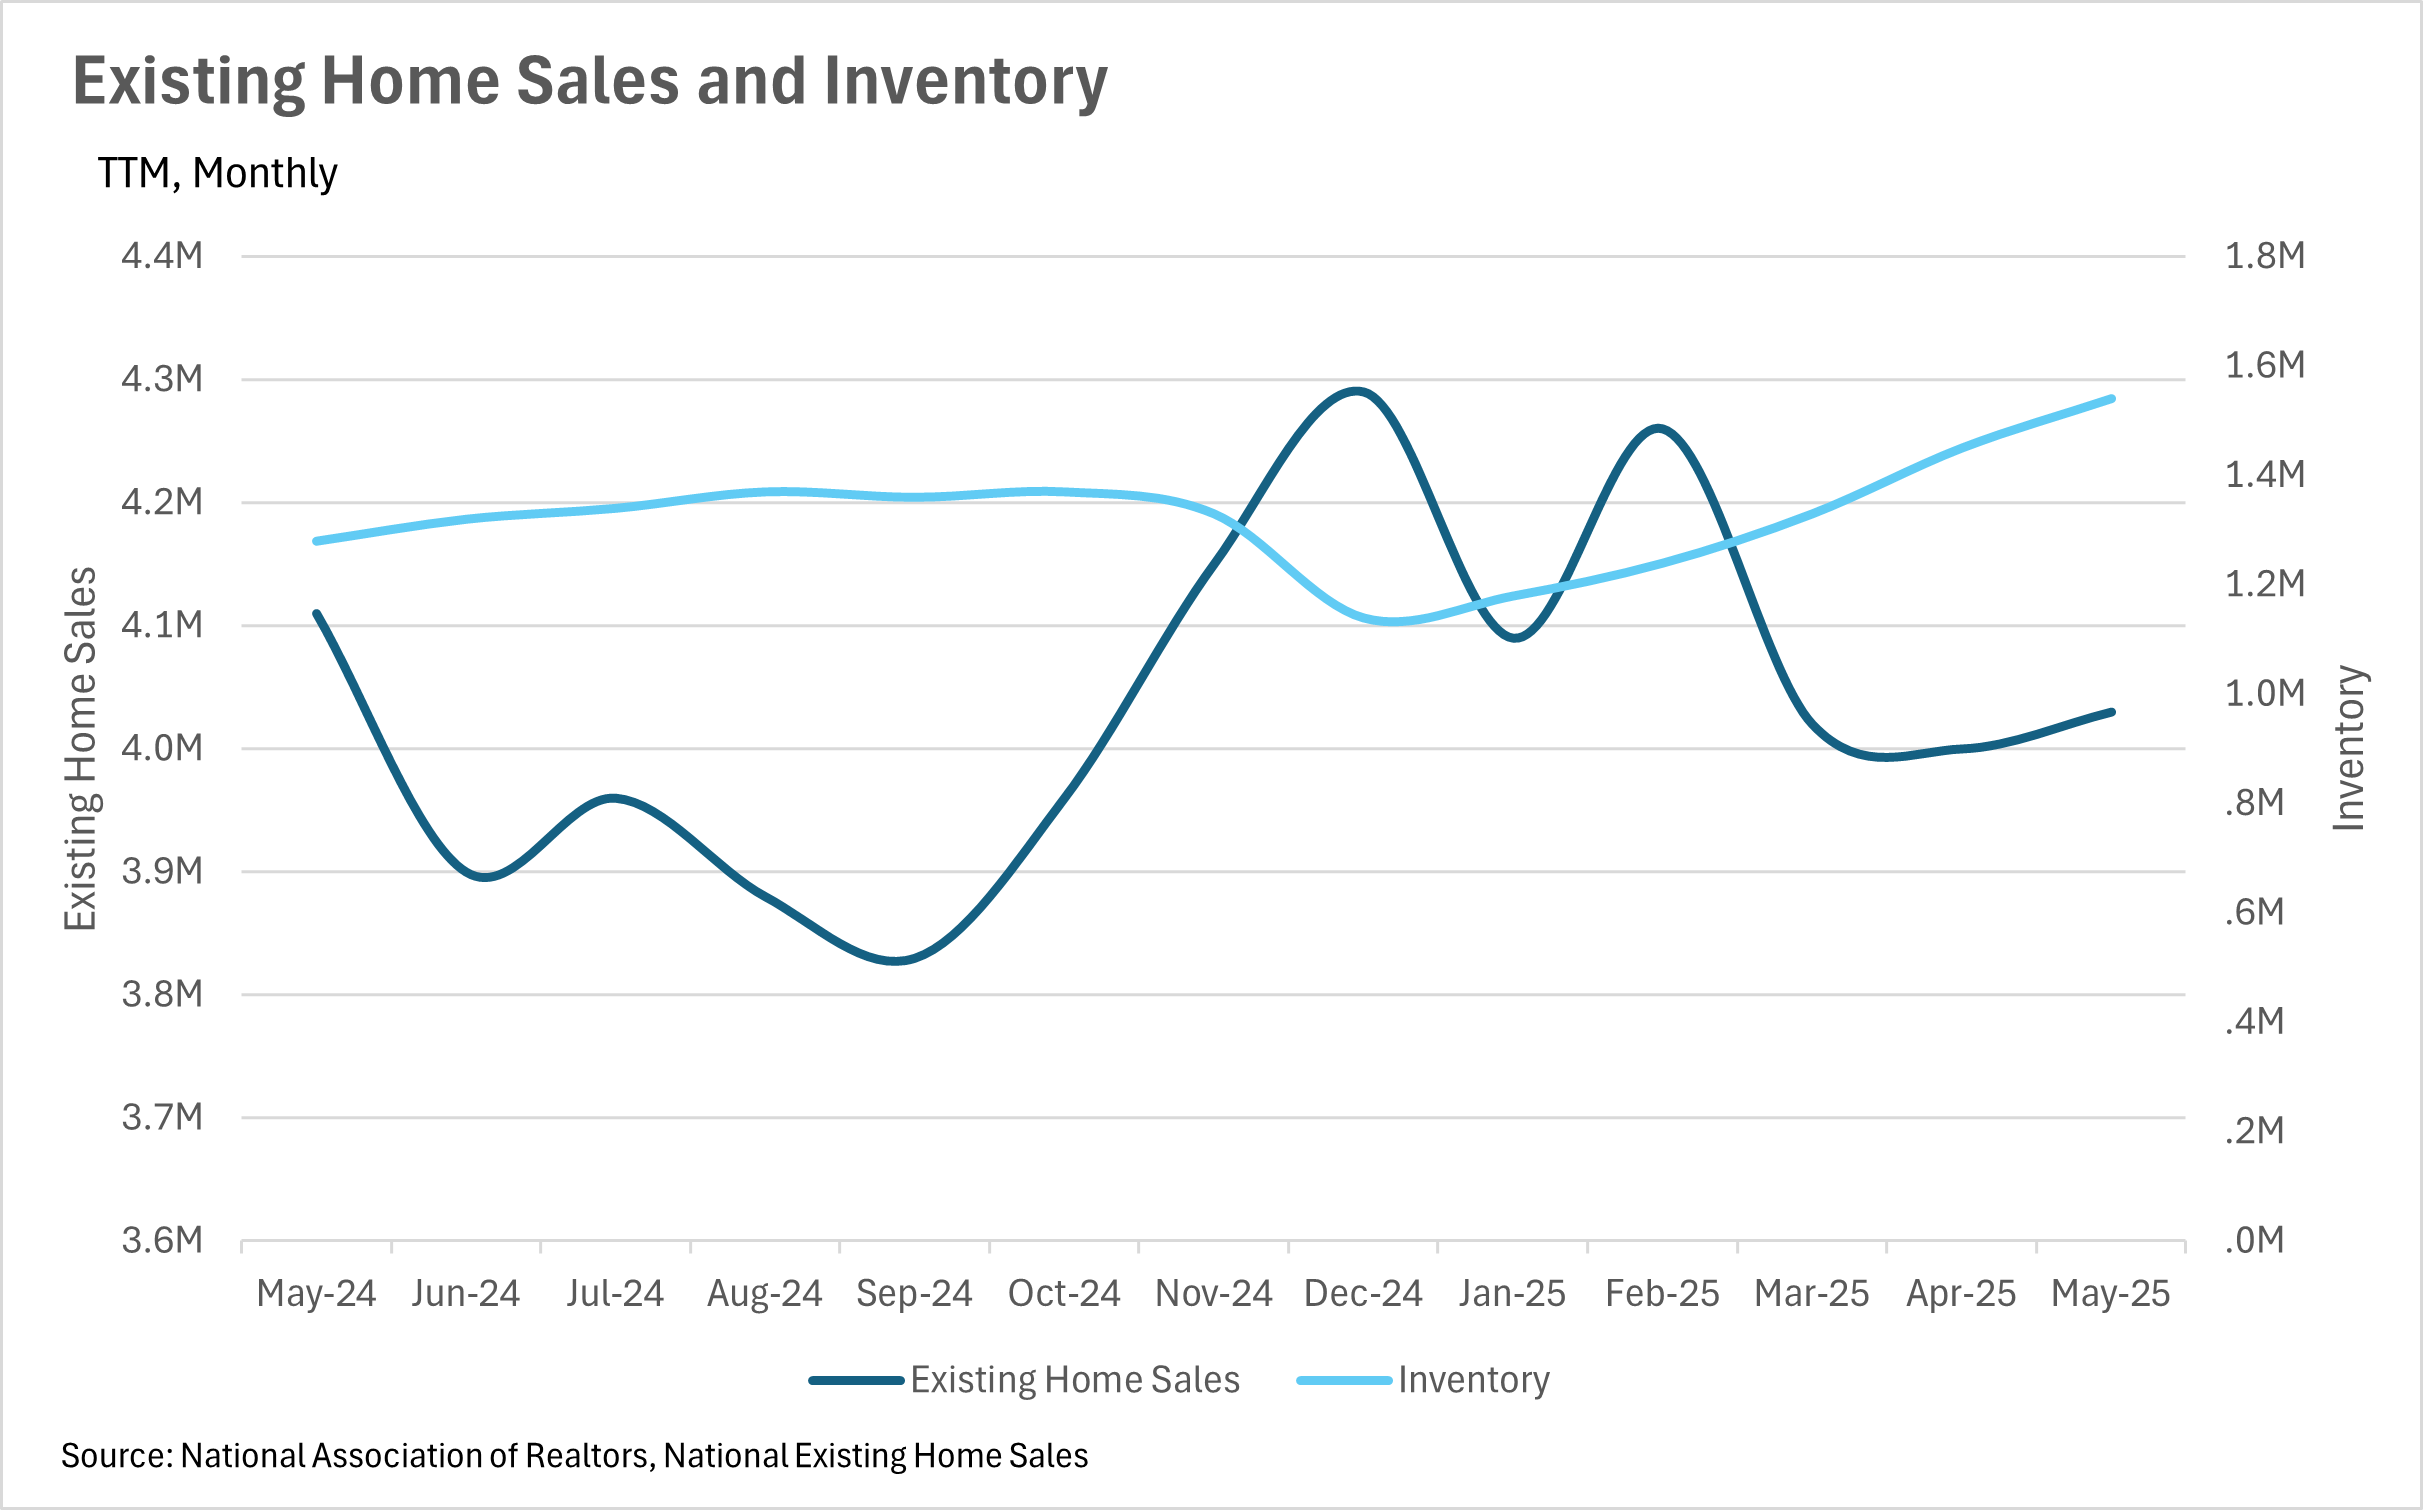
Inventories continue to climb throughout the country, while home sales start to slow down.
The recent global economic and geopolitical instability that we’ve seen likely won’t help the market, as uncertainty may lead people to stay where they are.
Note: You can find the charts & graphs for the Big Story at the end of the following section. Click here to jump to San Francisco Housing data.
National Association of REALTORS® data is released two months behind, so we estimate the most recent month's data when possible and appropriate.
As we all know, housing affordability has been a problem on a national scale for quite a few years at this point. At this point in time, many find it hard to believe that the housing market will return to pre-pandemic levels in terms of affordability at any point in the near future.
Unfortunately, things have not gotten much better, as the median monthly P&I payment increased by 10.15% on a year-over-year basis, to $2,182 in April. This jump in P&I payment represents a drastic month-over-month jump of 3.46%. This jump is actually quite perplexing, as median home sale prices have increased by 1.34% year-over-year, while mortgage rates have actually come down.
For the past few months, mortgage rates have remained fairly stable, in the mid-six percent range. Although the stability that we’ve seen is a good thing, the levels they’ve stabilized at are quite a bit higher than recent historical averages. This, of course, is one of the leading causes of the affordability issues that we’ve seen recently.
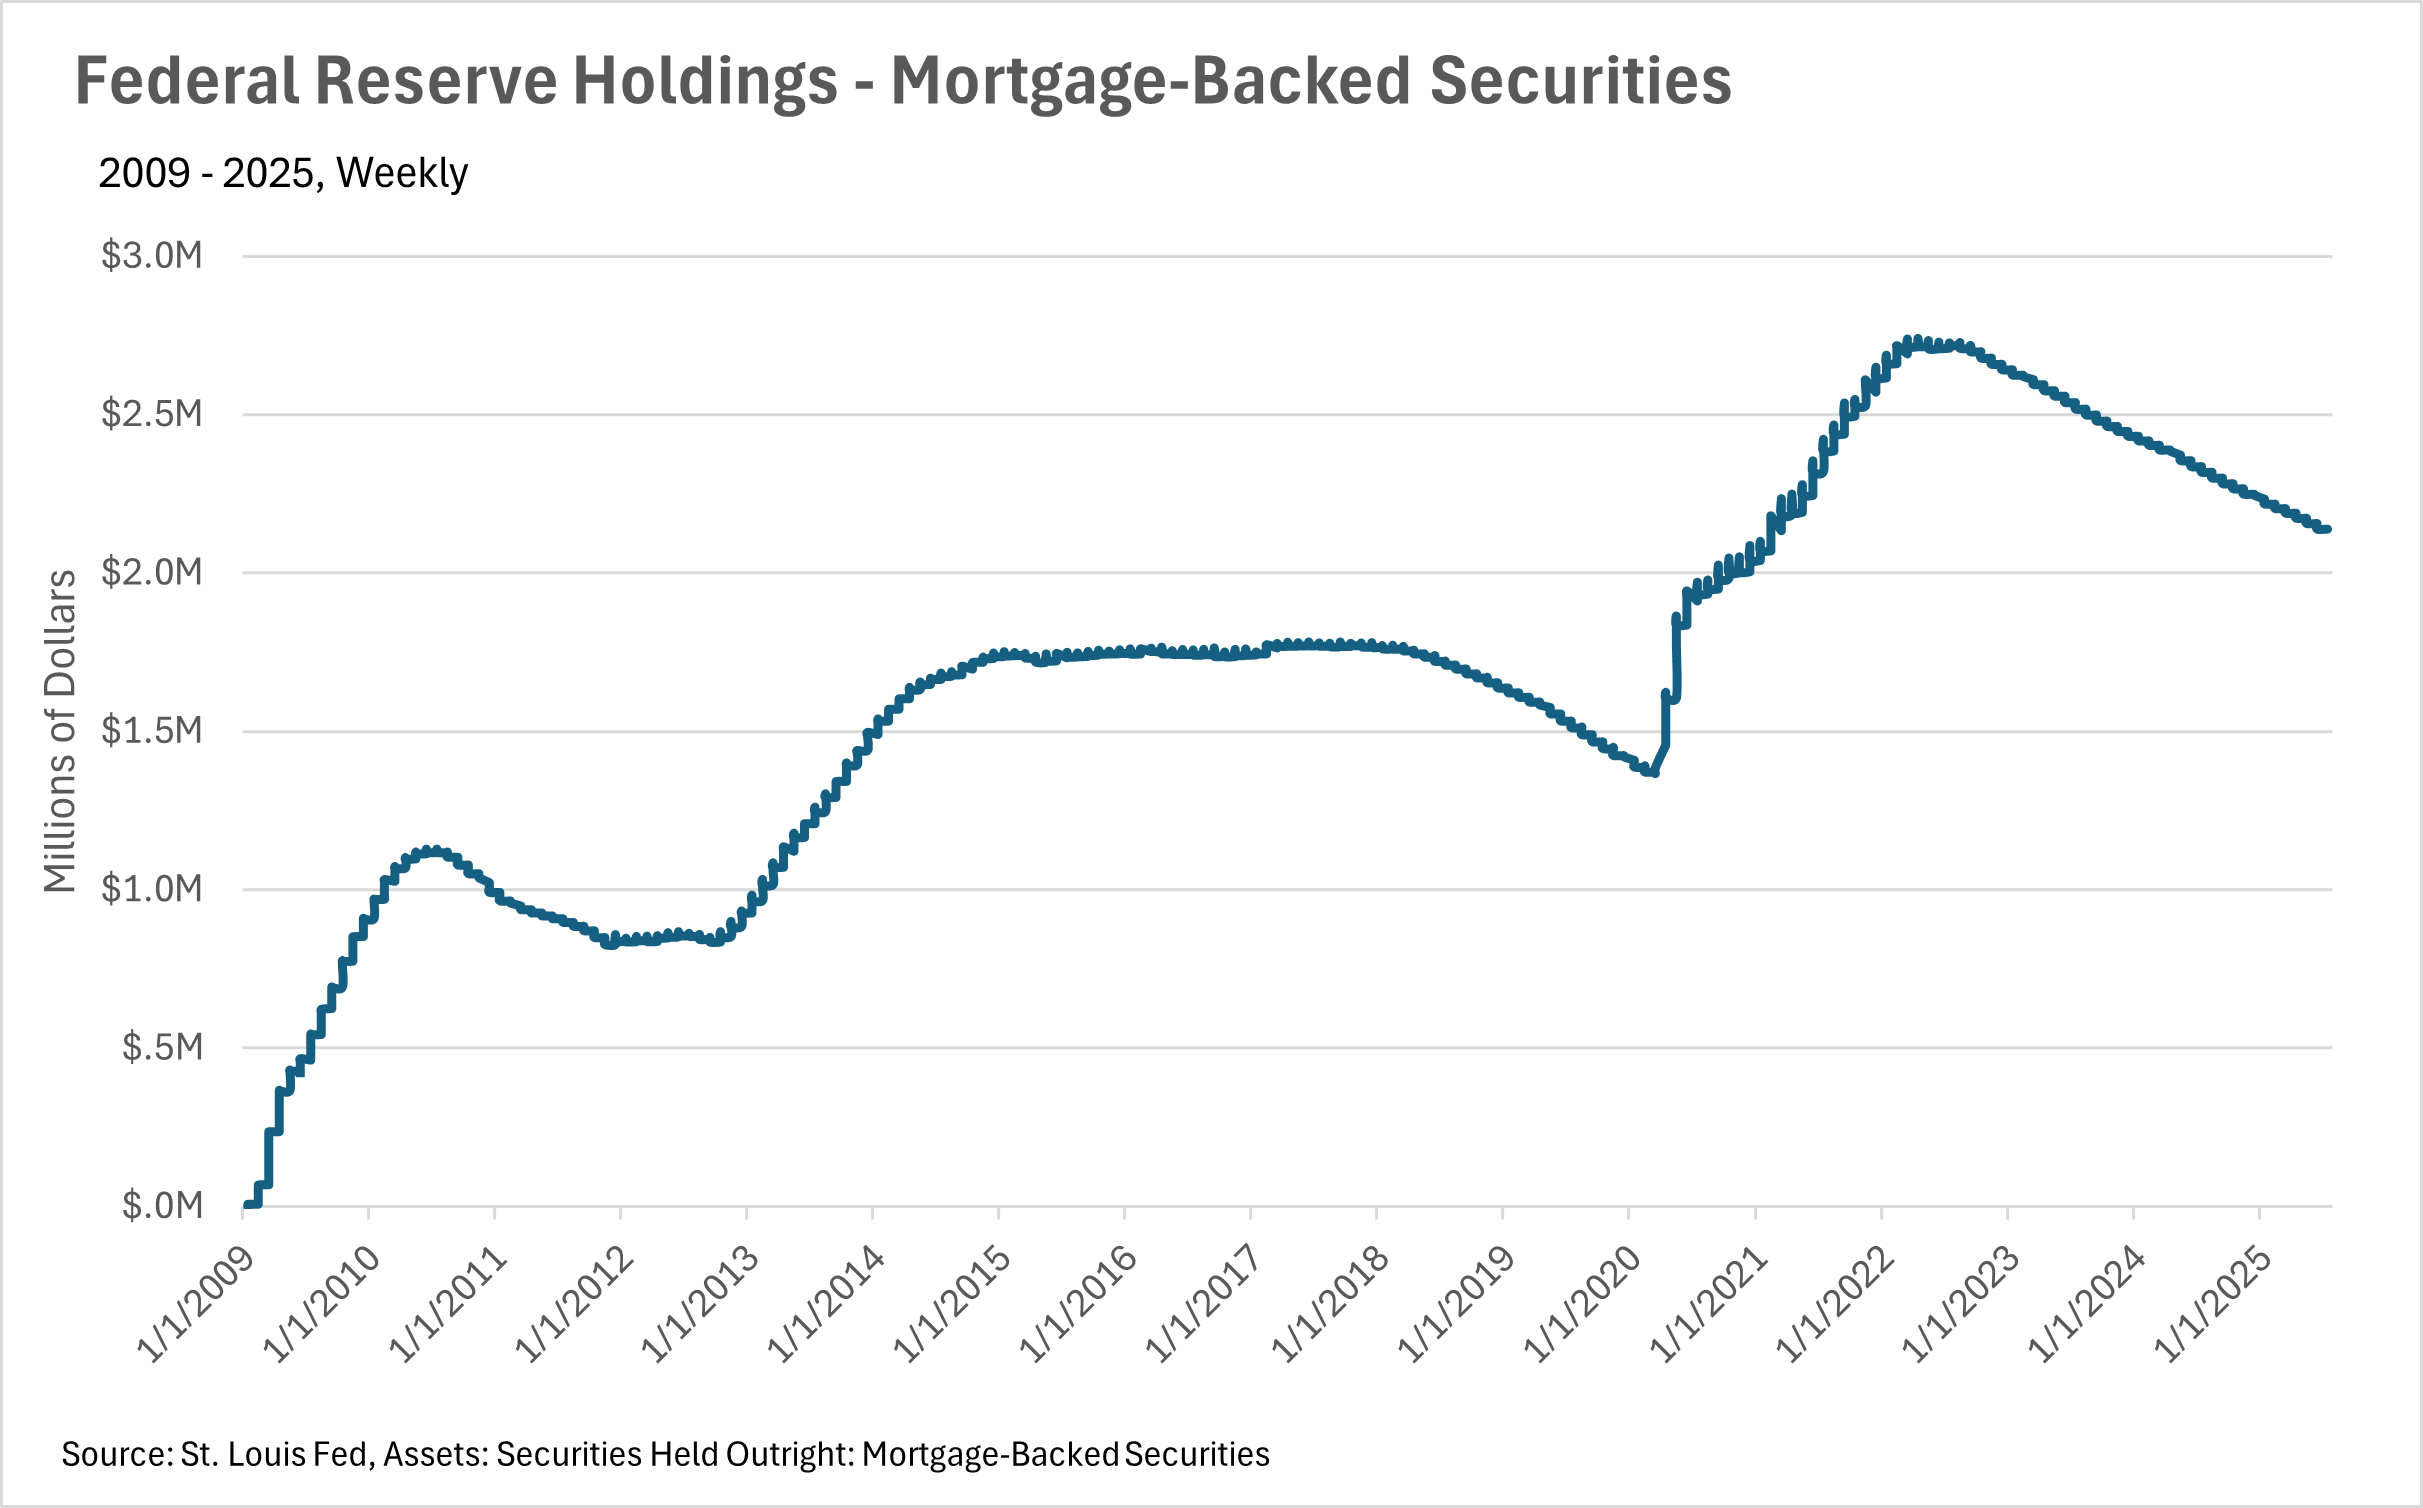
It is worth noting, though, that we might see some discounted rates toward the back half of the year. Although the Fed has not touched the federal funds rate in nearly a year, the Fed chairman has signaled that one to two rate cuts are expected by the end of the year, so long as there aren’t any further spikes in inflation.
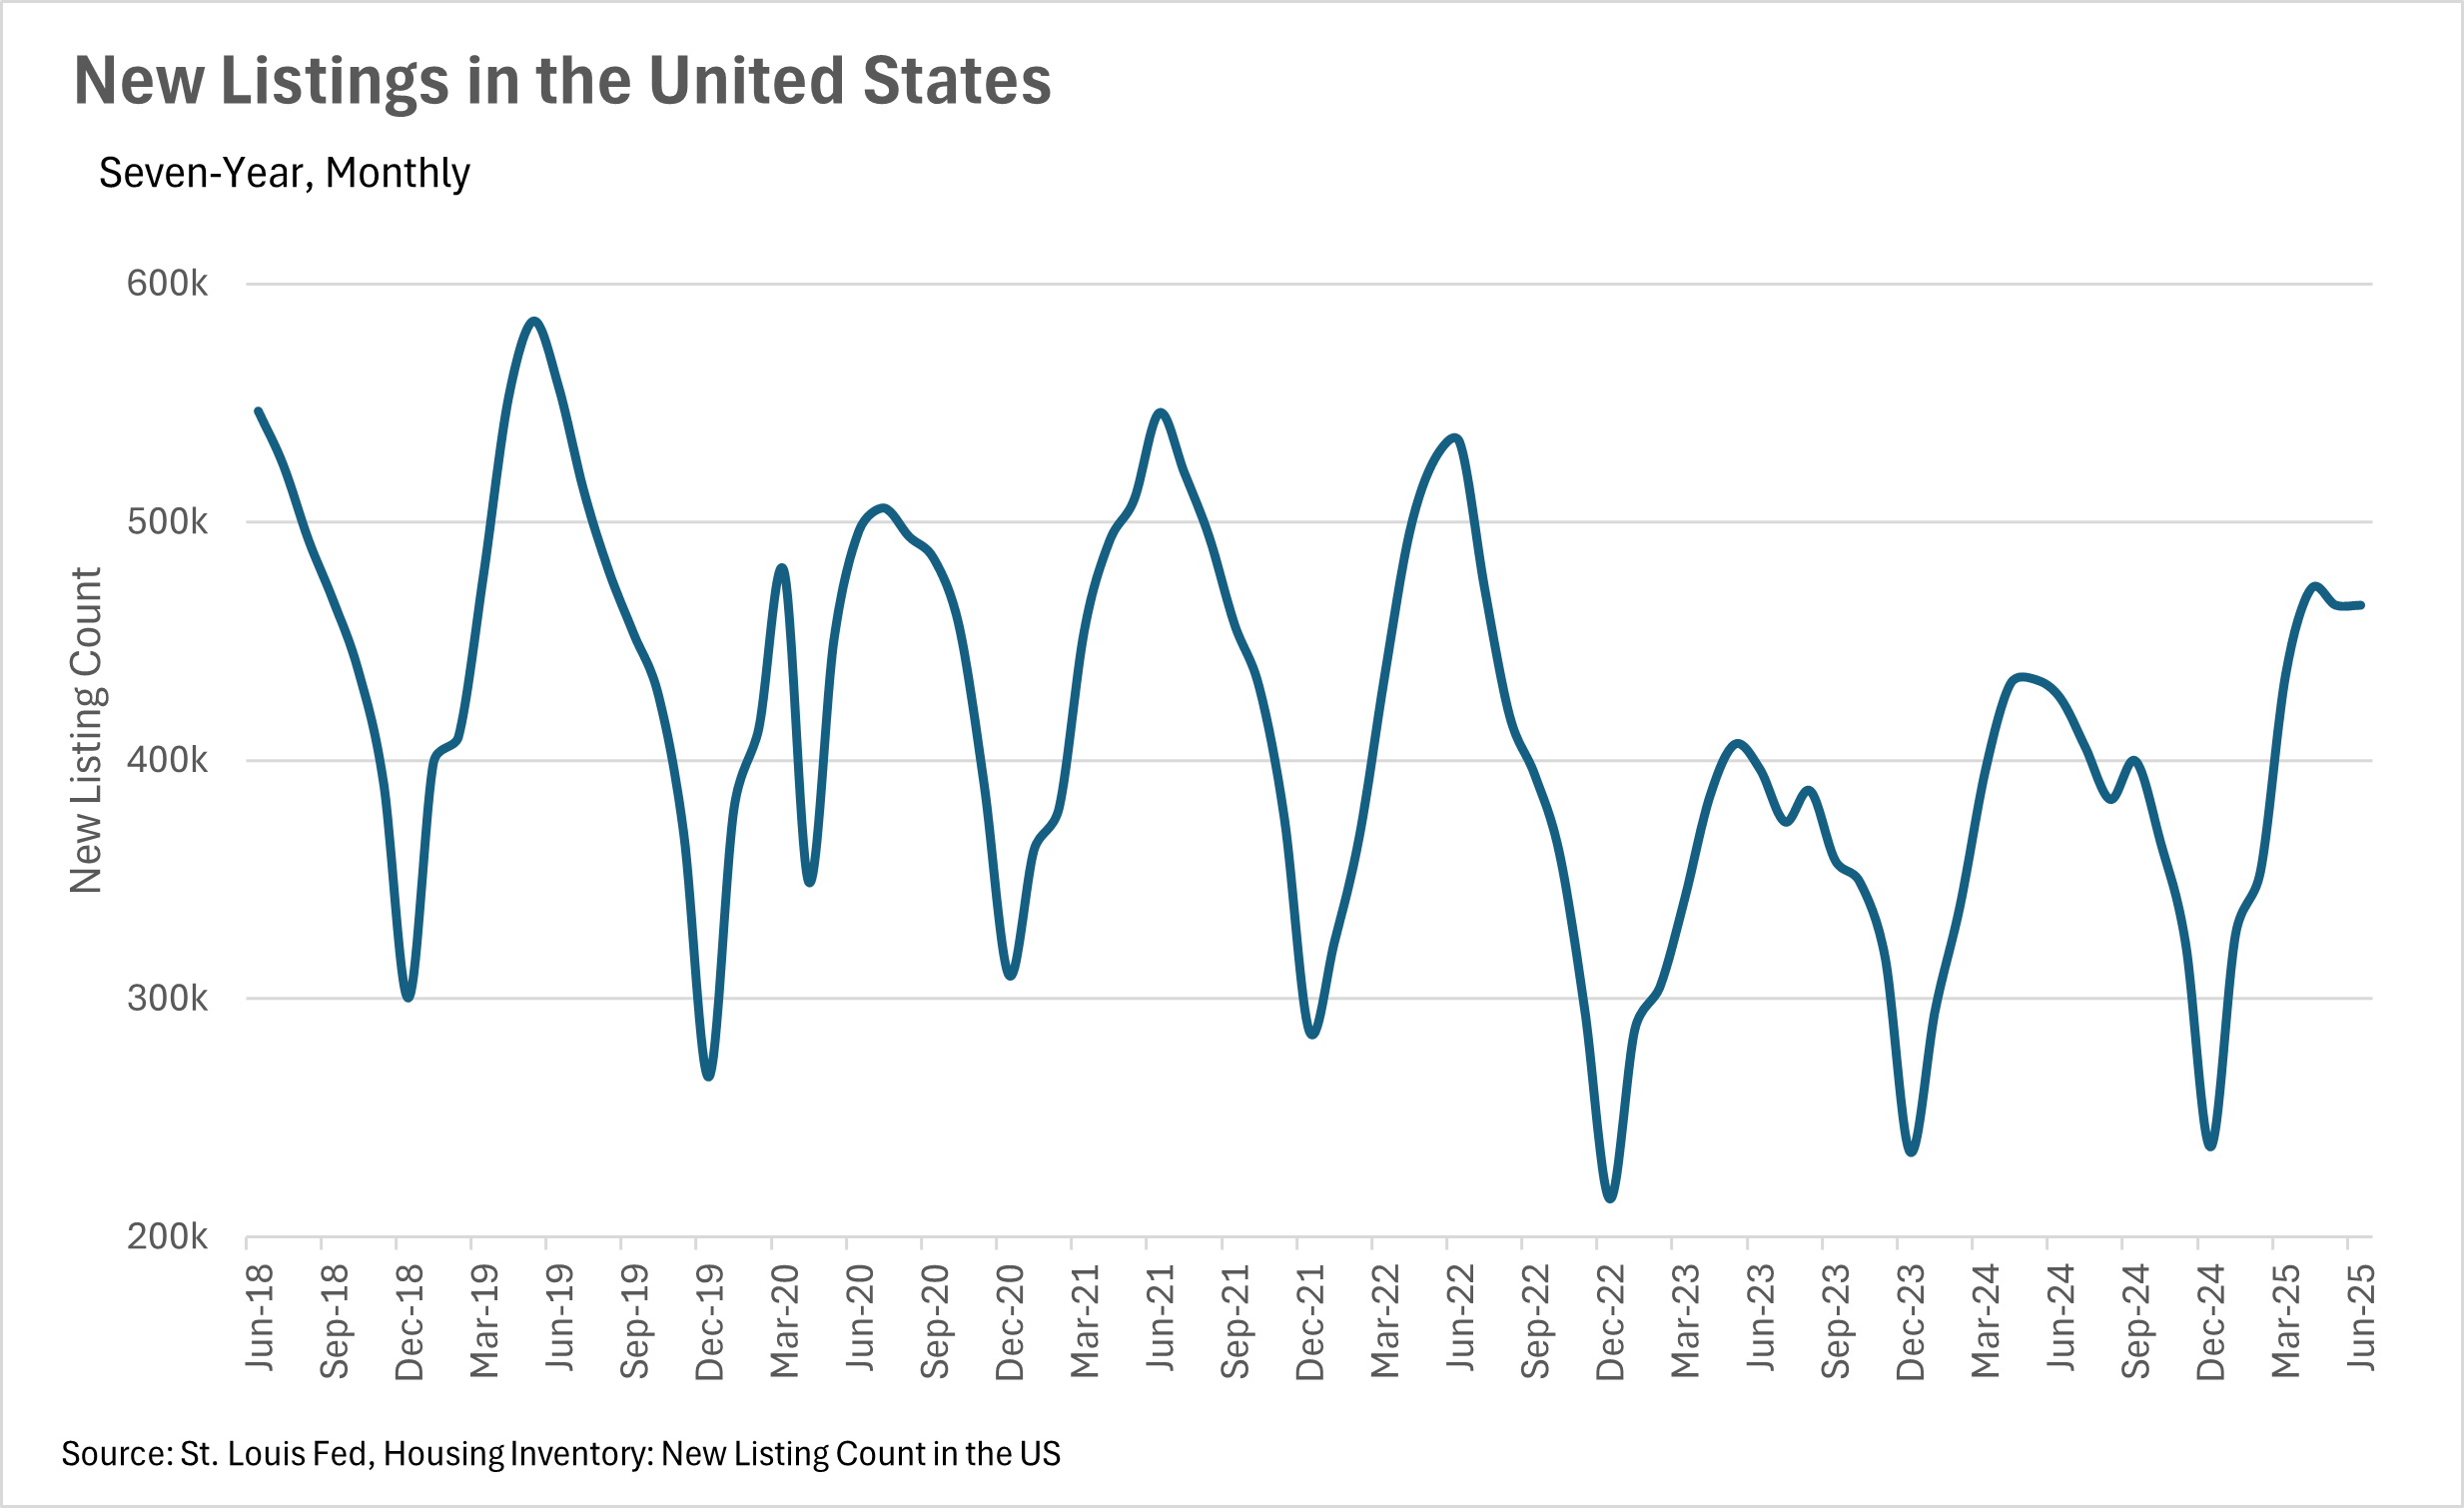
What we have been seeing in terms of inventories in California has been echoed on a nationwide scale. Fewer homes are being sold, with 1.95% fewer existing home sales compared to this time last year. At the same time, 9.95% more new listings have hit the market on a year-over-year basis. This has led overall inventory to increase by 20.31% on a year-over-year basis.
As inventories are piling up, negotiating power will slowly shift from the sellers to the buyers, as buyers have more opportunities, and don’t need to move nearly as quickly as they had to just a year earlier.
In any market, but especially the real estate market, instability is incredibly detrimental. Given the recent rise in uncertainty around tariffs and employment, coupled with continued instability in Europe and the Middle East, both buyers and sellers have become much more cautious.
Inventories are growing throughout California and the broader United States. However, for those who have the capital and a long time horizon, times like these can represent excellent buying opportunities, as good deals are easier to come by.
However, it’s important to note that this is just what we have been seeing at the national level. California markets have largely remained resilient, which we’ll delve into more in the Local Lowdown section below.
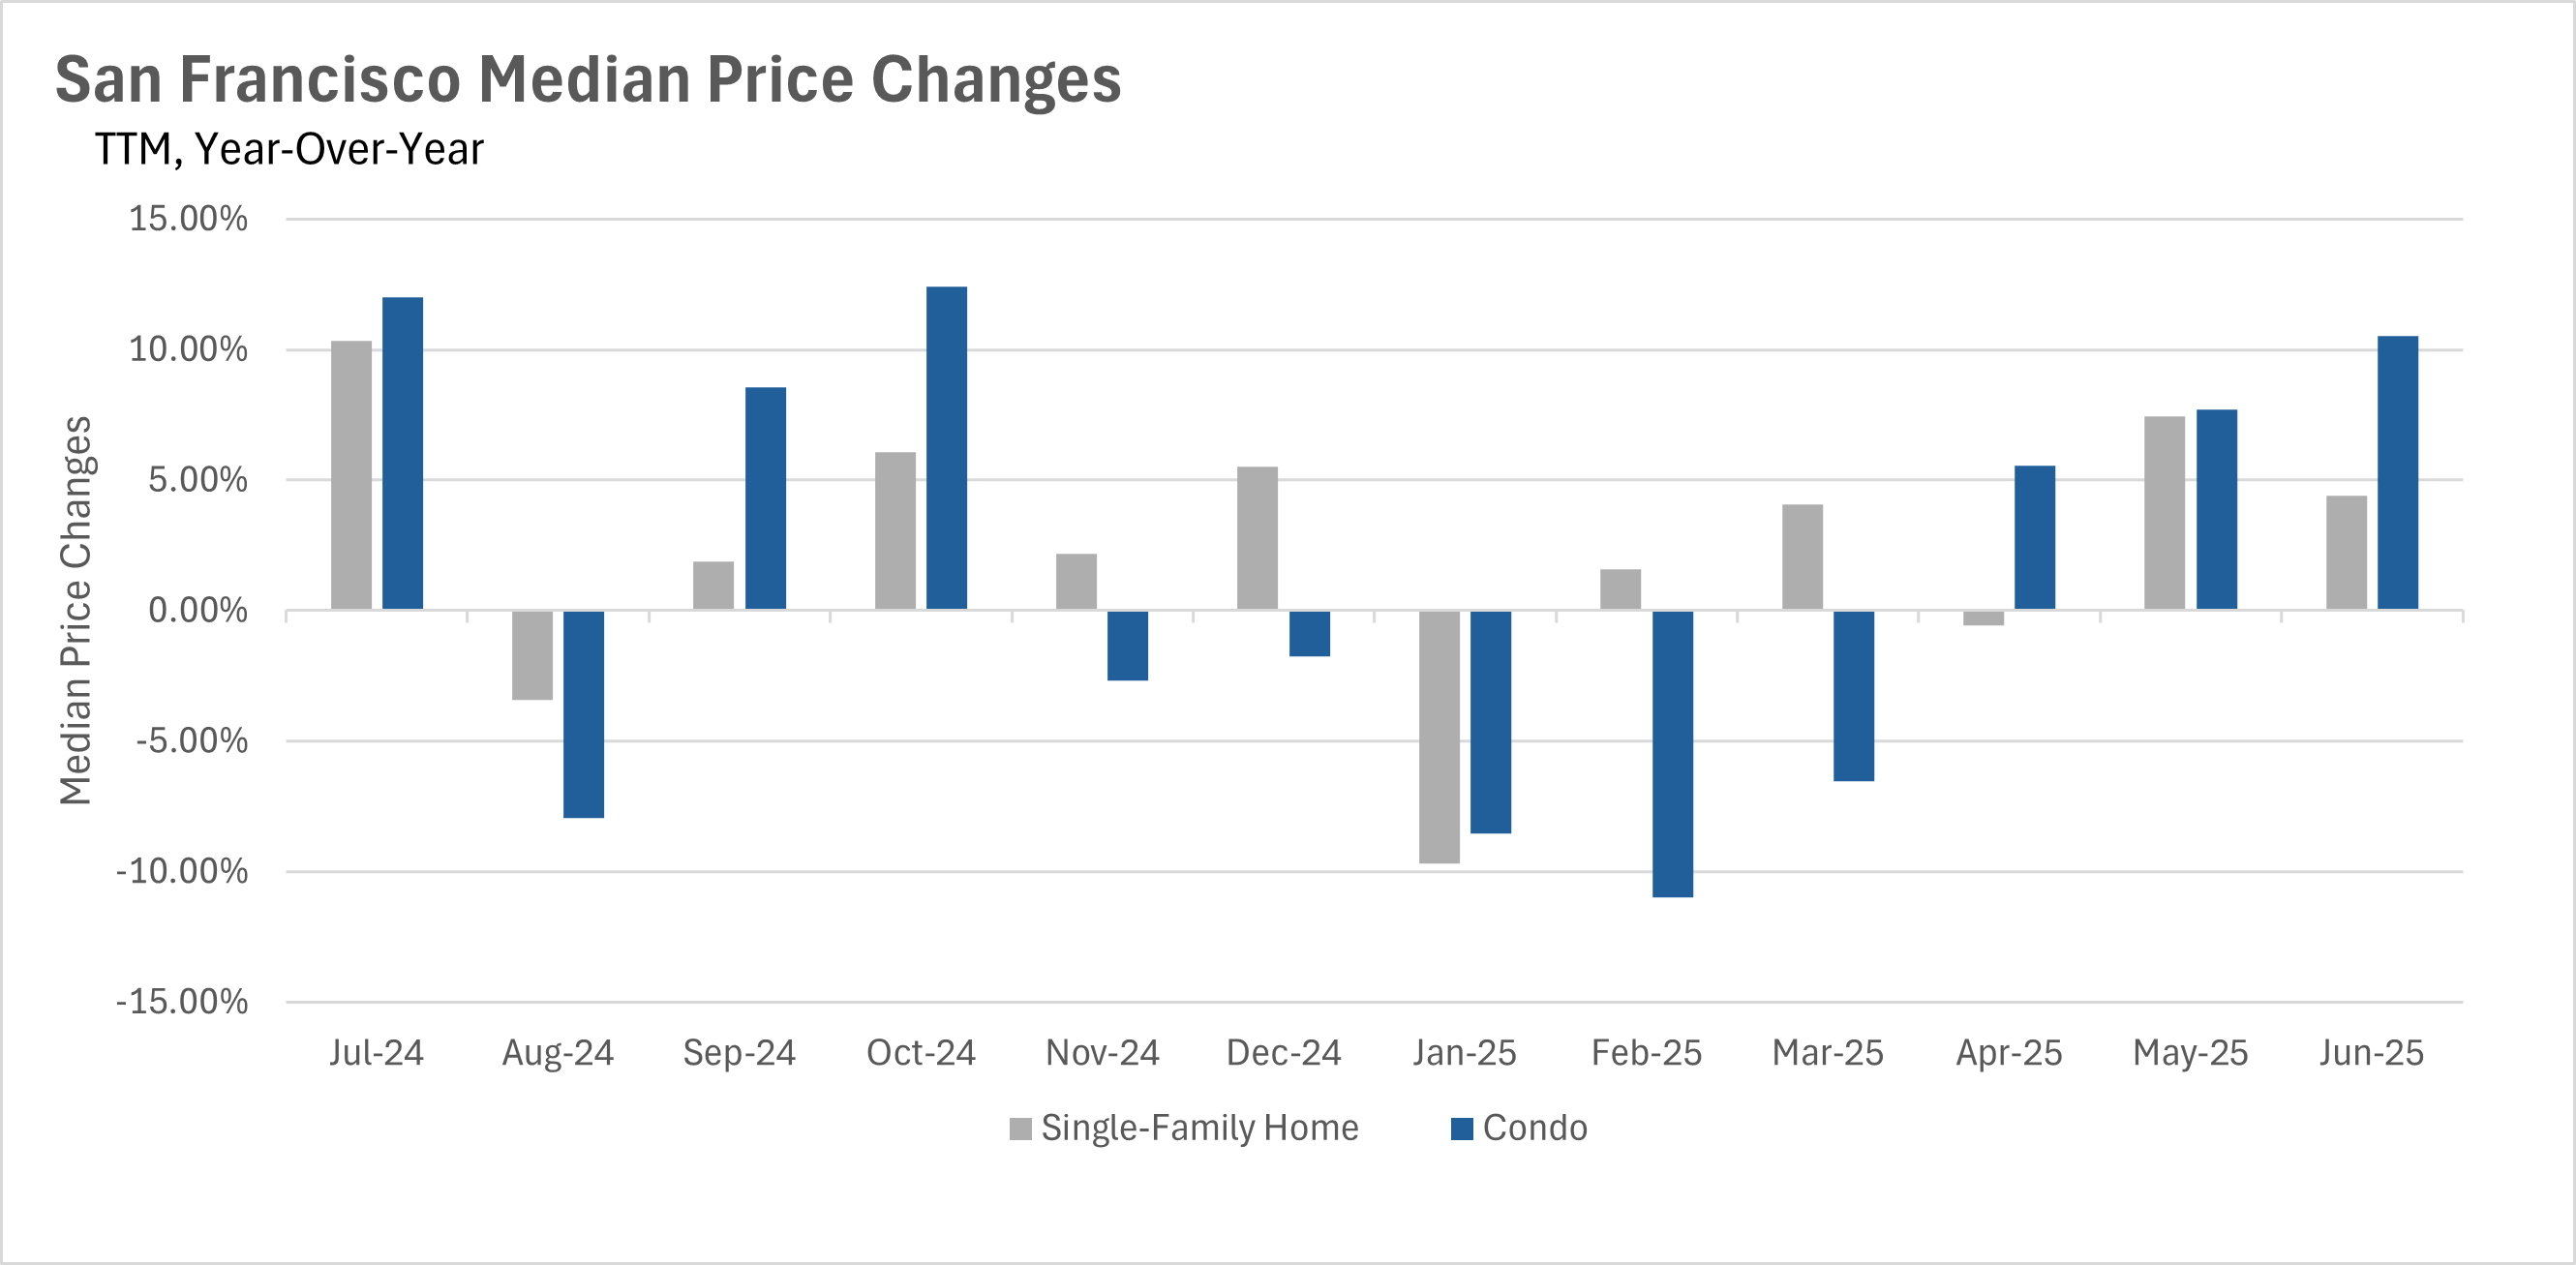
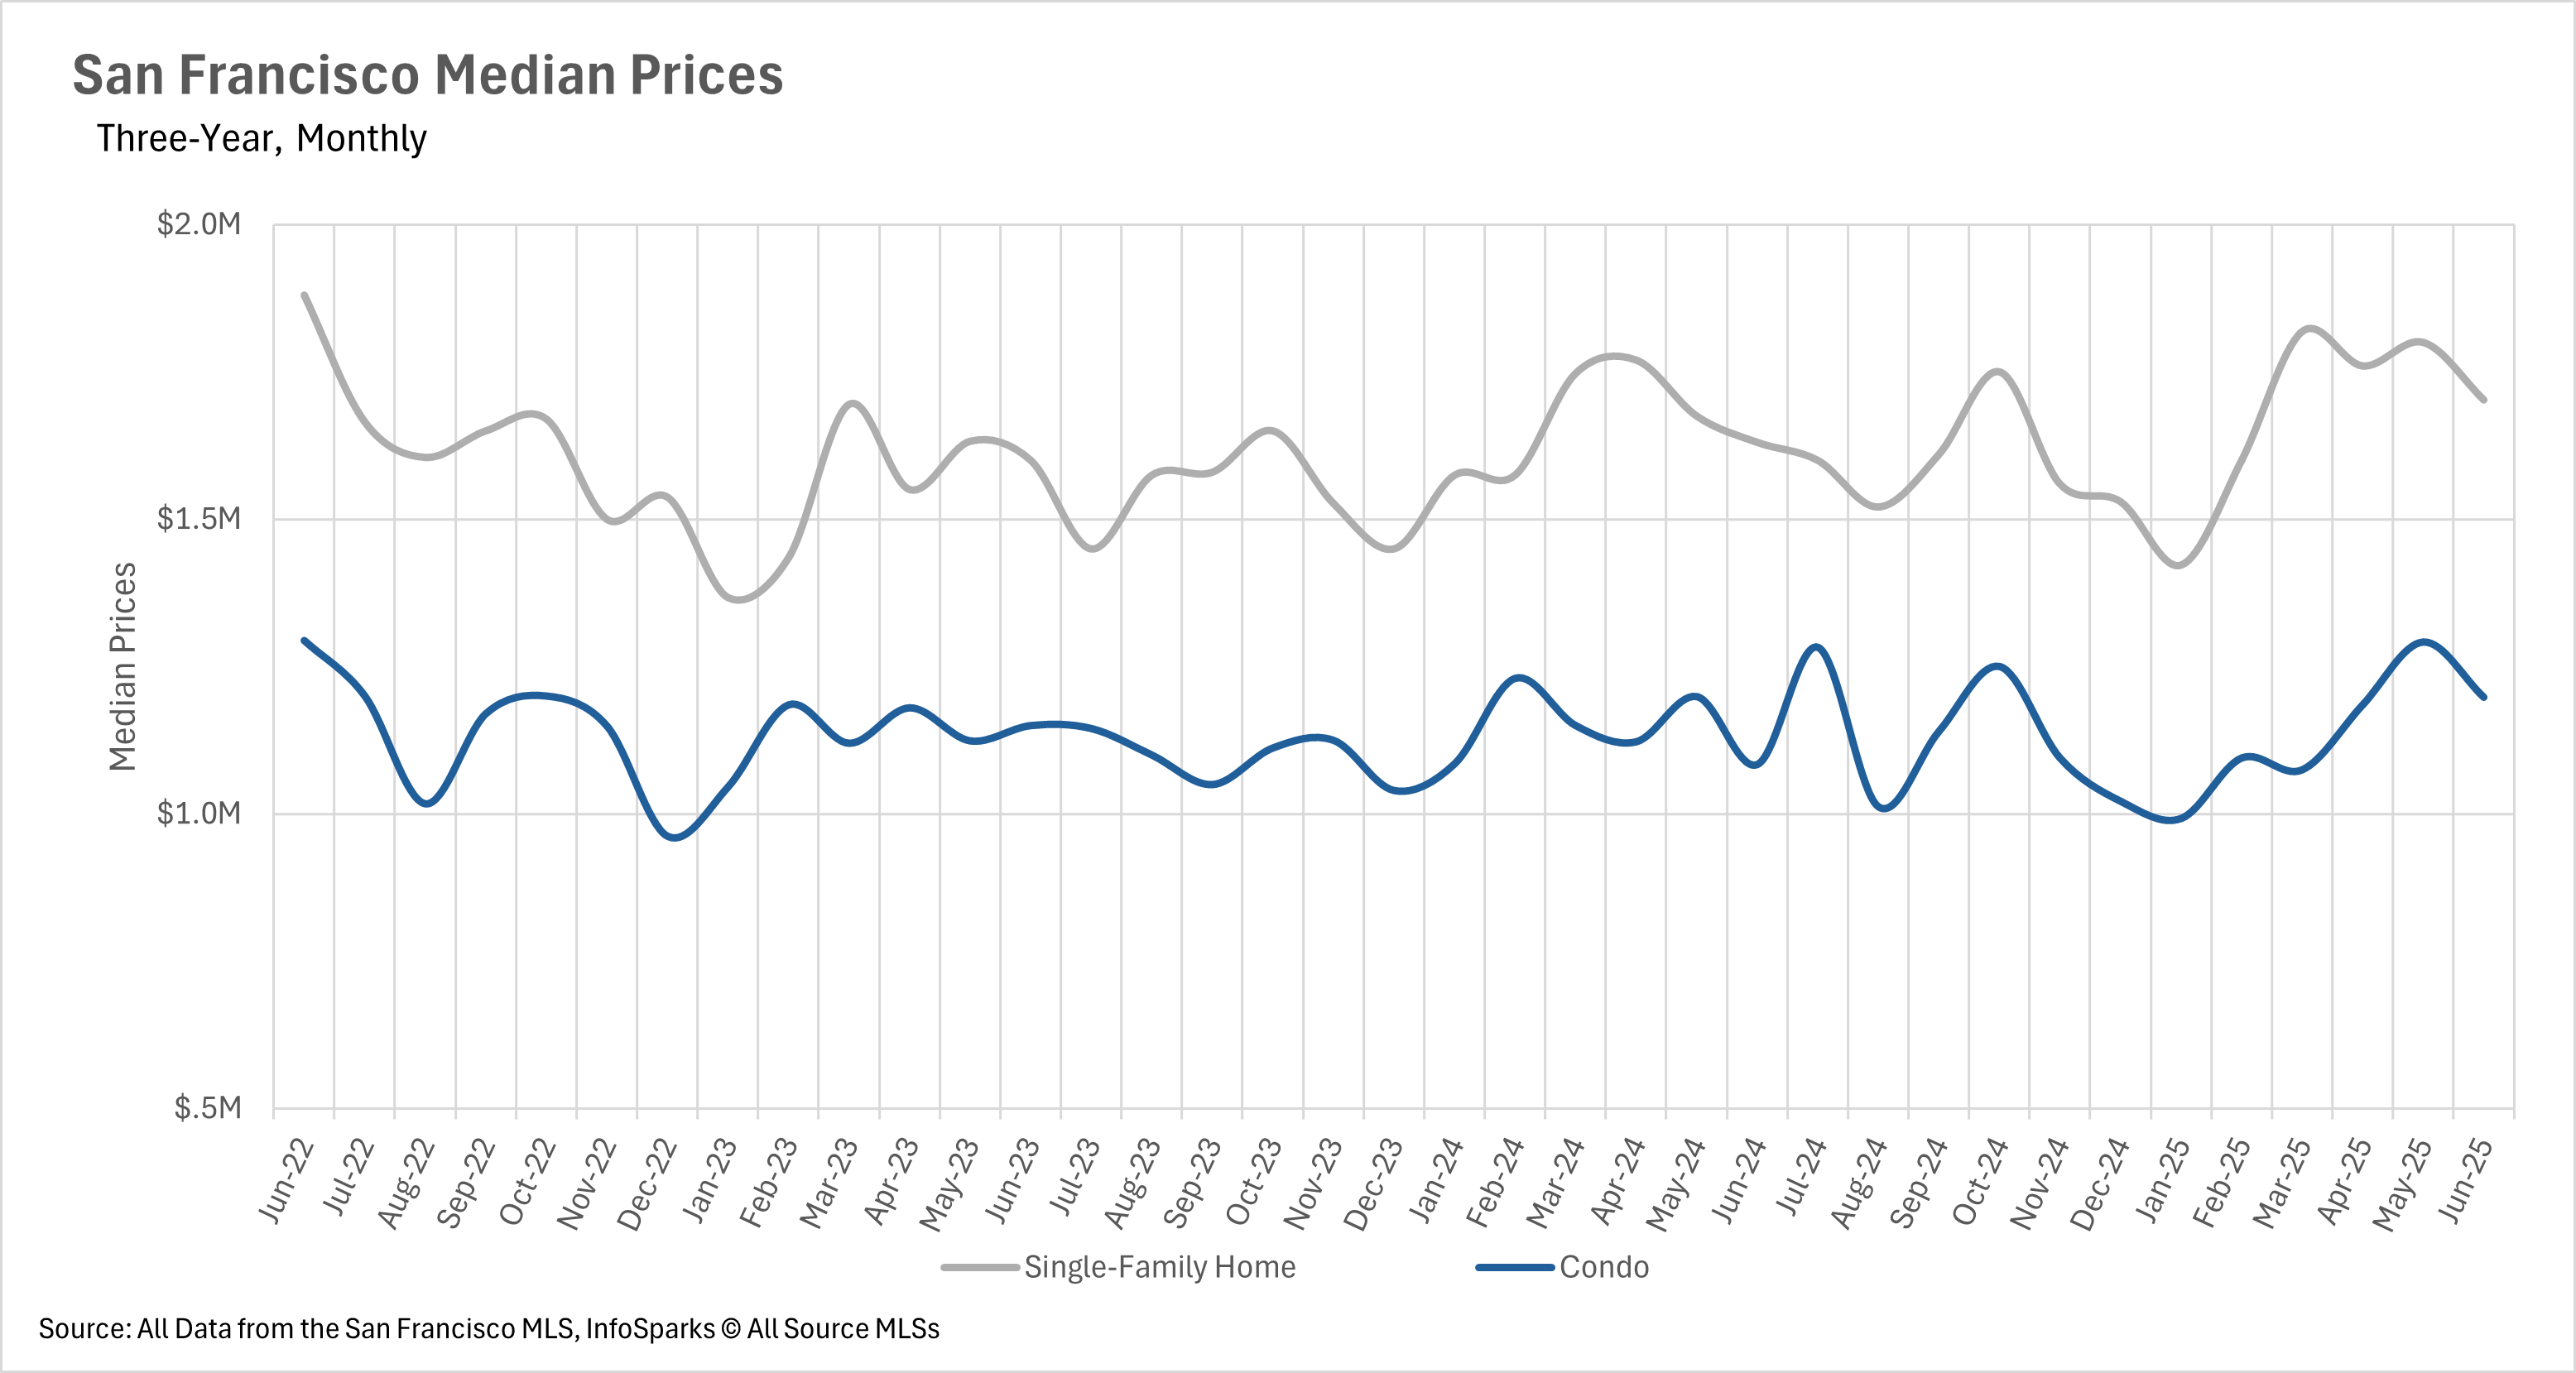
Median sale prices continued to increase throughout San Francisco in the month of June.
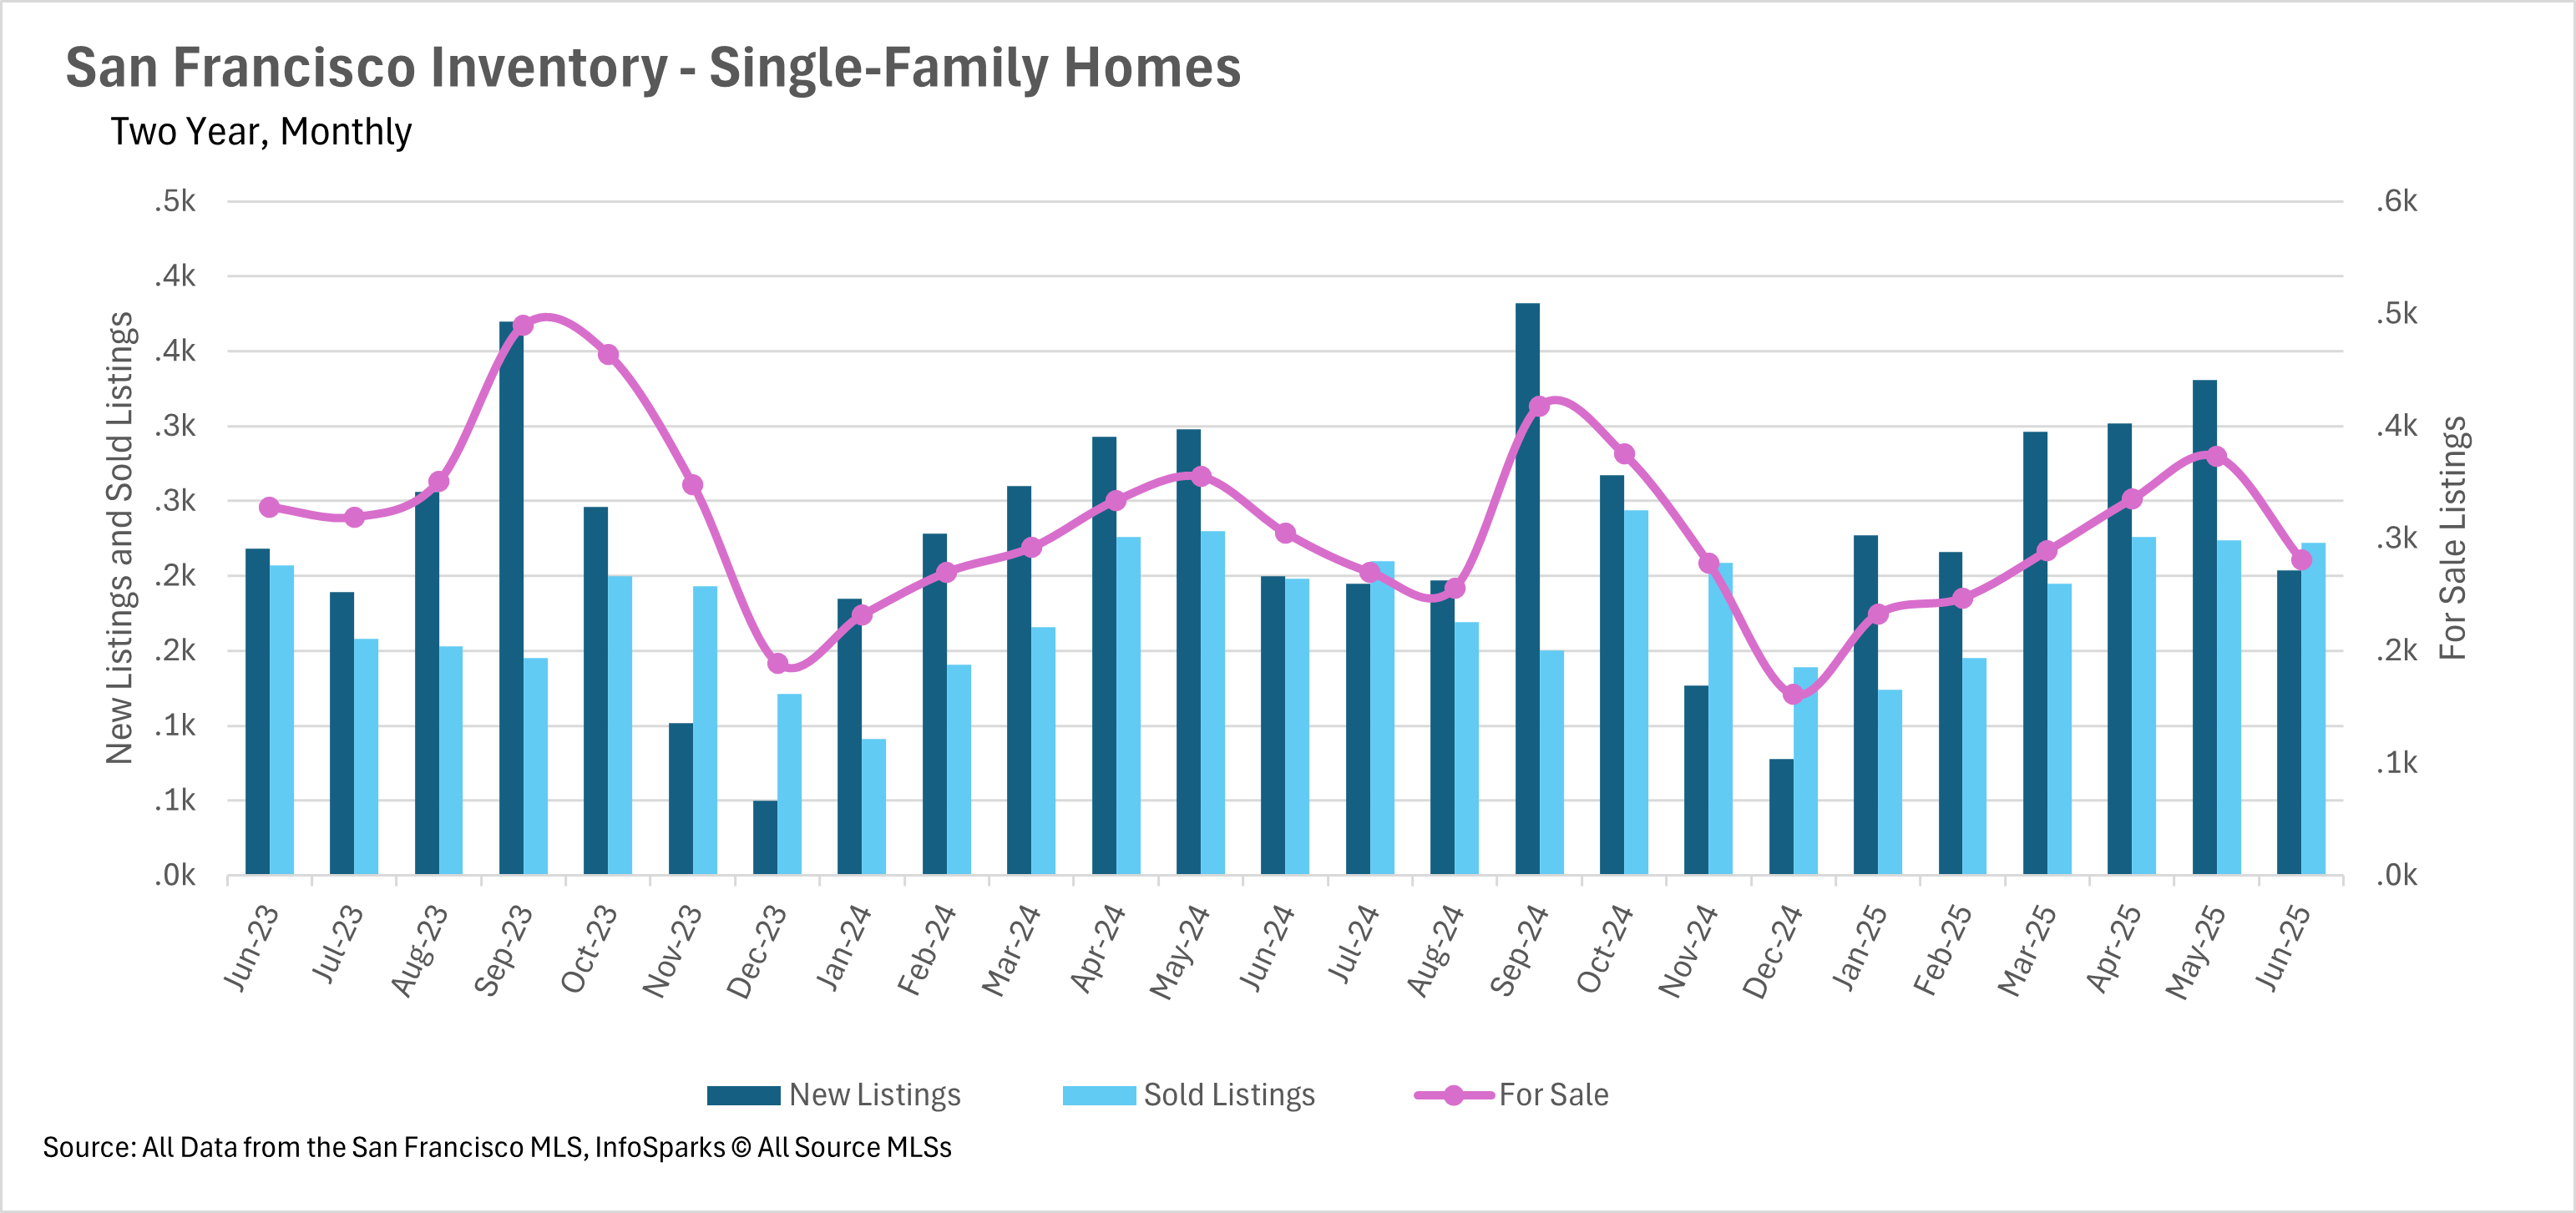
Inventory continues to be a huge issue in San Francisco, as levels continue to dwindle.
Due to the inventory constraints in the area, listings are scooped up off the market at breakneck speed.
Note: You can find the charts/graphs for the Local Lowdown at the end of this section.
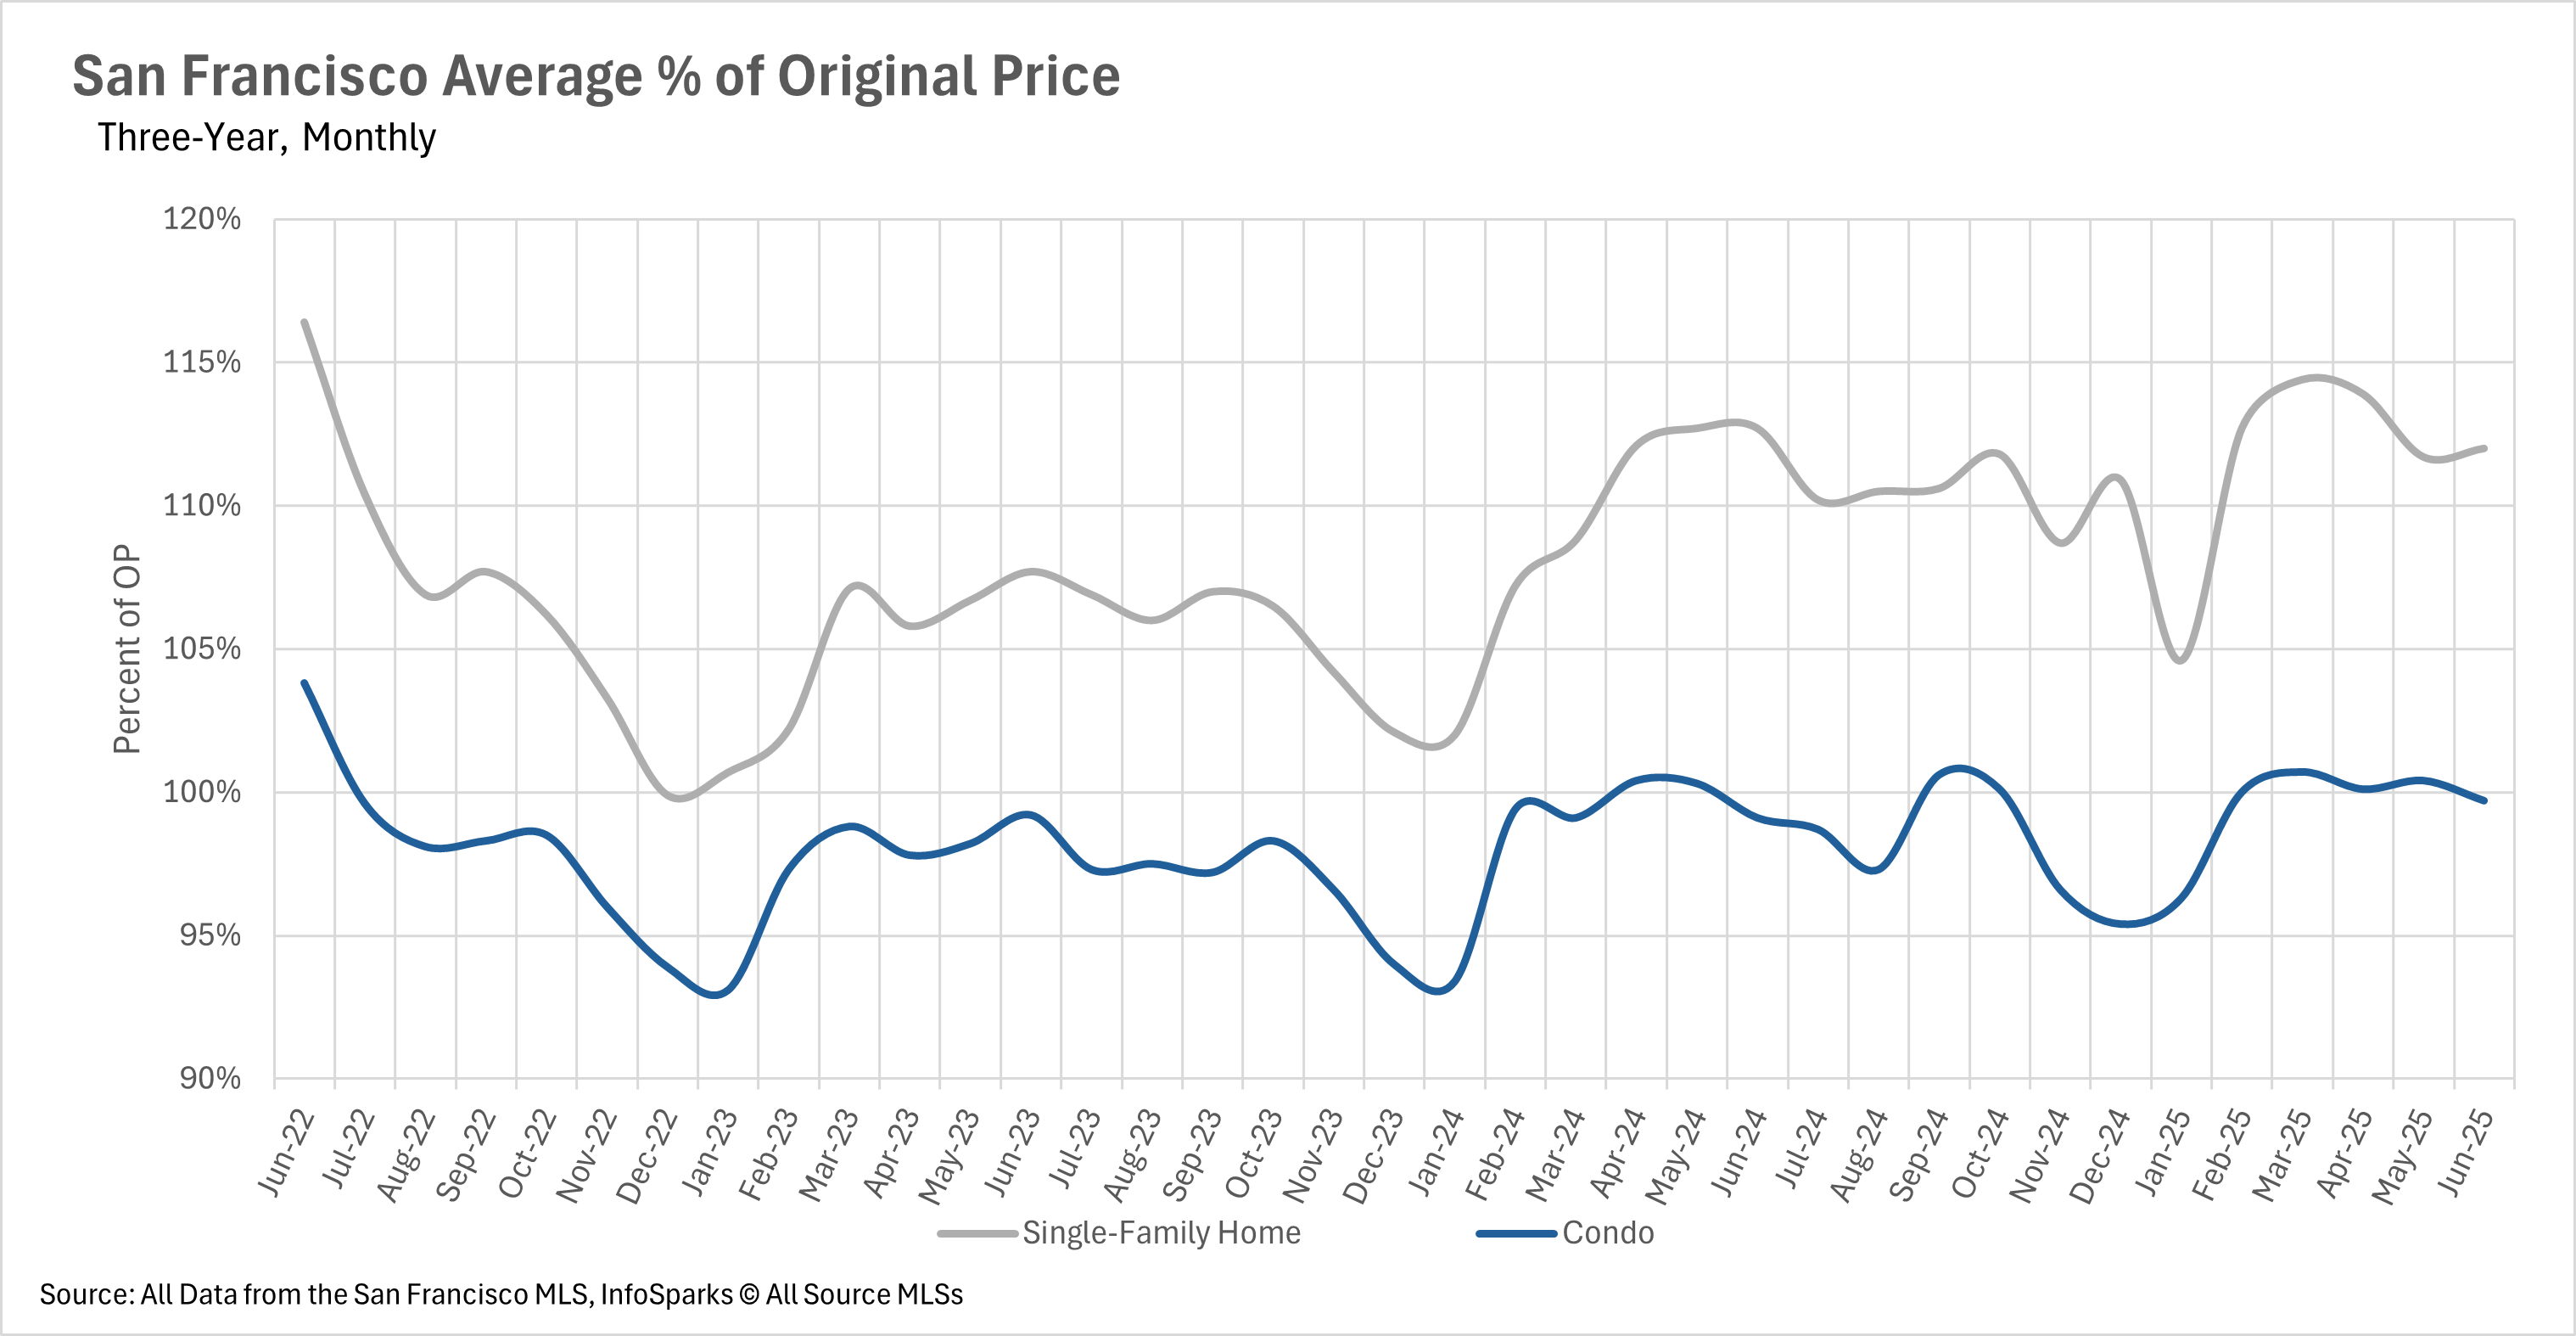
Median sale prices have been on the rise over the past few months in San Francisco, and there was no exception in the month of June.
Single-family home median sale prices rose by 4.42% year-over-year
Condo median sale prices rose by 10.52% year-over-year
Additionally, the average single-family home sells for 112% of the original listing price, while the average condo sells for 99.7% of the original listing price.
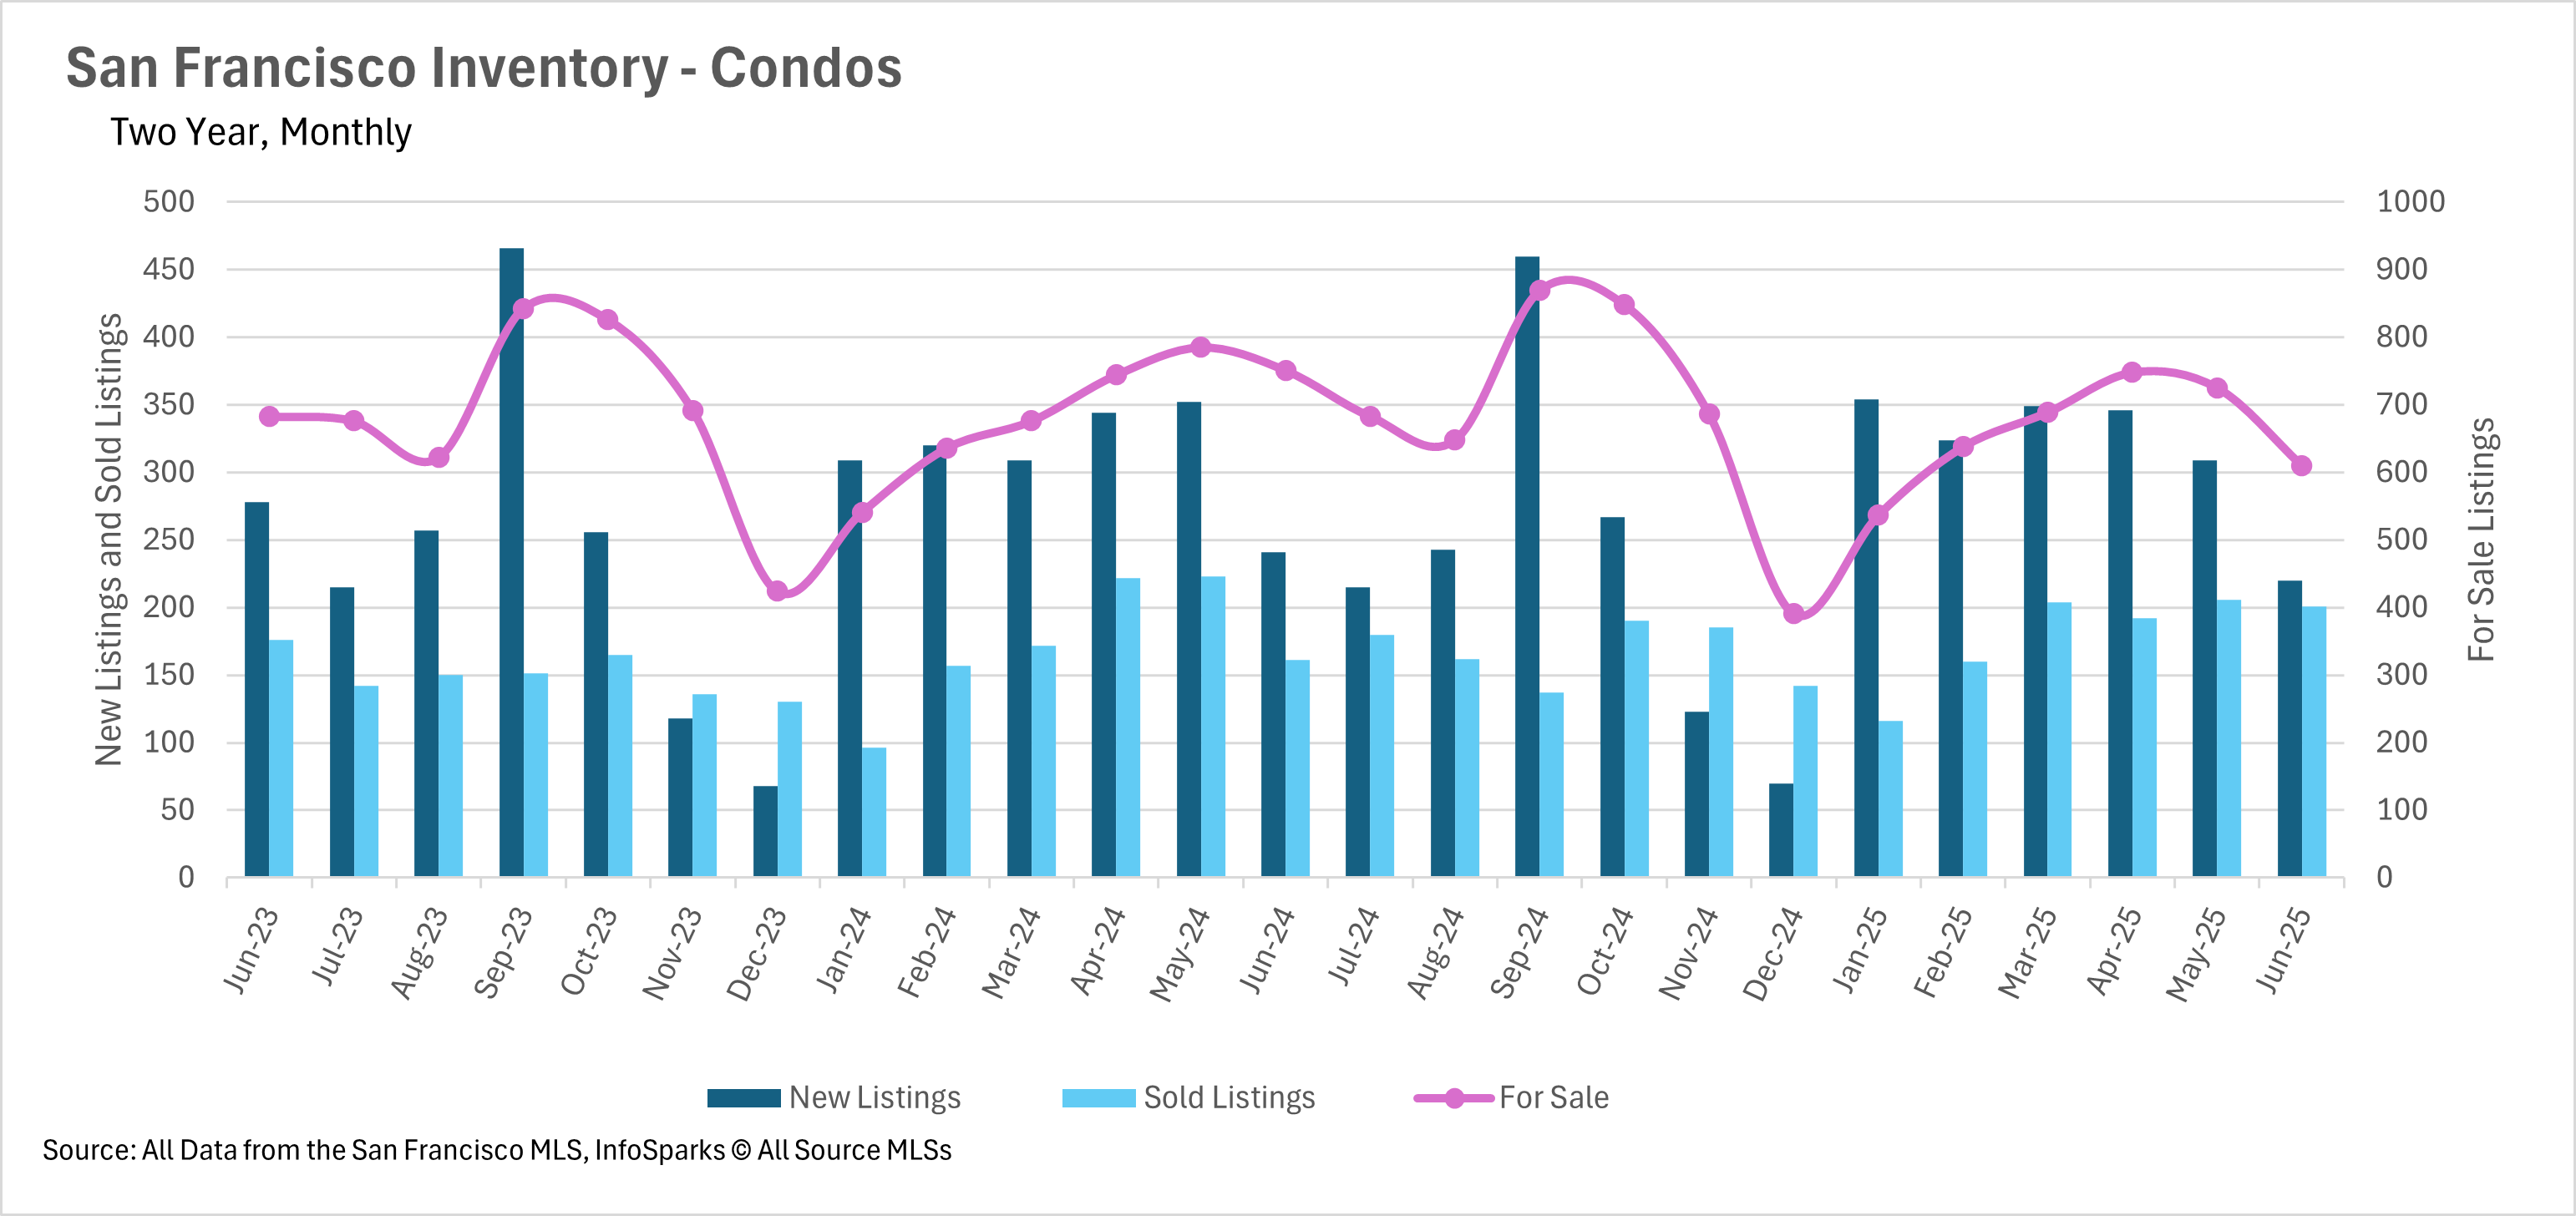
This rise in prices that we’ve seen has been fueled by a lack of new supply hitting the market. Each and every month, we’ve seen inventories slowly get bought up and seemingly taken off the market for good.
In the month of June:
7.87% fewer single-family homes were on the market compared to this time last year
18.77% fewer condos were listed on the market year-over-year
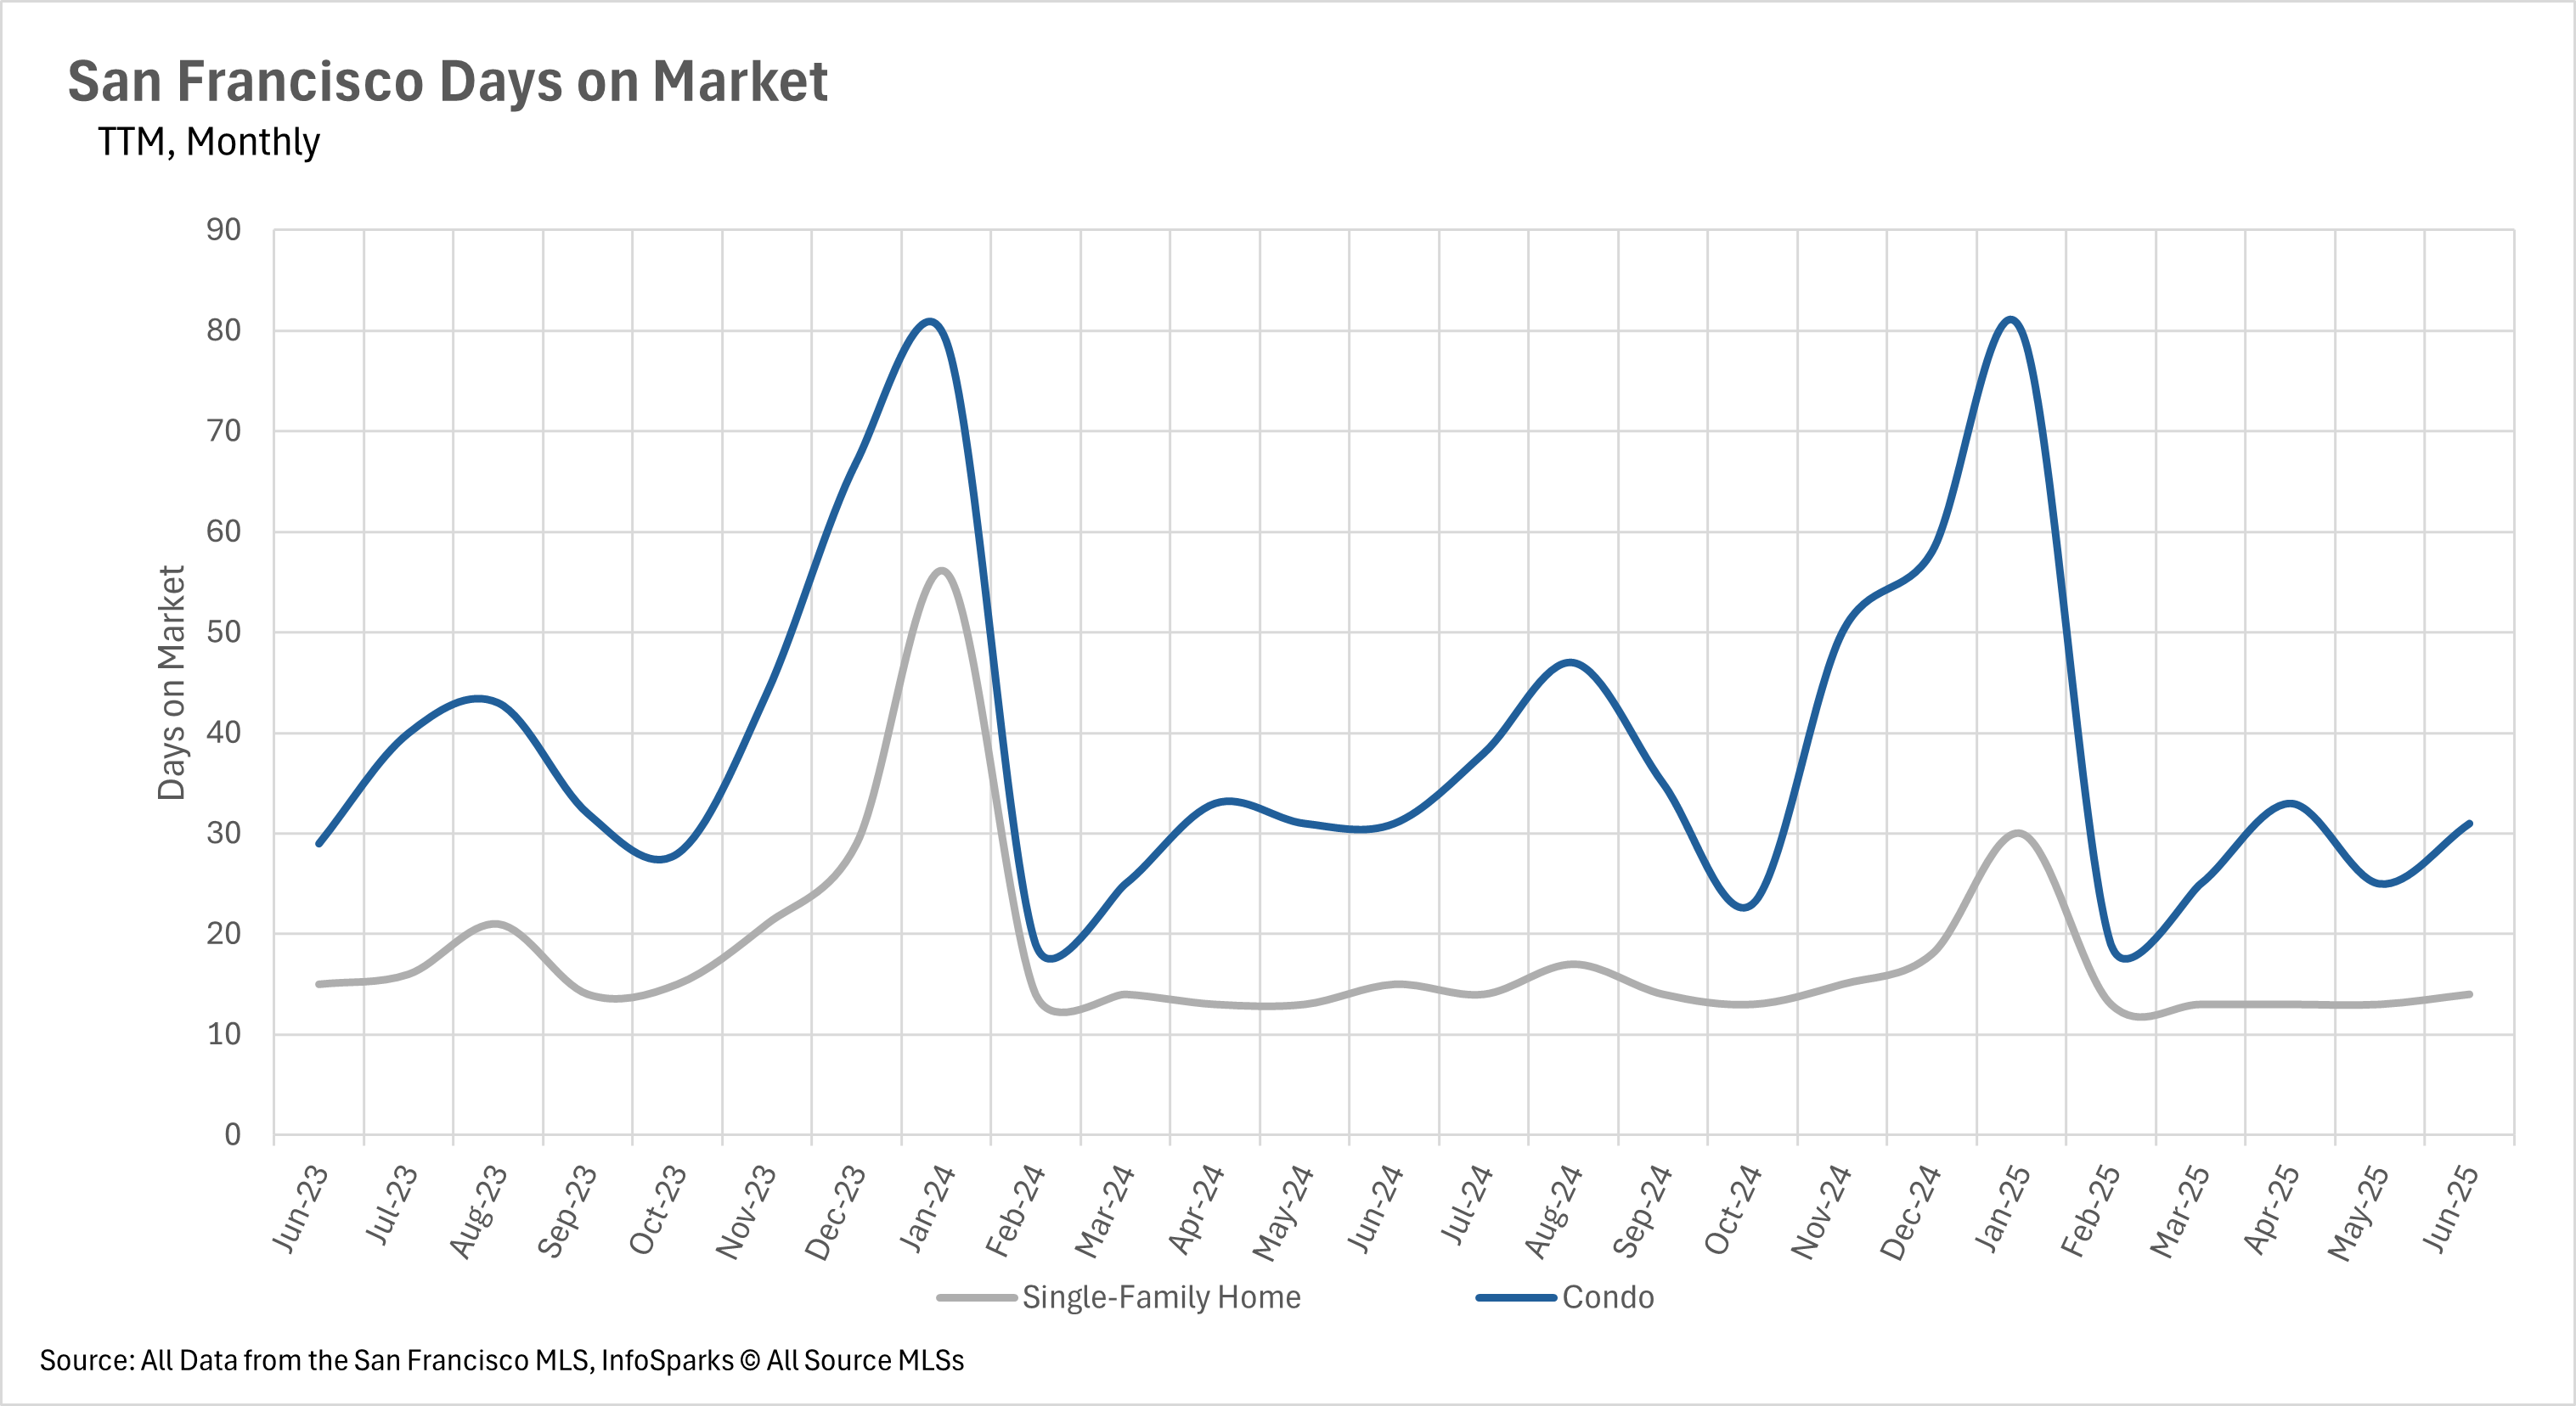
As you might expect, given the rising prices and inventory issues throughout San Francisco, listings are being bought up incredibly quickly.
Single-family homes spend just 14 days on the market (6.67% YoY decrease)
Condos spend 31 days on the market (no change YoY)
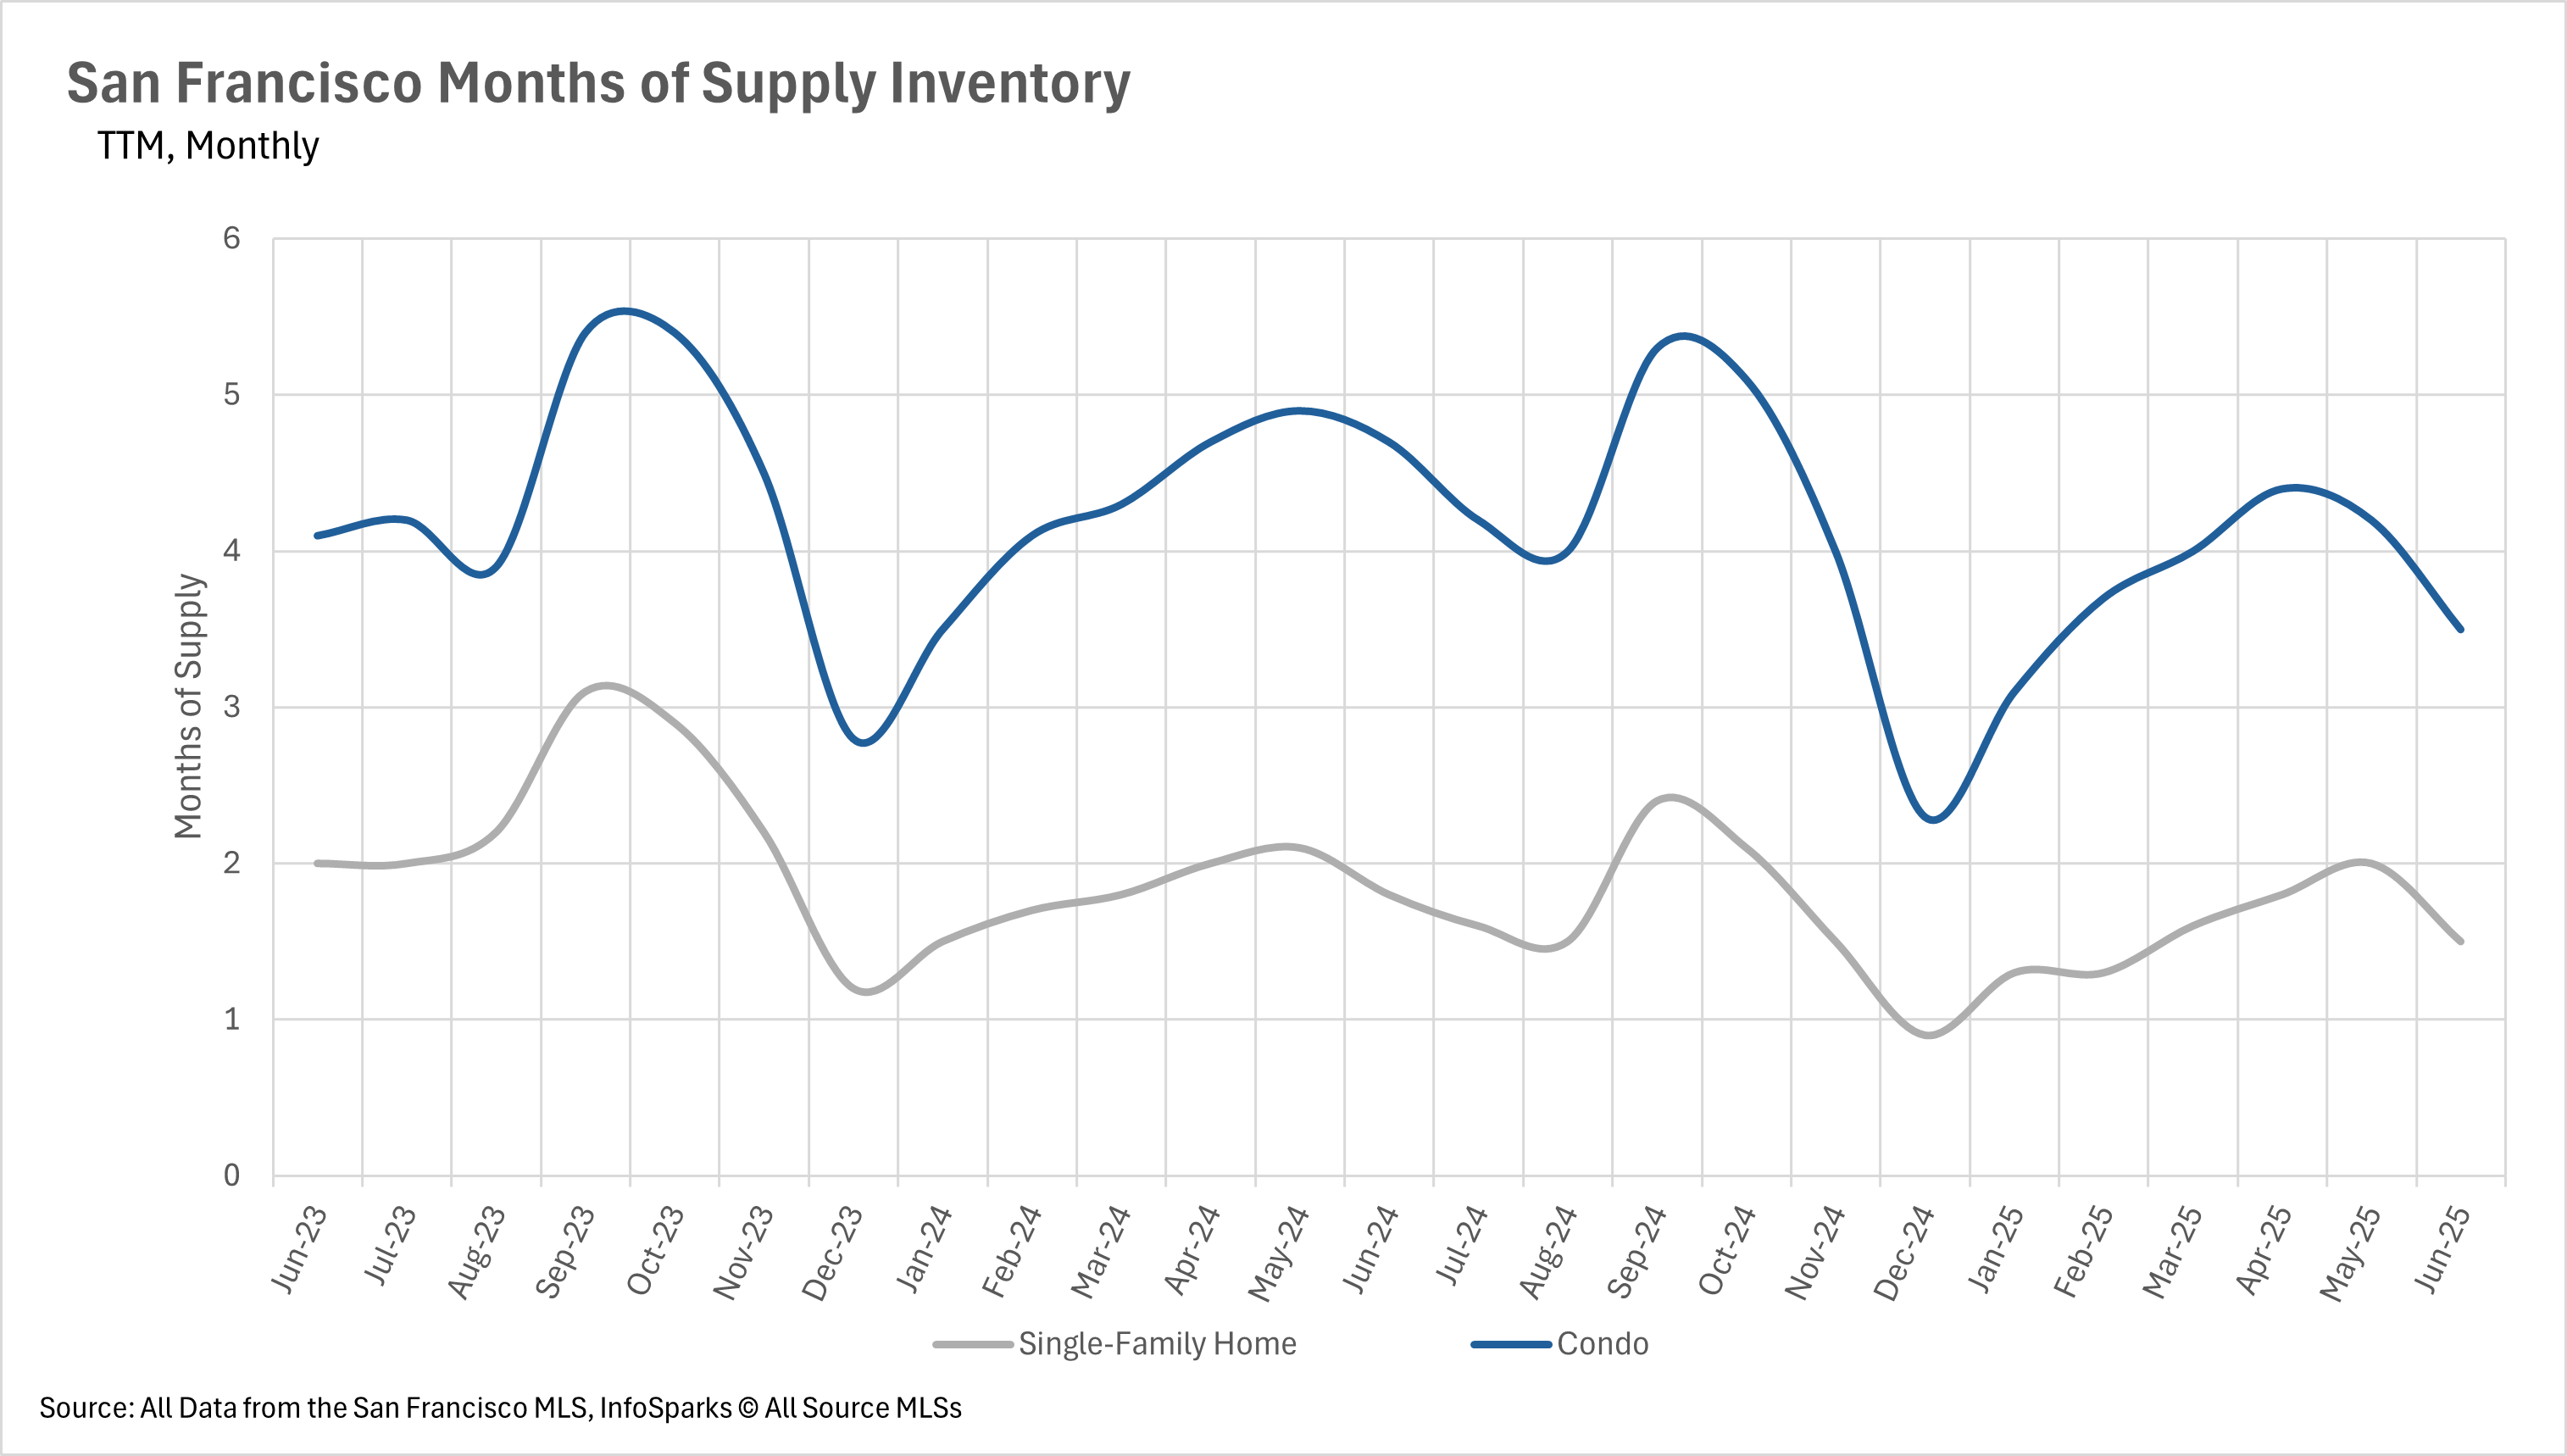
To determine whether a market favors buyers or sellers, we use the Months of Supply Inventory (MSI) metric.
Historically, California averages around 3 months of MSI (a balanced market)
< 3 months = Seller’s market
> 3 months = Buyer’s market
Single-family homes in SF had just 1.5 months of supply → firmly a seller’s market
Condos had 3.5 months of supply → slightly favors buyers, but leverage is slipping
Stay up to date on the latest real estate trends.

June 24, 2026
Download our Free Guide

June 24, 2026
Home Prices Surge Past $2.2 Million as Inventory Remains Critically Low

June 17, 2026
A current buyer’s guide to private listings, Coming Soon homes, Zillow Preview, agent networks, and pre-market opportunities.

June 11, 2026
Discover the cafés, tea shops, parks, and neighborhood amenities that make Dogpatch one of San Francisco's most vibrant places to live.
You’ve got questions and we can’t wait to answer them.