May Housing Market Update
May 29, 2020

May 29, 2020
Can you believe it’s already the end of May? This has been an interesting yet challenging month as we come to terms with a lot of change in the way we run our business, meet people, and sell homes. One thing that hasn’t changed though is our love for delving into the fascinating world of San Francisco housing statistics and that is precisely what we are going to share with you today.
Here are two notable takeaways and we are pleased to say there is some relatively good news to share:
What does that mean? It means activity is actually returning to the San Francisco housing market and recovery may already be underway.
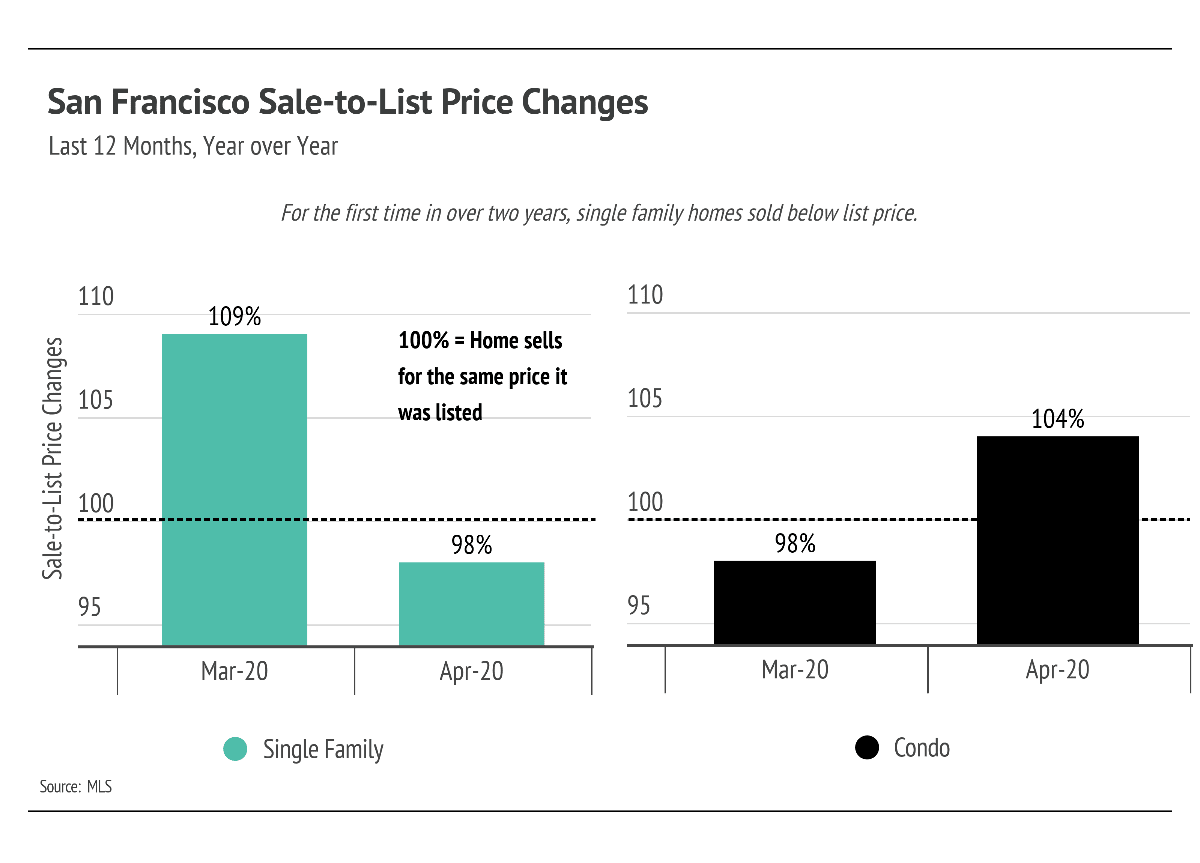
Buyers rejoice*. In April, single-family home sellers accepted offers at a discount for the first time in over a year. This tells us that sellers are finally making price concessions and that buyers have a bit more negotiating power.
*note that the sample size for April sales is over 50% smaller than usual, so these metric outliers may not be pointing to the start of a new trend. We are watching it closely.
Have A Question About What This All Means For Your Home Value? DROP US A LINE.
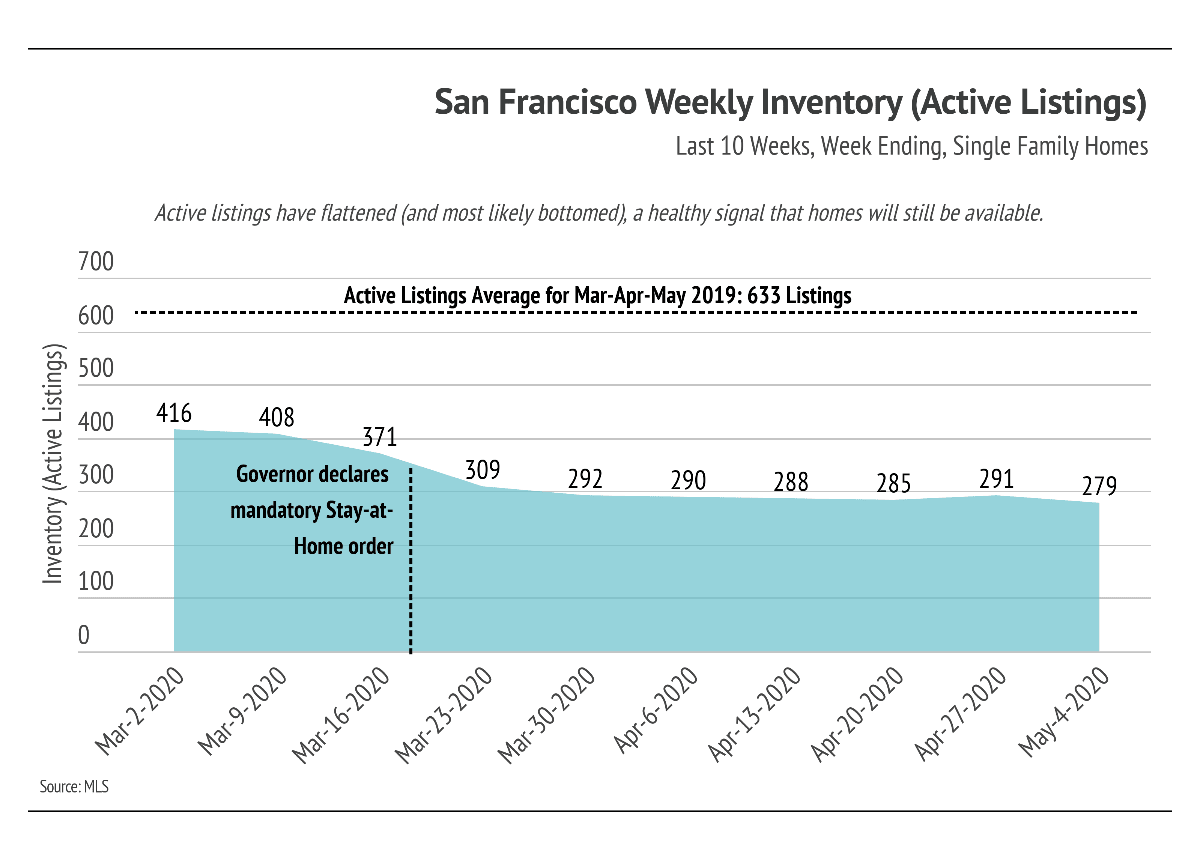
While the pandemic’s impact on the housing market progressed rapidly in March, the April housing market data illustrates a stable market, albeit at a new normal. The graph below illustrates the available housing inventory by week rather than by month (as is typical) to illustrate how the market has changed over a shorter timeline. We can see that supply levels declined in March, but have since flattened. A significant number of sellers continue to remain in the market, and this so-called floor might indicate that active listings have fallen as far as they will go.
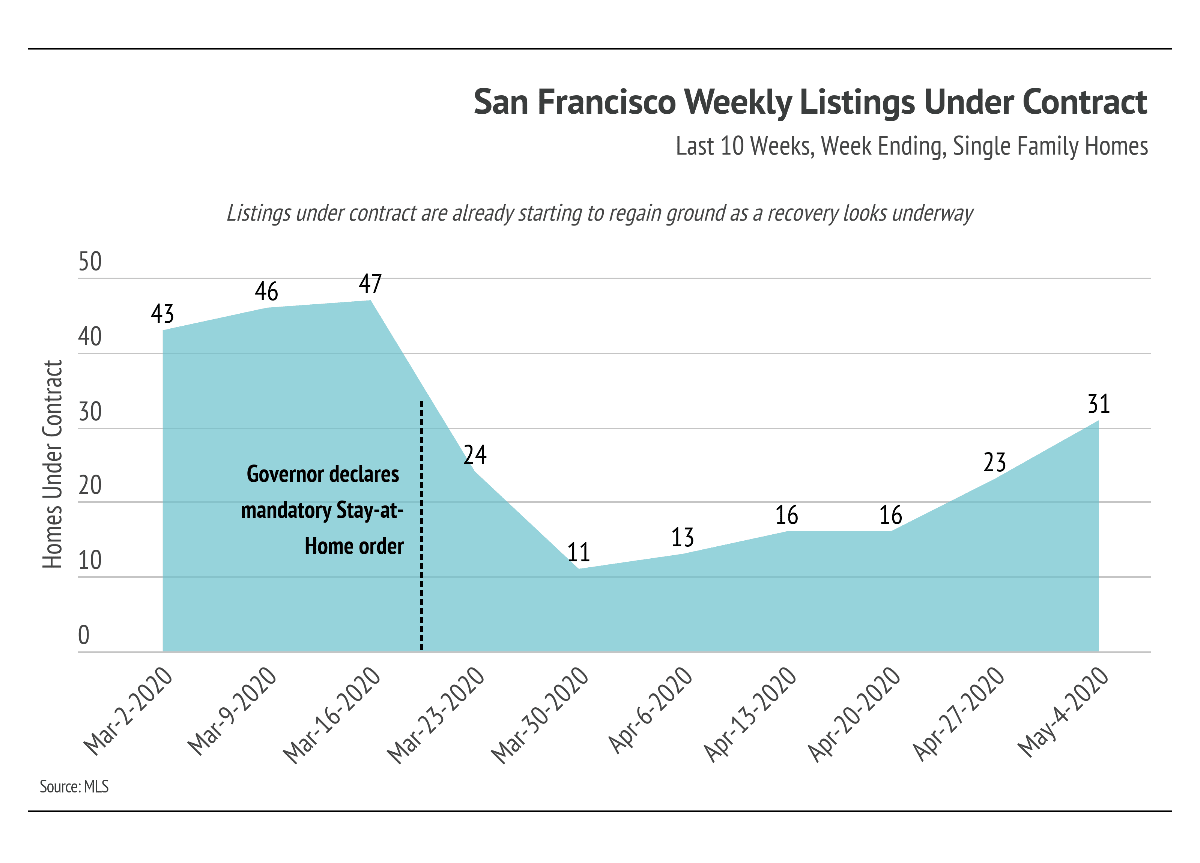
We talked about this earlier, but another sign that the housing market may be beginning to turn around is the number of listings under contract. During the week of March 30th, listings under contract hit a low with only 11 single-family homes under contract. Since then, listings under contract are almost three times that amount (31), indicating that people are forging ahead, aided by technology.
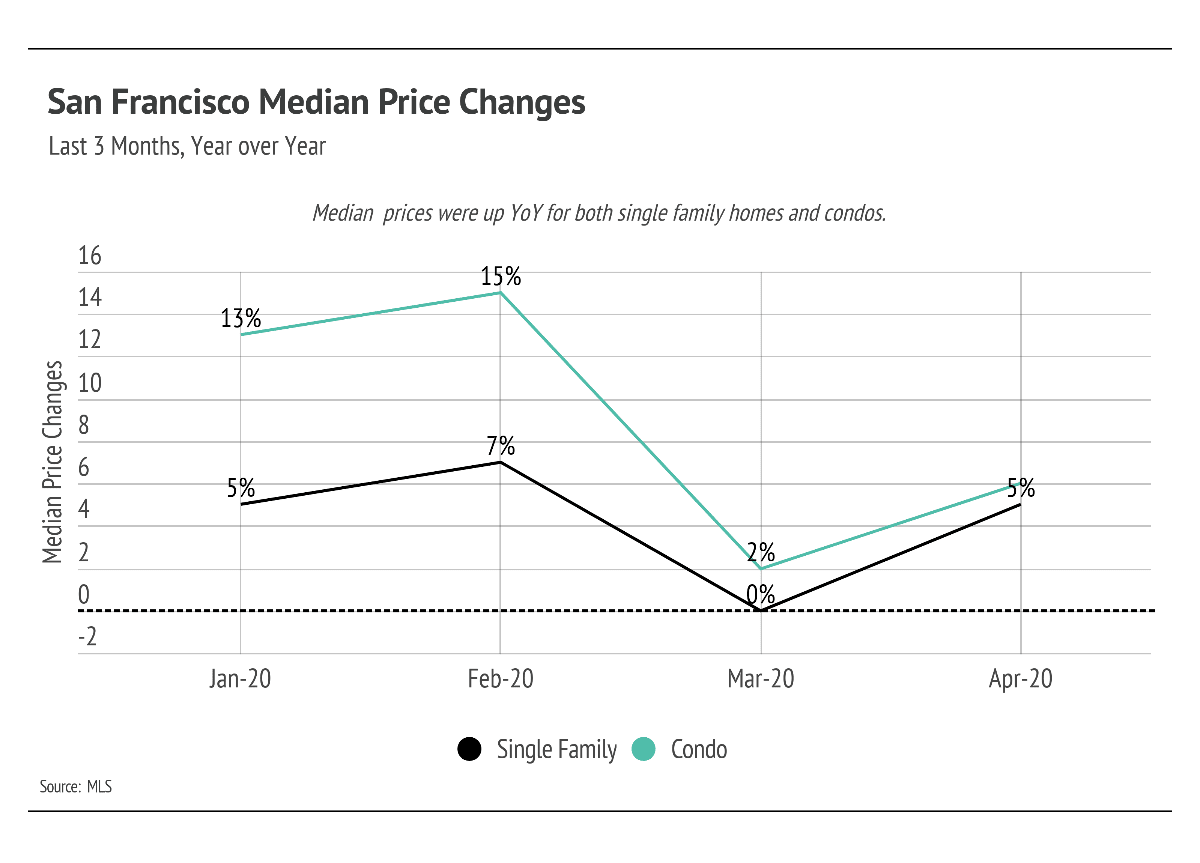
San Francisco’s median prices rose in April for both single-family homes and condos. Although the pandemic and stay-at-home orders dampened buyer demand, the number of active listings also decreased, which buoyed prices.
Compared yearly, prices were up for both single-family homes and condos as well. Appreciating prices typically signal a healthy demand for the available housing and encourage sellers to price their homes slightly above comparables.
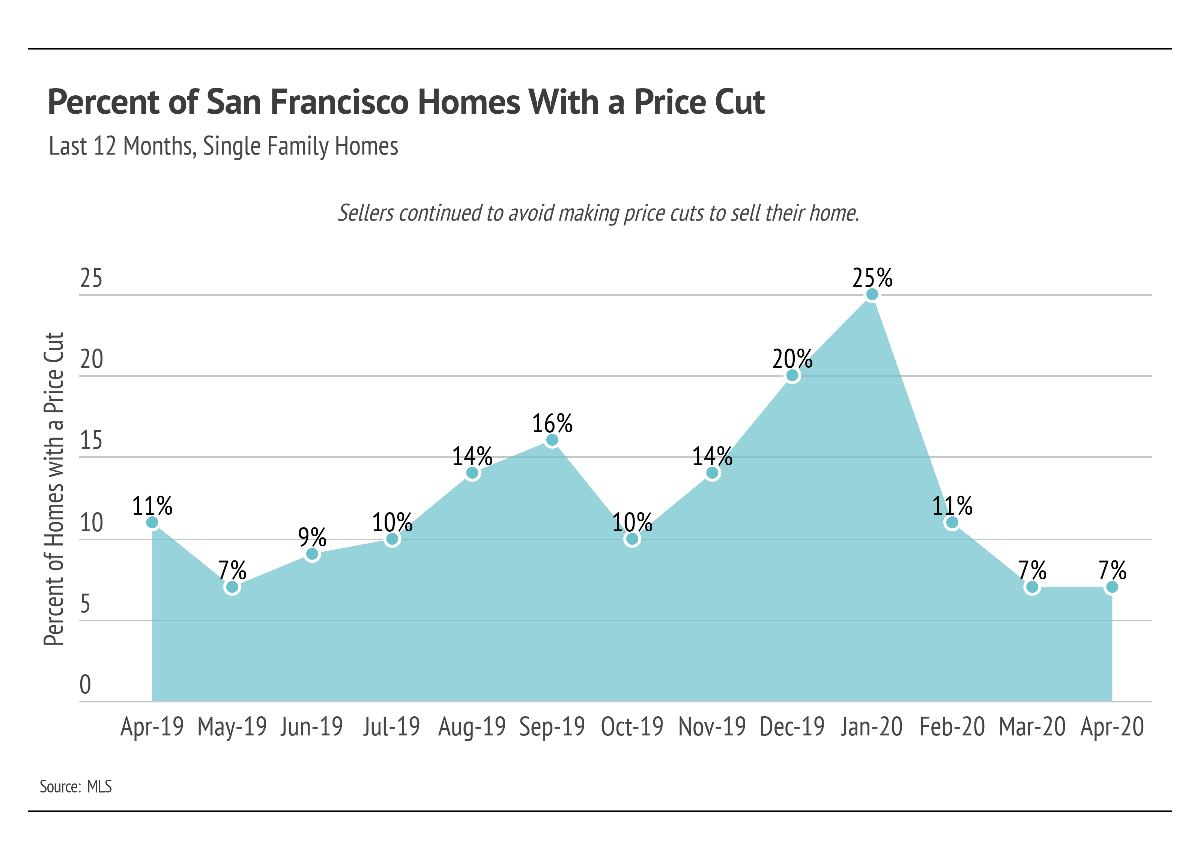
Along with a rise in median home prices, the percentage of homes that sold with price cuts remained at the lowest level in the past ten months. Only 7% of sellers had to reduce their prices in April. Rising price data will only encourage sellers to keep their listings priced where they are and wait for more buyers to come back into the market.
The sale-to-list ratio reflects the change in the original list price of a home and the final sale price. For example, a ratio of 100% means that a home sold for the price at which it was most recently listed. In San Francisco, single-family homes almost always have higher sale-to-list ratios than condos. In April however, single-family home sellers accepted offers at a discount for the first time in over a year. This indicates that sellers are finally making price concessions, albeit small ones, and that buyers have a bit more negotiating power. Meanwhile, sale-to-list ratios rose for condos; buyers paid a 4% premium. It’s important to note that the sample size for April sales is over 50% smaller than usual, making this month’s metrics outliers rather than the start of a new trend. We will, of course, continue to track this metric in order to guide your decision making.
Months supply of inventory measures how many months it would take for all current listings on the market (including listings under contract) to sell at the current rate of sales. In April, the supply of single-family homes decreased but not nearly as much as the sales volume, which caused the large year-over-year jump in months supply of inventory. Months supply was 2.5 and 4.4 for single-family homes and condos, respectively, in April.
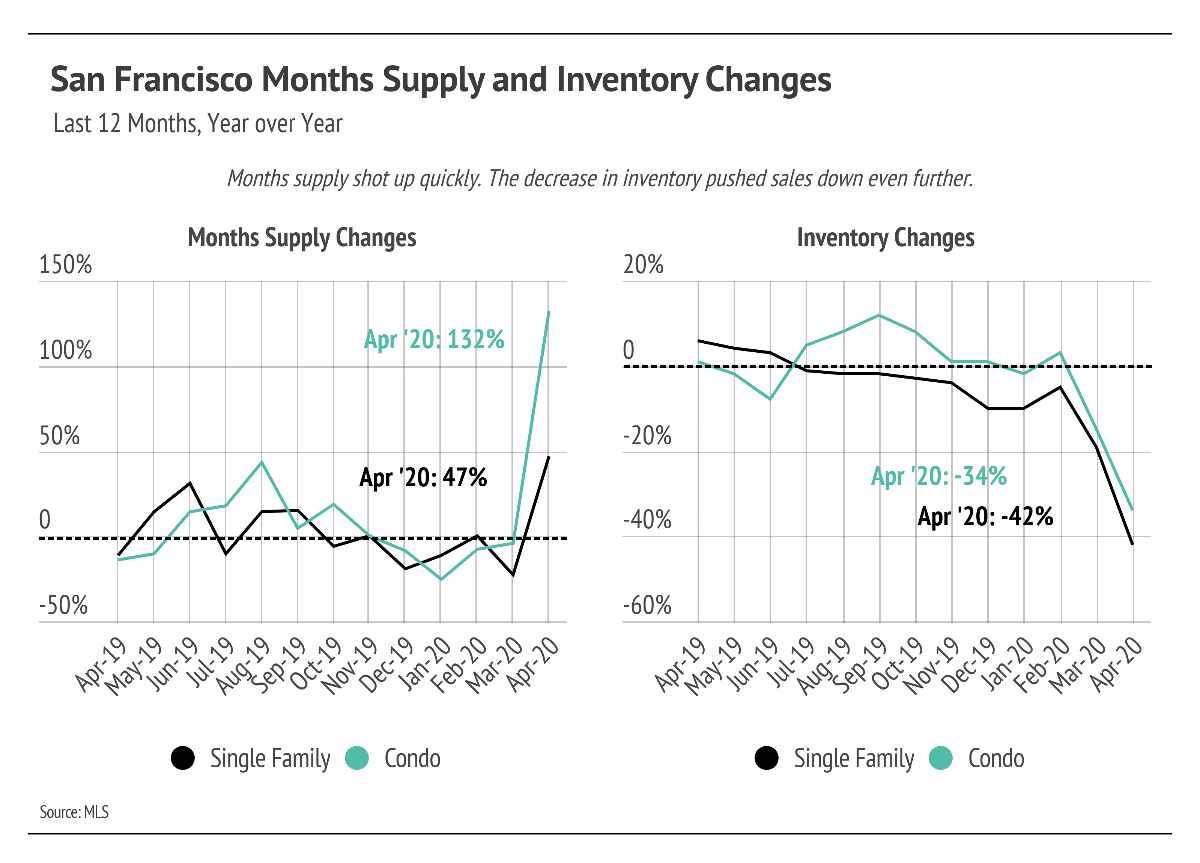
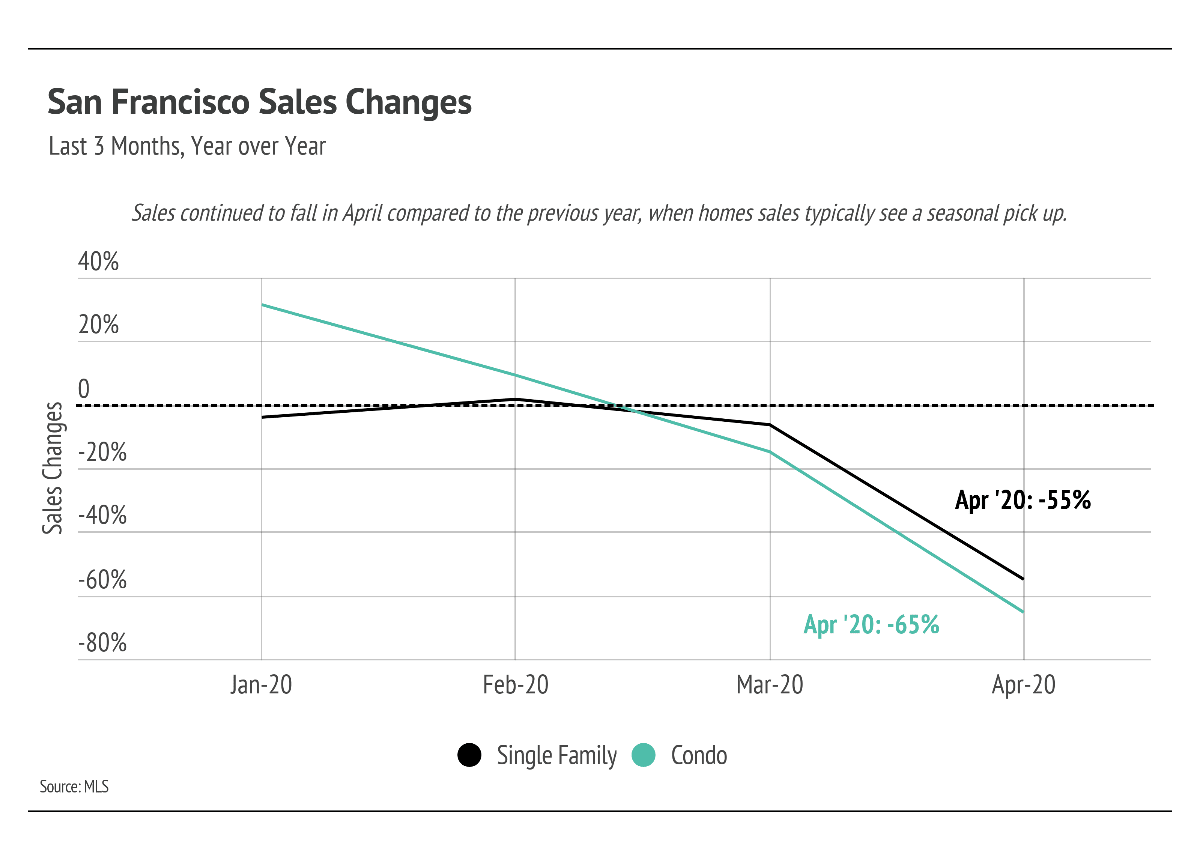
Inventory and volume of homes sold saw a significant decrease in March and April. The year-over-year changes are particularly pronounced as sales and inventory typically have a seasonal increase in March and April, coming out of the slower Winter season.
Looking ahead to June, we anticipate more growth. We expect buyer demand to pick back up as fears of a steep price decline lessen. Look for more agents to leverage the latest technology to give buyers the ability to tour homes in compliance with state and local laws.
As always, we remain committed to helping our clients achieve their current or future real estate goals. Our team of experienced professionals would be happy to discuss the information we’ve shared in this newsletter. We welcome you to contact us with any questions about the current market or to request an evaluation of your home or condo.
Stay up to date on the latest real estate trends.

March 10, 2026
A Hidden Opportunity for Homebuyers in the San Francisco Housing Market

March 6, 2026
Explore Bayview Businesses and Amenities (Map)

March 2, 2026
Pacifica, CA Real Estate Market Update Update February 2026

February 27, 2026
Securely shredding real estate paperwork protects San Francisco homeowners from identity theft and deed fraud
You’ve got questions and we can’t wait to answer them.