Leave a Message

Thank you for your message. We will be in touch with you shortly.

San Francisco & National Housing Market Update | May 2025

May 19, 2025

San Francisco & National Housing Market Update | May 2025

San Francisco & National Housing Market Update | May 2025

CLICK TO JUMP TO SAN FRANCISCO DATA

The Big Story | National Data

Quick Take:
  • Median purchase price continues to tick up, increasing by 2.75% on a year-over-year basis nationwide.
  • The average 30-year mortgage rate continues to slowly fall, reaching 6.63% in the month of March.
  • The number of sales has declined slightly, while inventory skyrocketed on a year-over-year basis.

Note: You can find the charts & graphs for the Big Story at the end of the following section.
*National Association of REALTORS® data is released two months behind, so we estimate the most recent month's data when possible and appropriate.

Inventories levels explode while existing home sales decline slightly

Although we’re still at the point in the season where inventories are supposed to build, they have increased by nearly 20% on a year-over-year basis, from 1,110,000 to 1,330,000, showing that people are hesitant to purchase a new home. Additionally, while inventories have been increasing, the number of existing homes being sold has decreased slightly on a year-over-year basis, with March 2025 numbers coming in at 4,020,000, which is 2.43% lower than where they were last year. Across the country, people are becoming more uncertain of whether or not they should move to a new home, and that is very clearly showing!
 
This data is just for March though; it will be important to pay attention to how the market reacted to the beginning of the trade war when April’s numbers come out in a couple of weeks. While it’s easy to see how things like the stock market and bond market react to big newsworthy events like this, real estate is incredibly illiquid, so it takes some time for things to play out!
 
As you might have expected, there was a considerable increase in the number of listings that have hit the market too. For a few months in a row we have seen high single/low double-digit percentage growths in the number of new listings hitting the market in the US. This is likely due to the fact that the people who were holding out for the return of lower interest rates are losing hope, and listing their homes anyway.
 
On the bright side, mortgage rates have continued their slow descent, with the average interest rate on a 30-year mortgage in March coming in at around 6.63%, down roughly a quarter point from the year prior. As you might expect, the median monthly P&I payment ticked down slightly, and the median sale price ticked up slightly to match this move.
 
Although mortgage rates have come down a bit, it’s important to remember that the biggest drivers behind mortgage rates are, of course, the 10-year treasury and the federal funds rate. In the most recent Federal Open Market Committee meeting, the Fed has decided to keep the federal funds rate in line with where it’s been over the past few months, despite many Americans feeling the effects of the trade war on their wallets.
 
As we have discussed in prior months, the Fed is in no rush to lower interest rates anytime soon. However, they do see a not-so-distant future where rates are a good bit lower. When you combine this with the fact that inventories are building at a rapid rate, and the number of units being sold has fallen slightly, this could represent a fantastic buying opportunity!
 
Ultimately though, this is just what we’re seeing at a national level. As we all know, real estate is an incredibly localized industry, so knowing what’s going on in your own market is pivotal. Below is our local lowdown, that outlines everything you need to know about what’s happening around you in your neighborhood and surrounding areas!
 

Big Story Data


The San Francisco Local Lowdown

Quick Take:
  • The sale price of the median condo has begun to uptick on a year-over-year basis, after several negative months.
  • Inventory continues to be an issue for San Francisco, as the number of both single-family home and condo listings dips.
  • There still aren’t any discounts to be found as the average listing continues to sell for over the original asking price!

Note: You can find the charts/graphs for the Local Lowdown at the end of this section.

Condo prices are starting to tick back up!

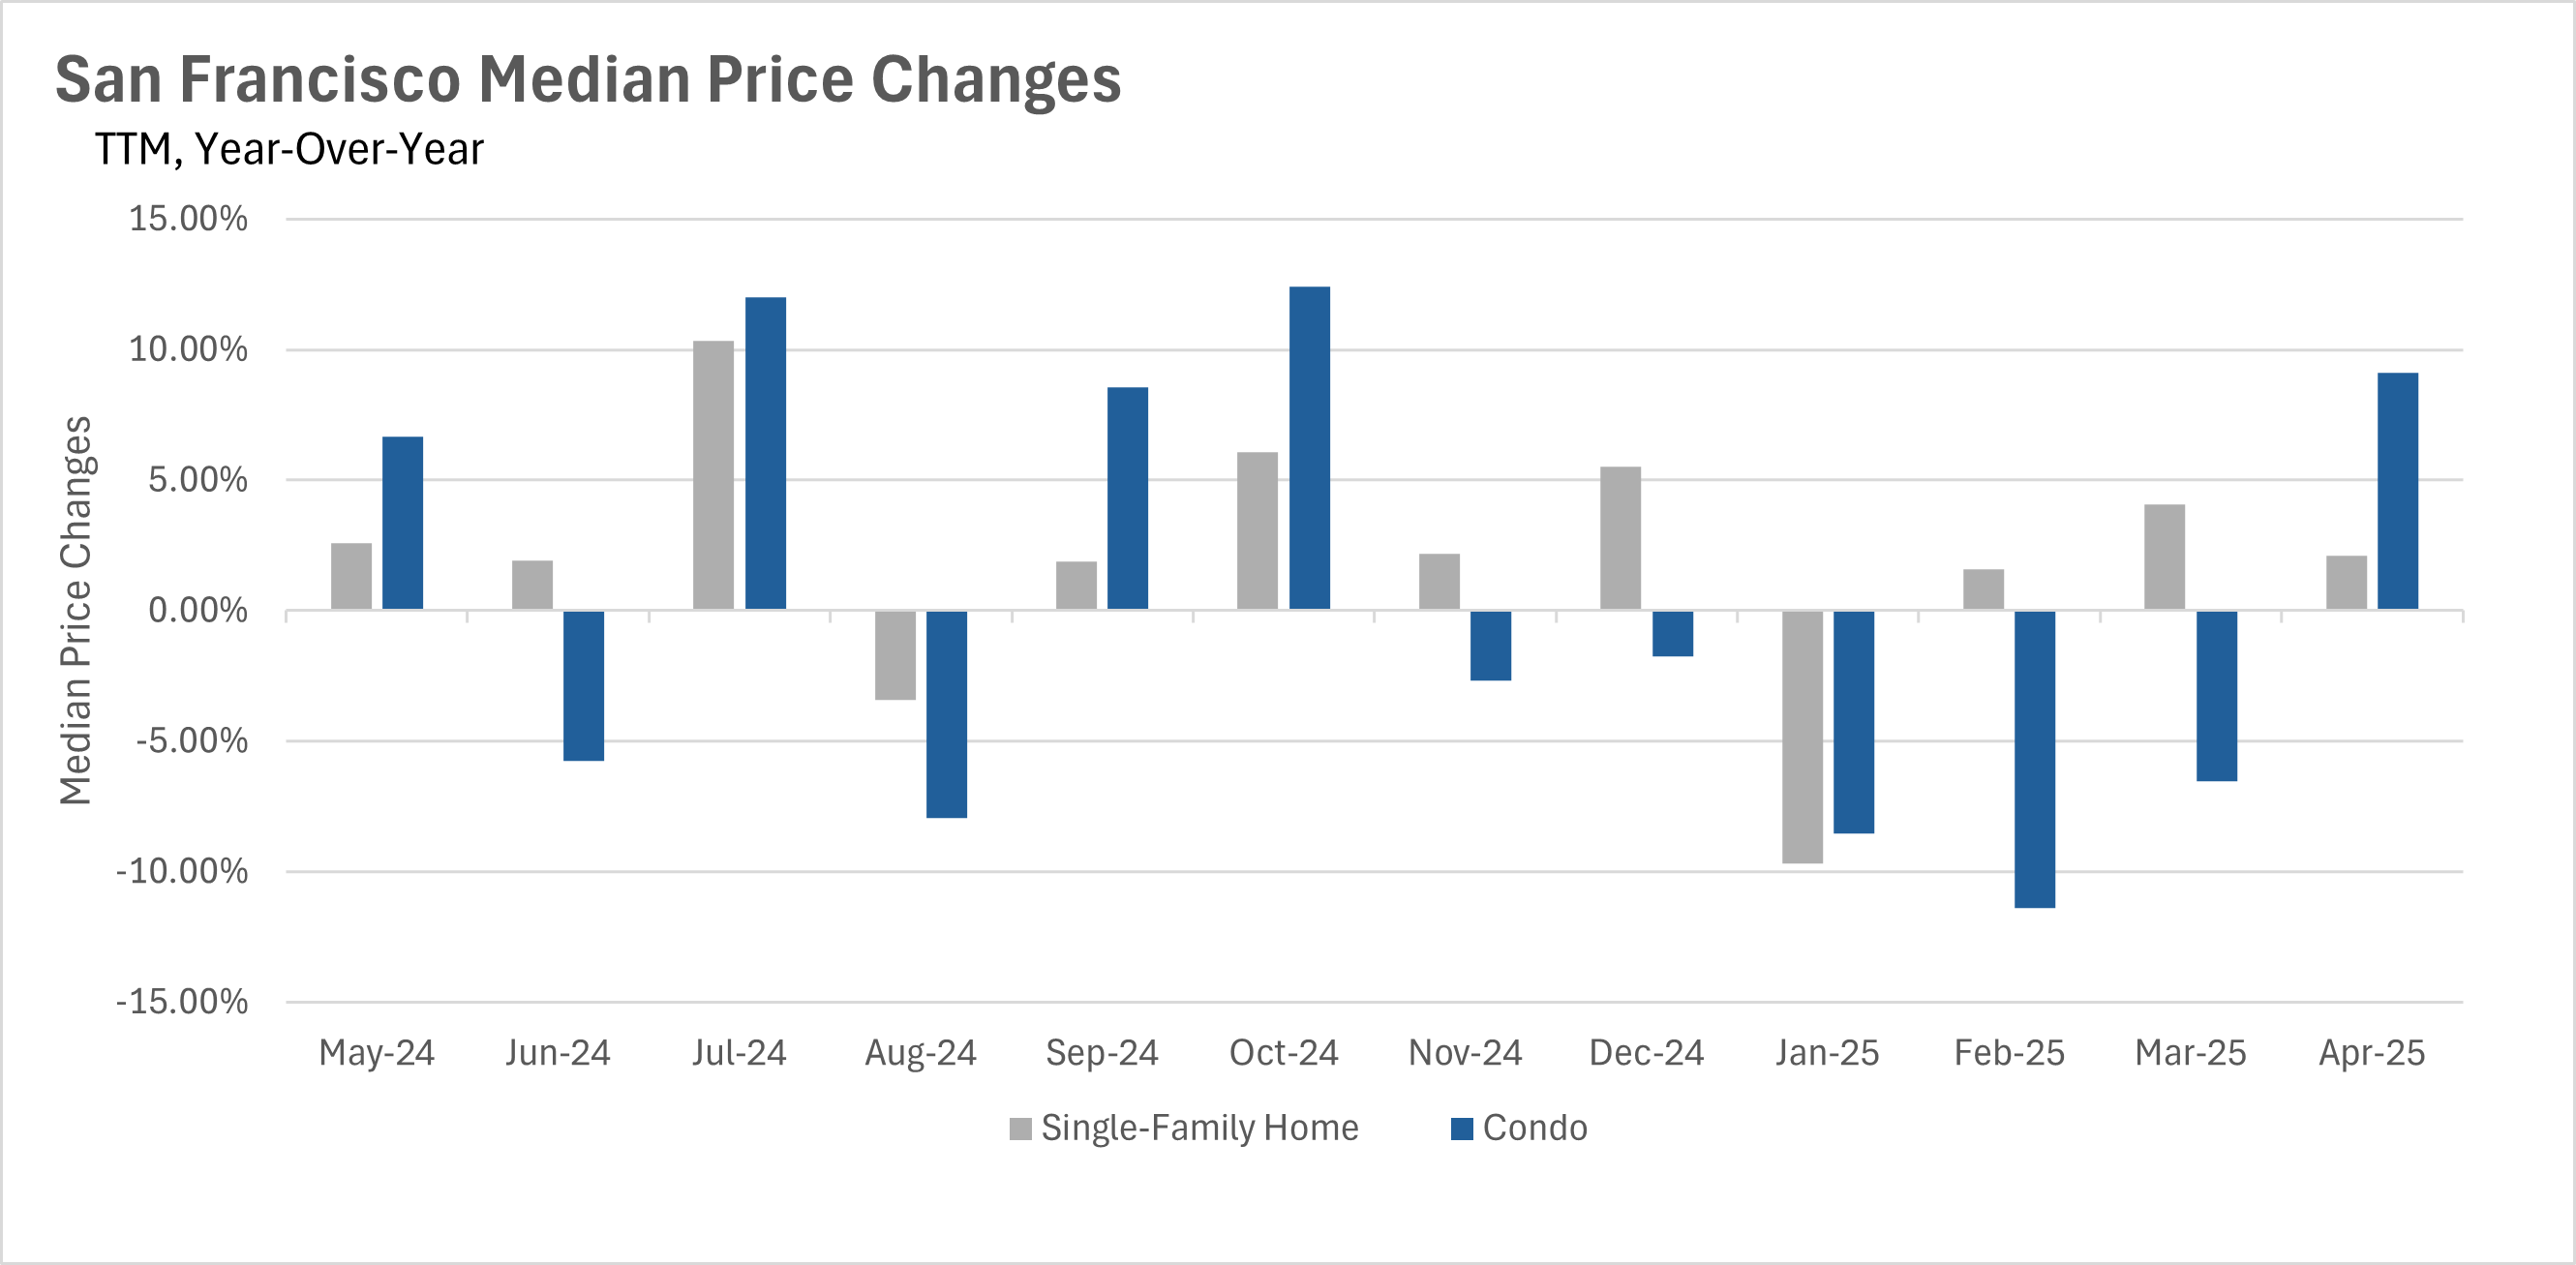
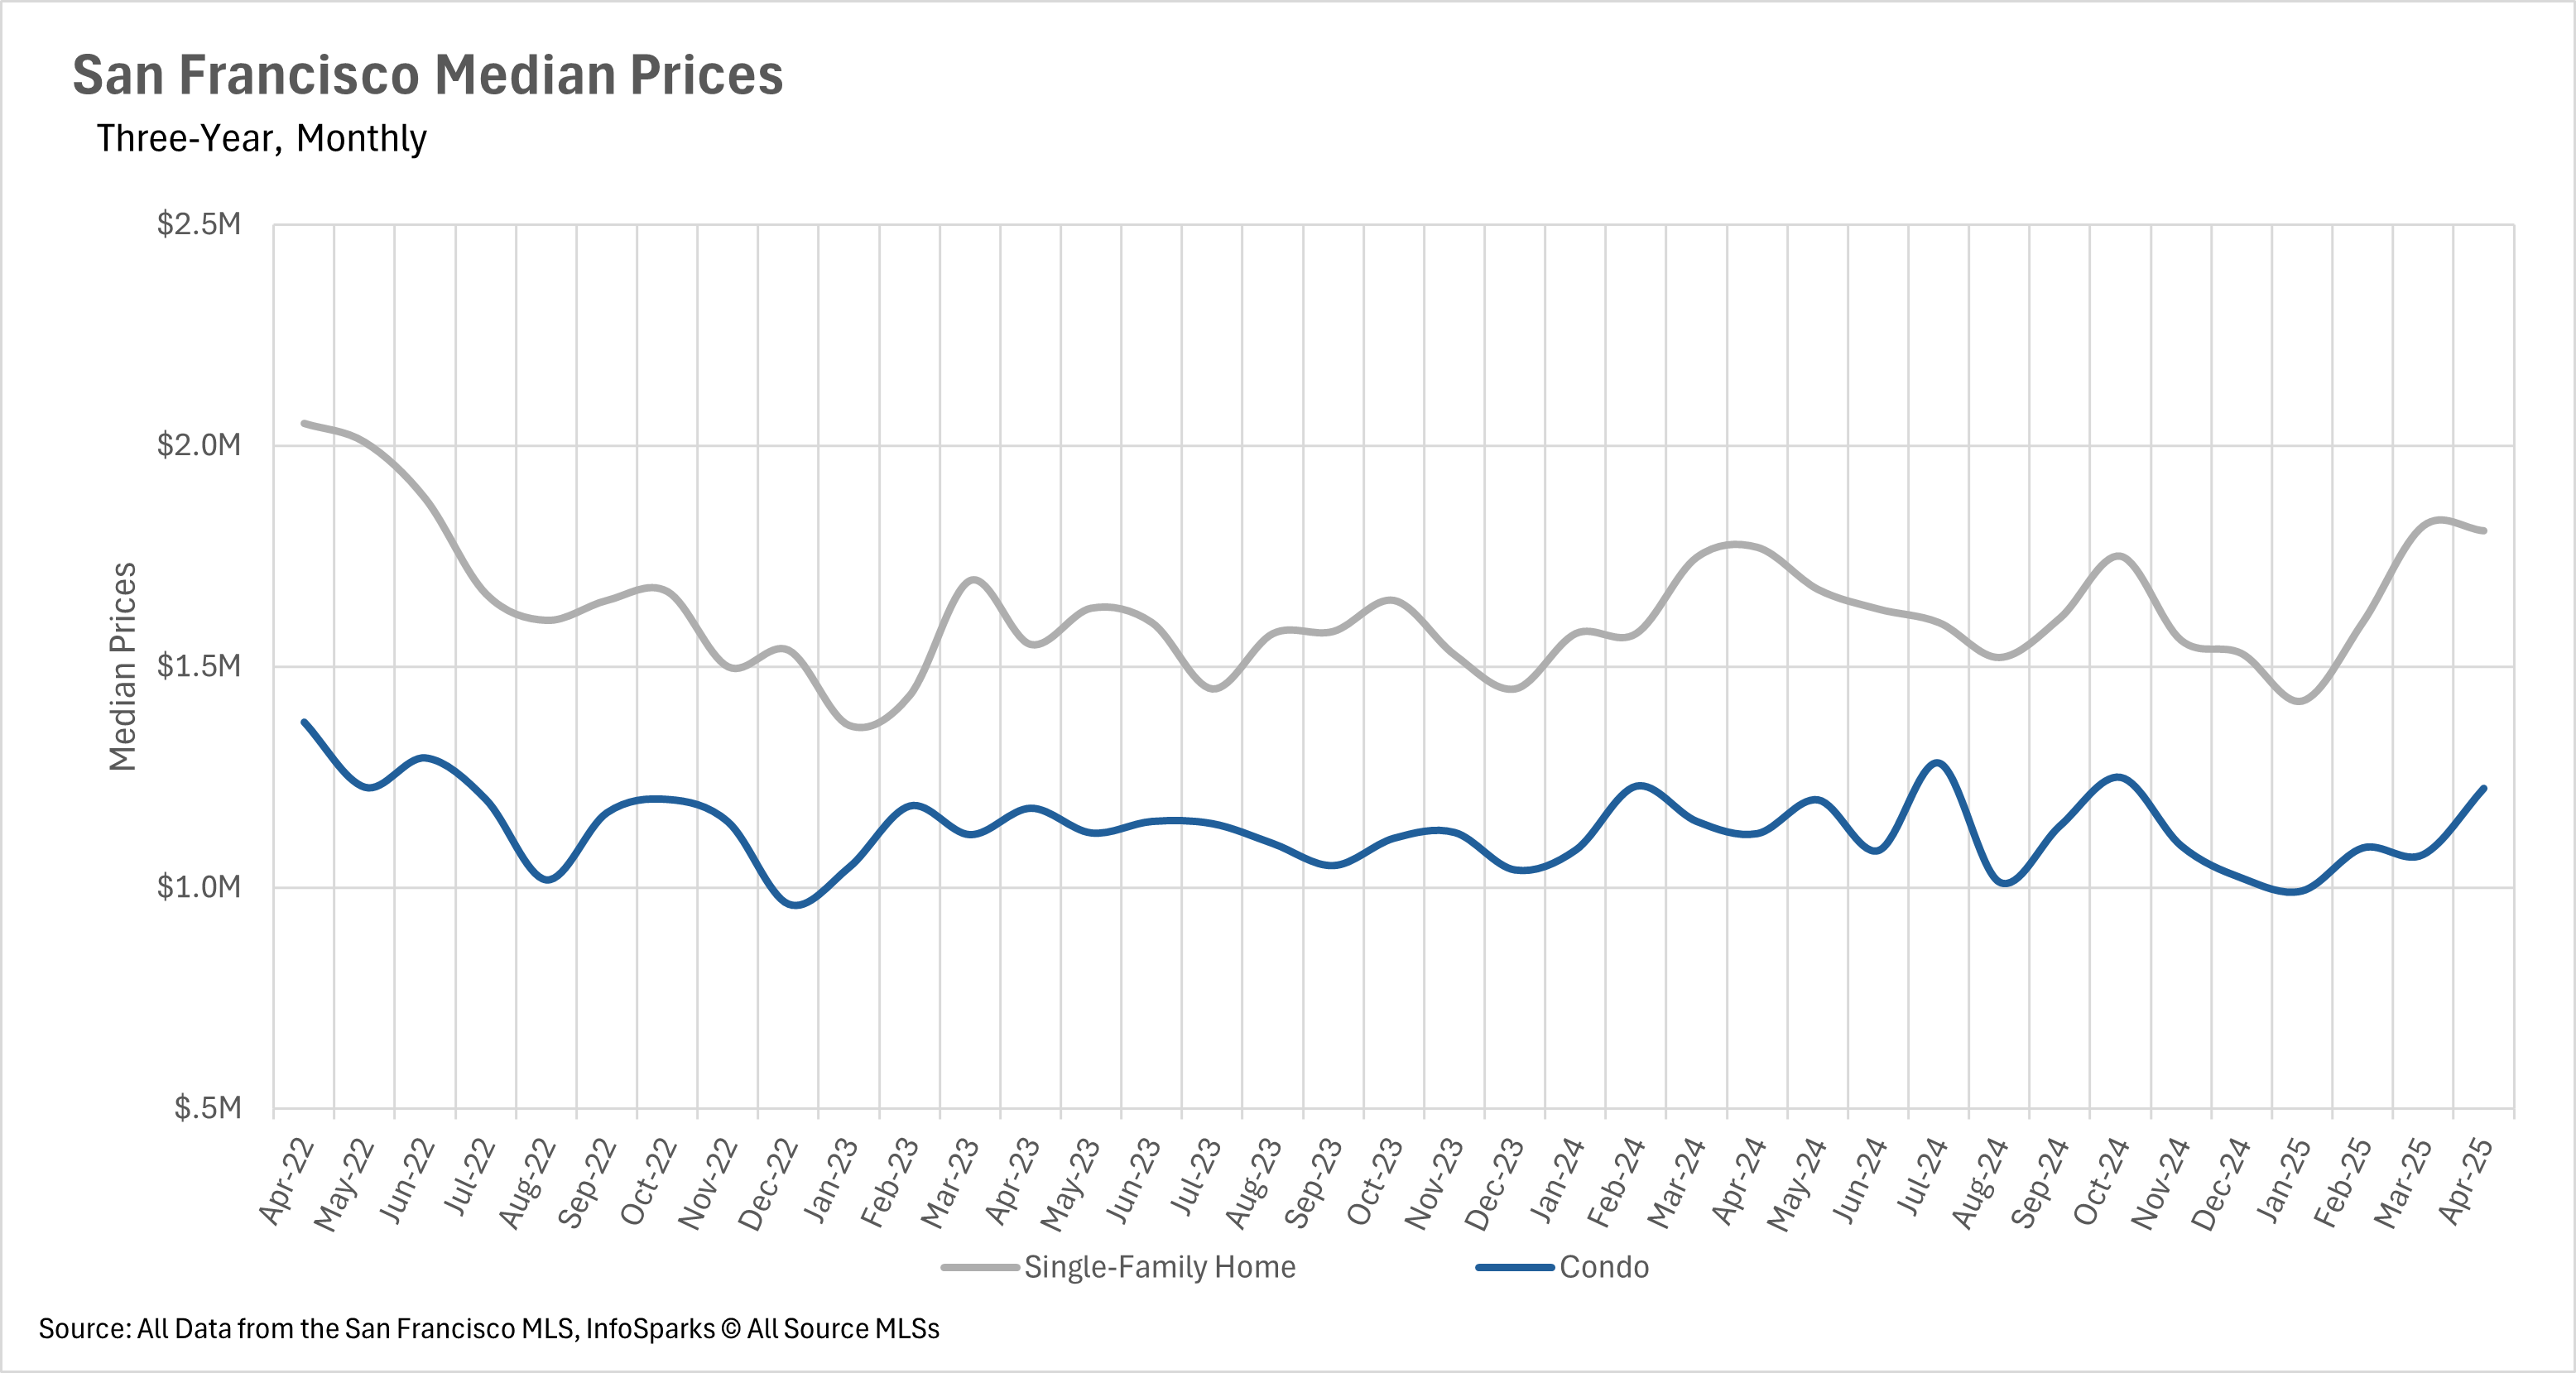
For five months in a row, condo prices were declining on a year-over-year basis, but in the month of April, we actually saw some very strong growth in terms of condo median sale price! Condos in San Francisco are currently selling for around 9.13% more than this time last year. This could mark the turning point for the condo market in San Francisco! On the flip side, sale price growth for single-family homes remains steady, increasing by 2.12% in the month of April.

The inventory issue in San Francisco remains incredibly persistent

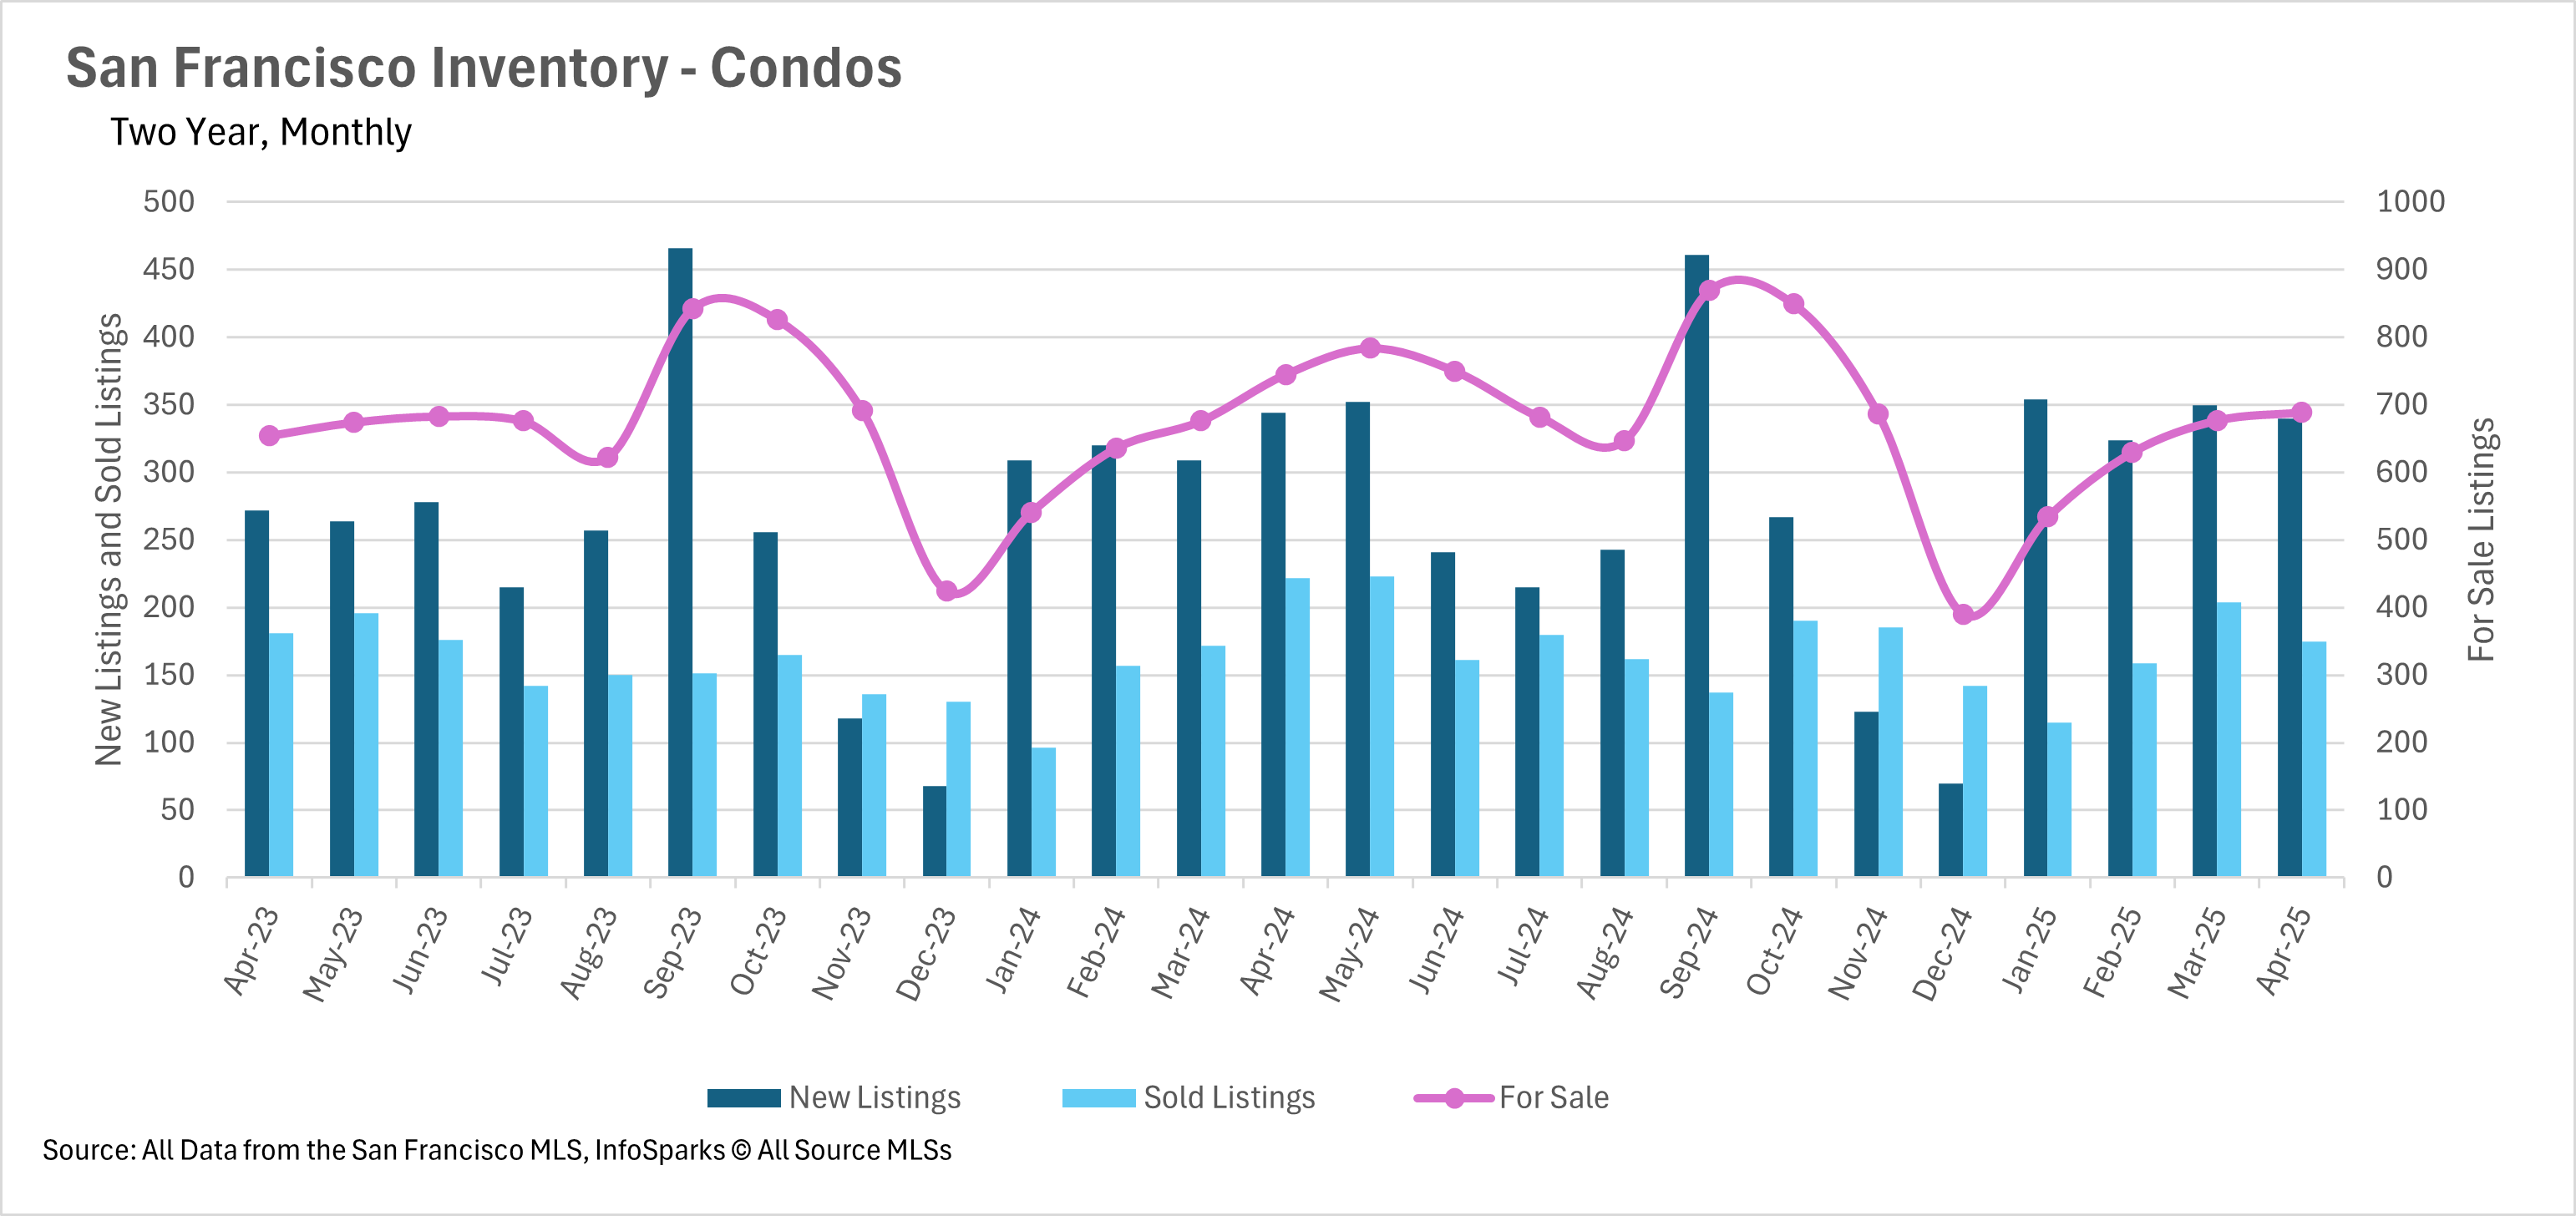
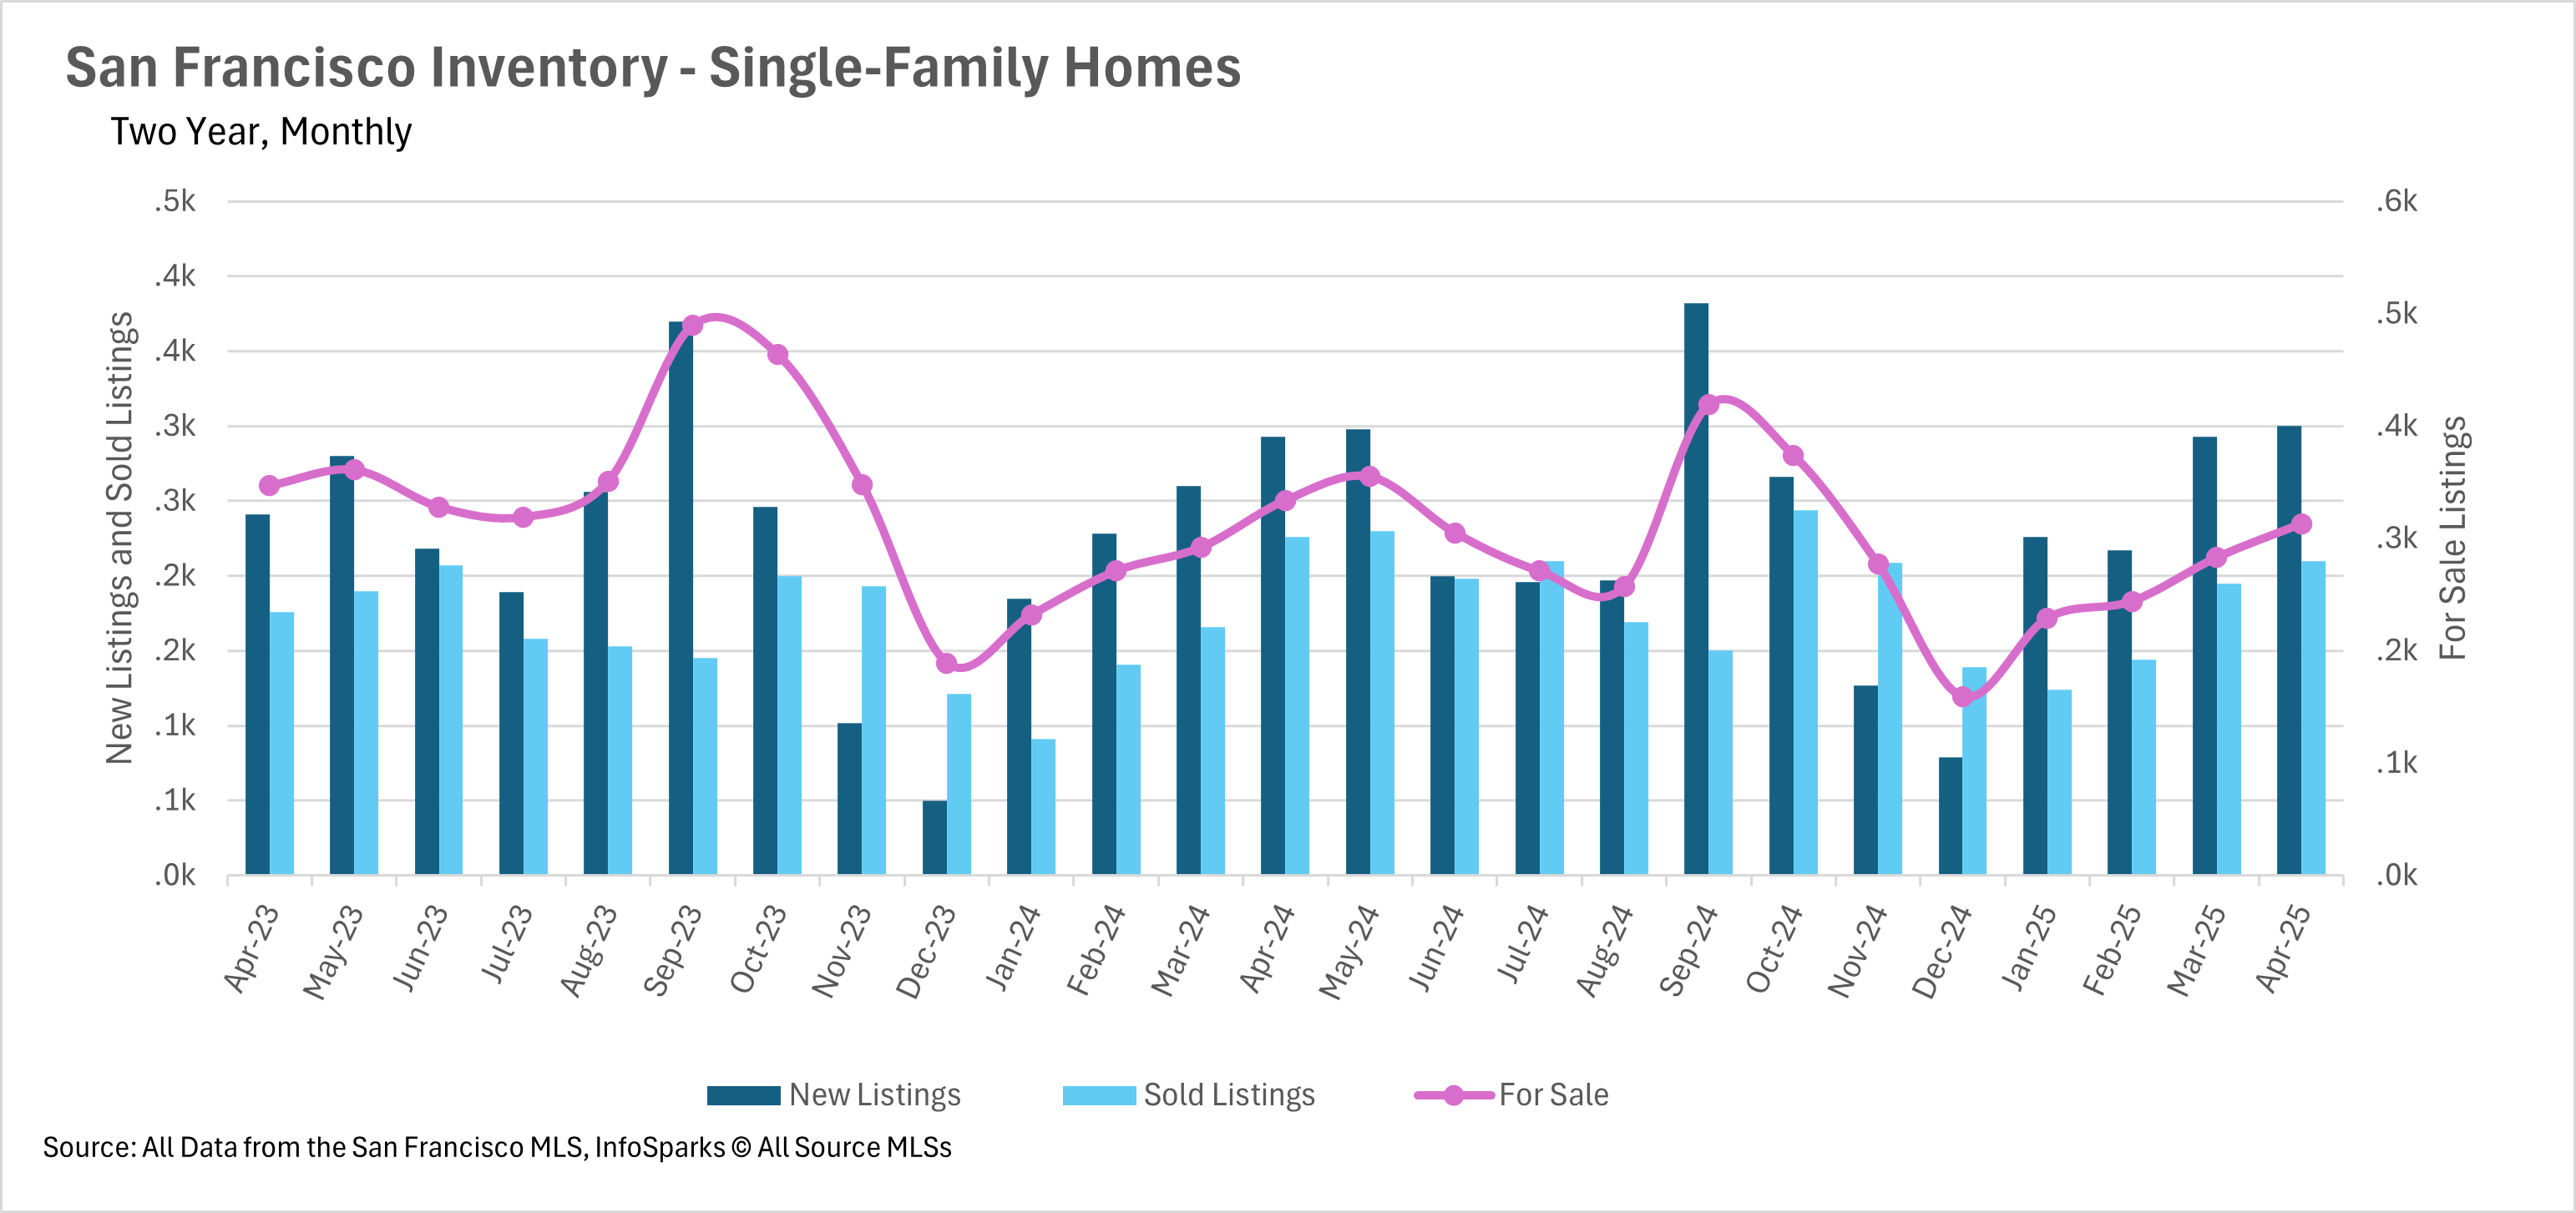
As we all know by this point, inventories have been declining in San Francisco for years now. Unfortunately, nothing has changed in the month of April, as the number of single-family homes on the market decreased by 6.29% on a year-over-year basis, and the number of condo listings on the market decreased by 7.52%. Notably, in the condo market, there was a 21.17% decrease in the number of sales on a year-over-year basis, which is one of the most substantial decreases we’ve seen in quite some time!

The average home is still selling for over the original listing price

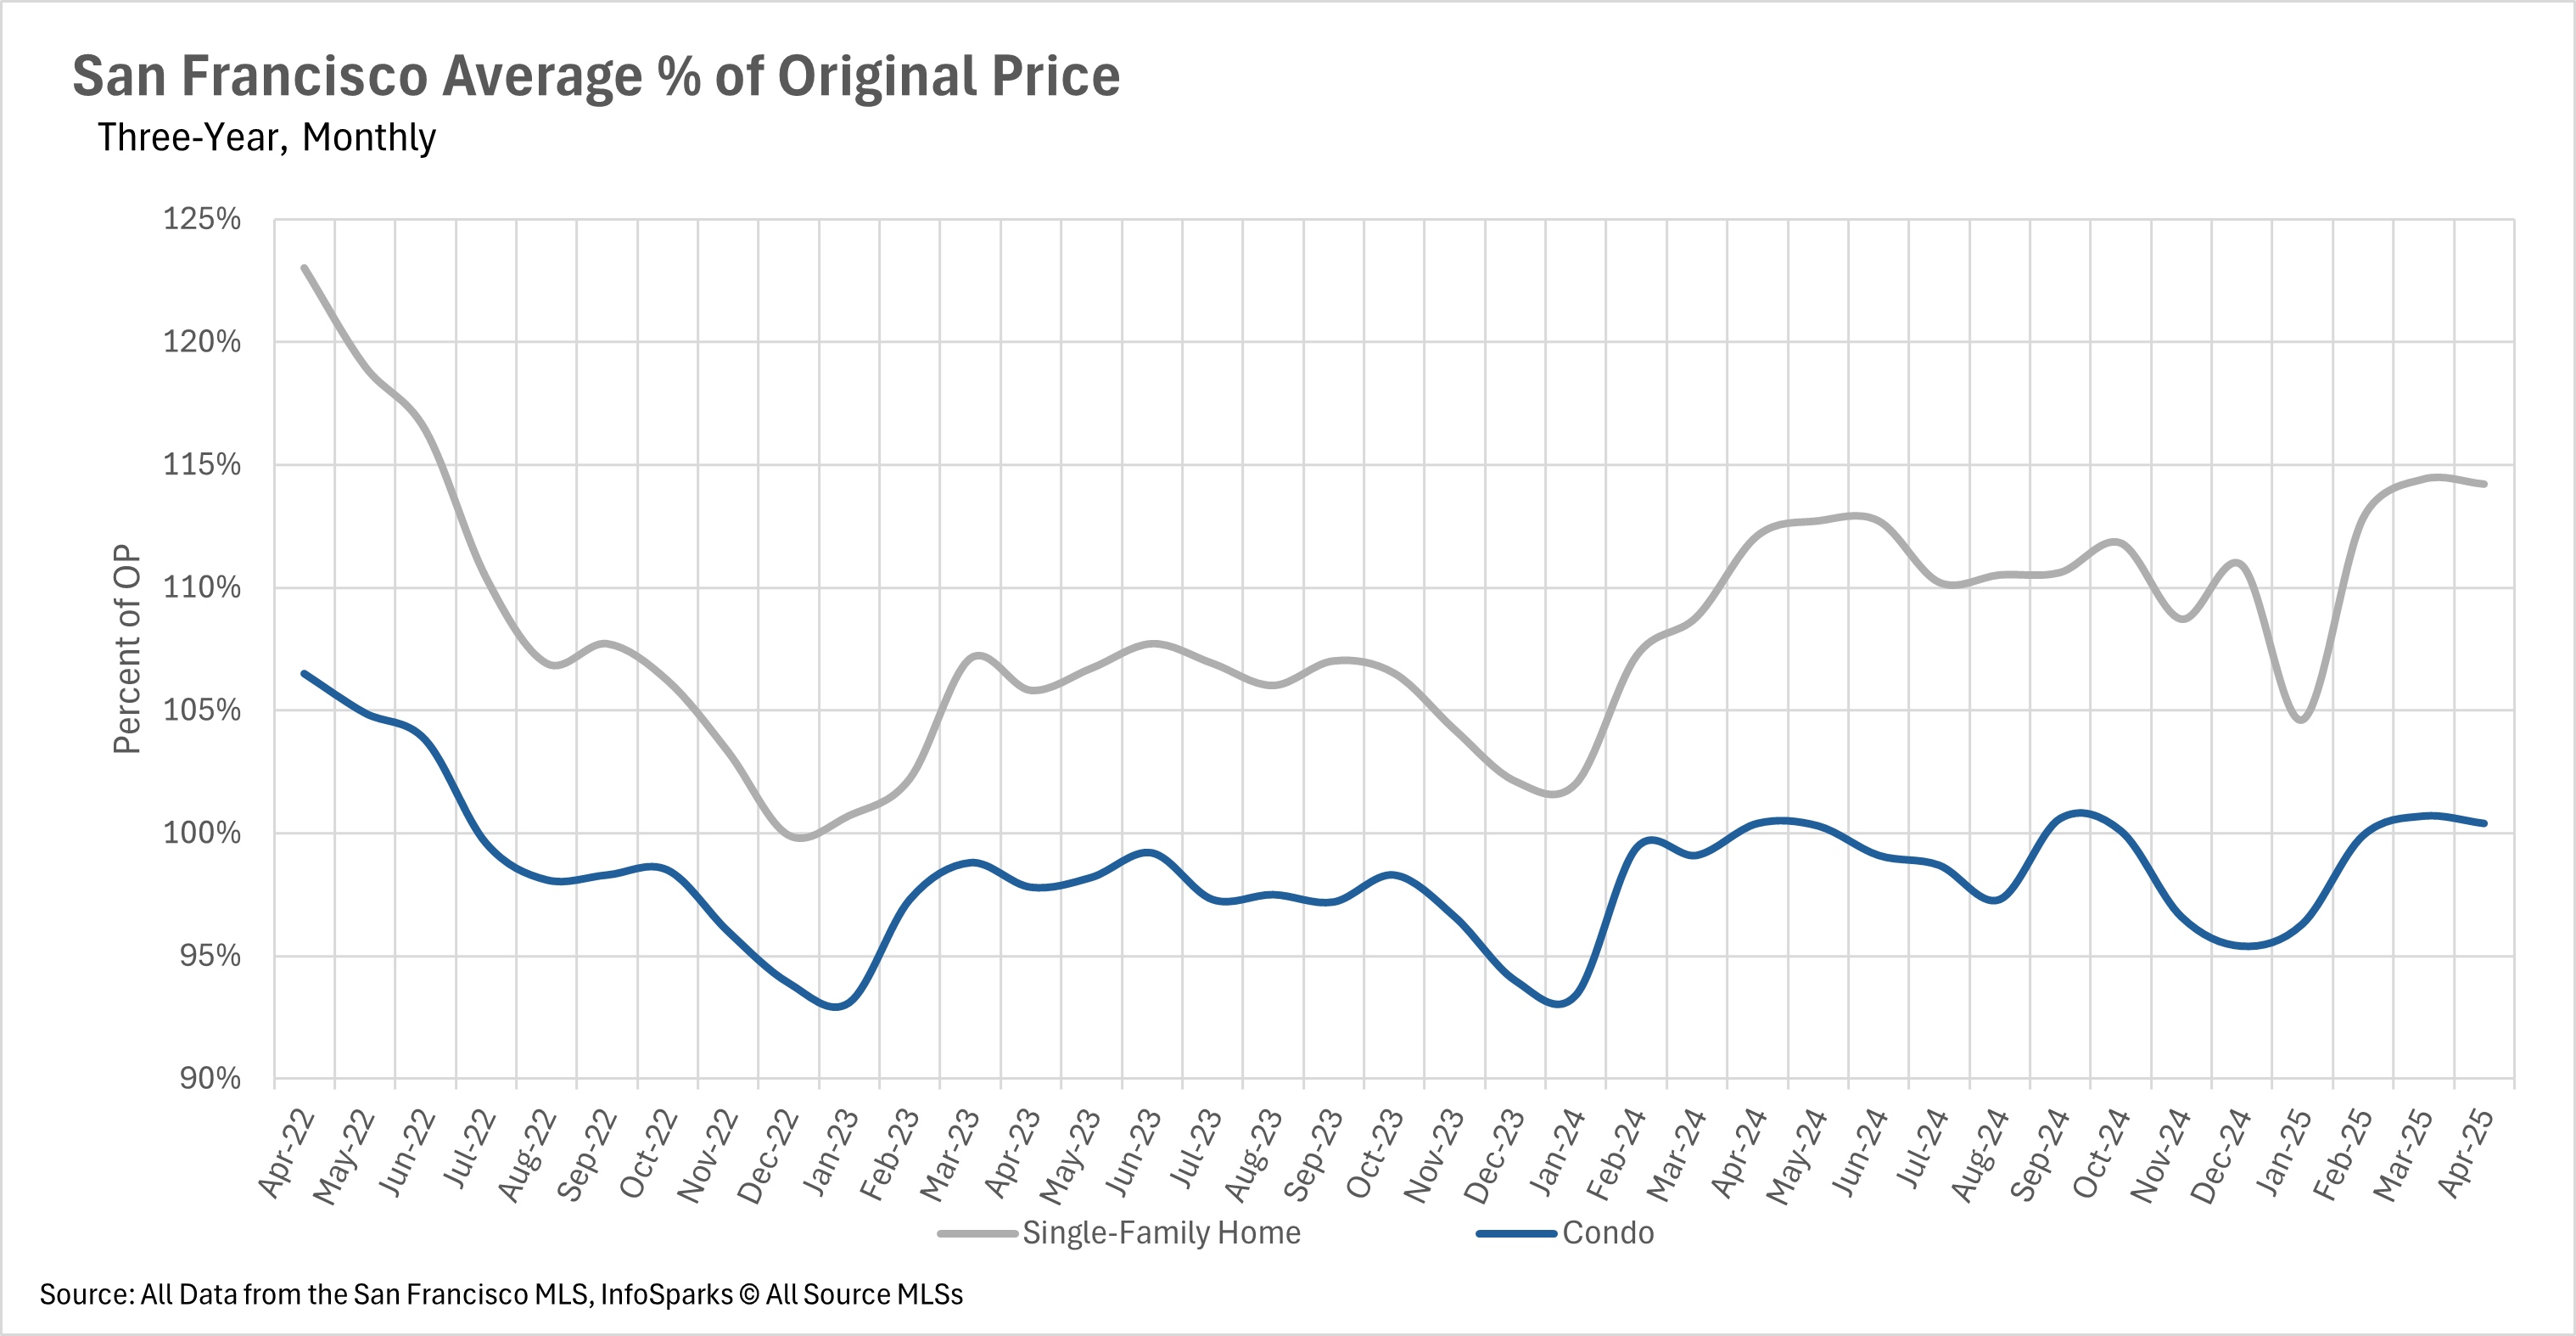
Unfortunately, if you’re looking to score a listing for below the asking price, you’re going to have to look very hard, as single-family homes are selling for 14.2% more than their original asking price on average. Fortunately, the condo market isn’t nearly as competitive, as the average listing sells for just 0.4% more than the original listing price.

Buyers vs. Sellers Markets

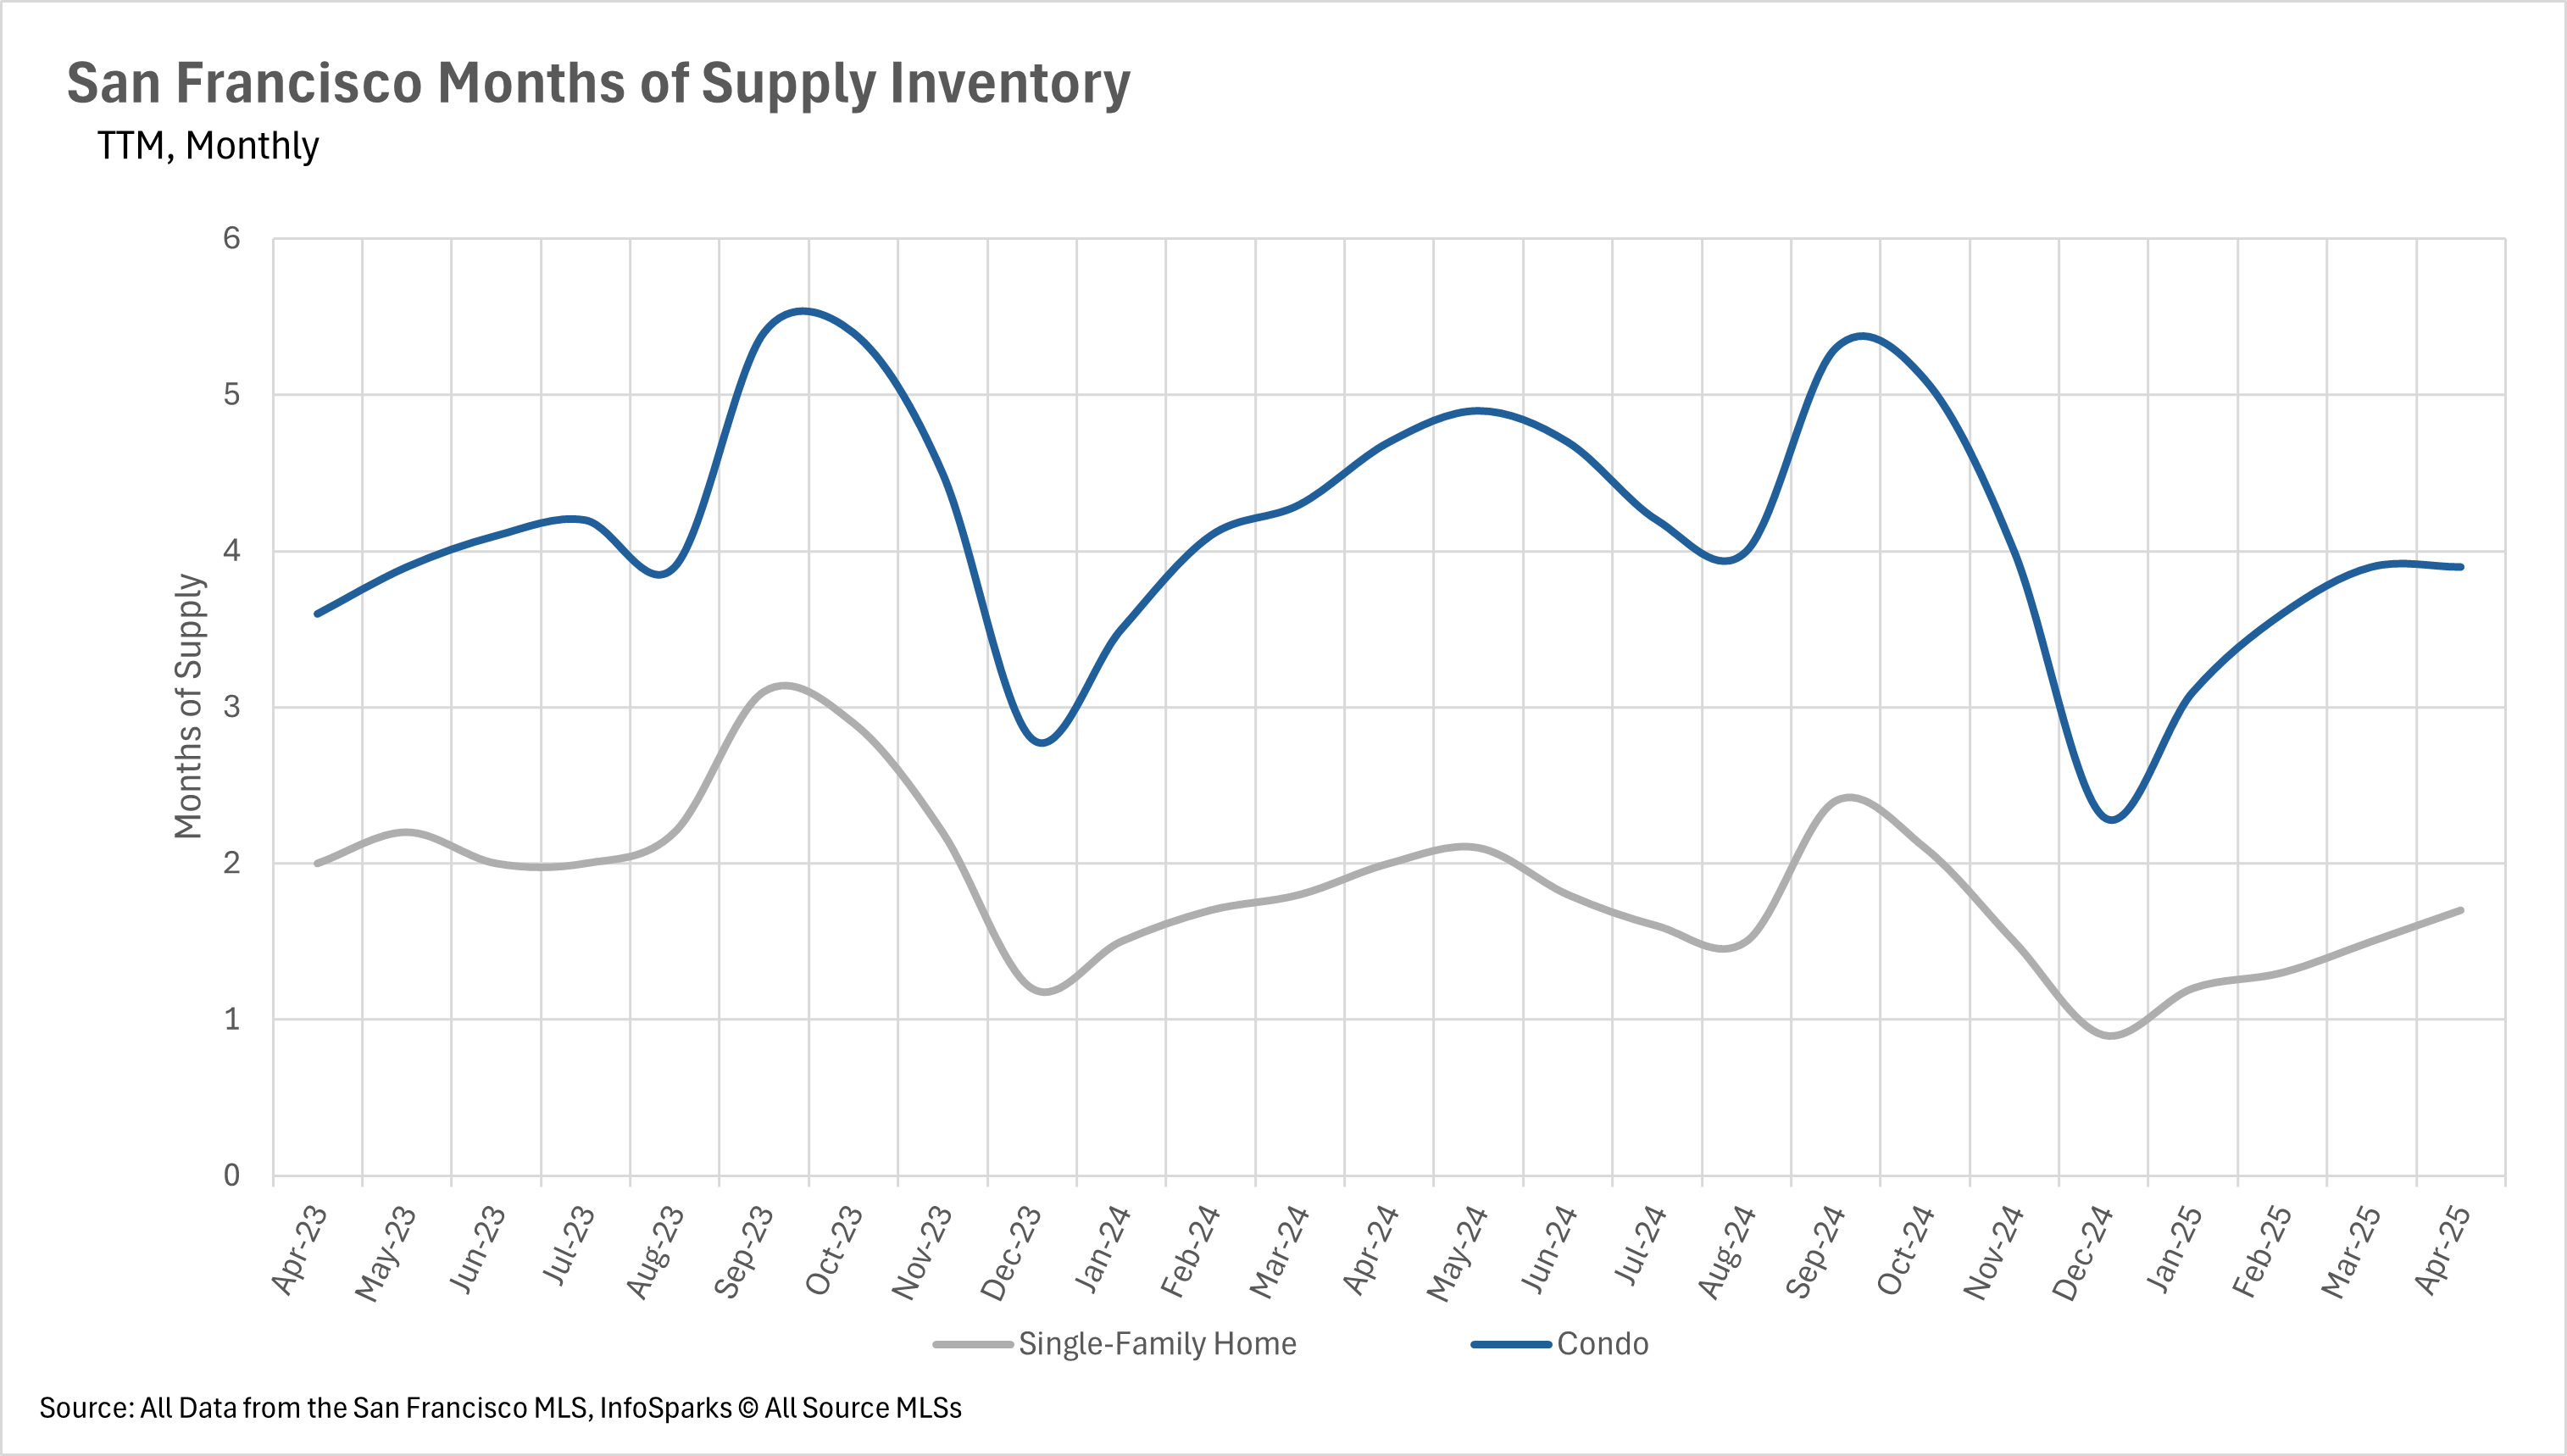
When determining whether a market is a buyers’ market or a sellers’ market, we look to the Months of Supply Inventory (MSI) metric. The state of California has historically averaged around three months of MSI, so any area with at or around three months of MSI is considered a balanced market. Any market that has lower than three months of MSI is considered a sellers’ market, whereas markets with more than three months of MSI are considered buyers’ markets.

With inventories being such a huge issue, you might think that both the single-family home and condo markets are both seller's markets. However, that’s not the case in San Francisco. The single-family home market remains a seller's market, with just 1.7 months' worth of supply on the market at this point in time. However, the condo market is a buyer’s market, as there are roughly 3.9 months' worth of supply ready to buy on the market right now!

Local Lowdown Data


Let's Talk

You’ve got questions and we can’t wait to answer them.