The Local Lowdown
- The San Francisco housing market remains one of the strongest in the country despite some price declines over the summer months.
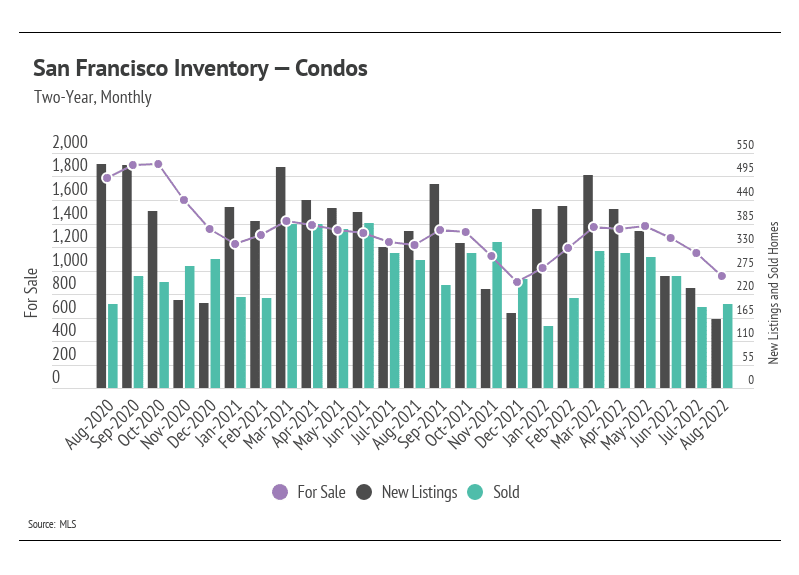
- Sales rose in August as new listings declined, dropping inventory further from the May peak.
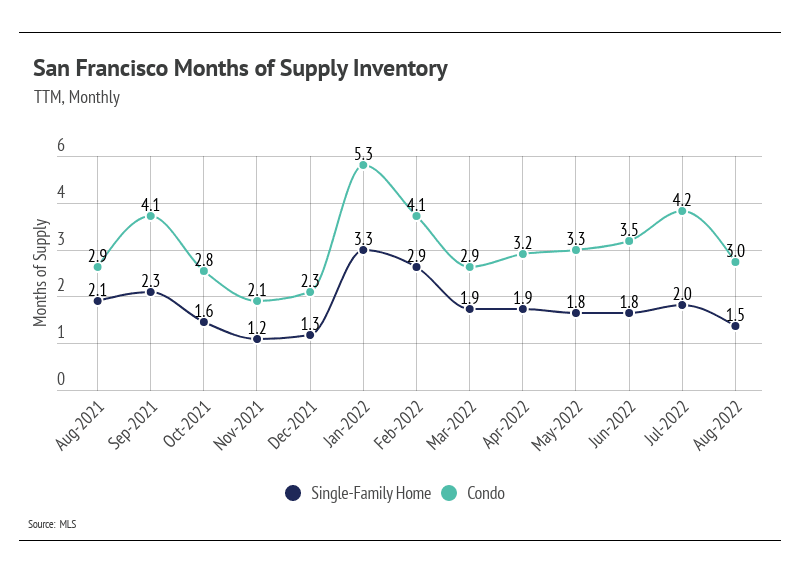
- Months of Supply Inventory fell, indicating that the single-family home market still favors sellers, while the condo market is more balanced.
Note: You can find the charts/graphs for the Local Lowdown at the end of this section.
What about price growth?!
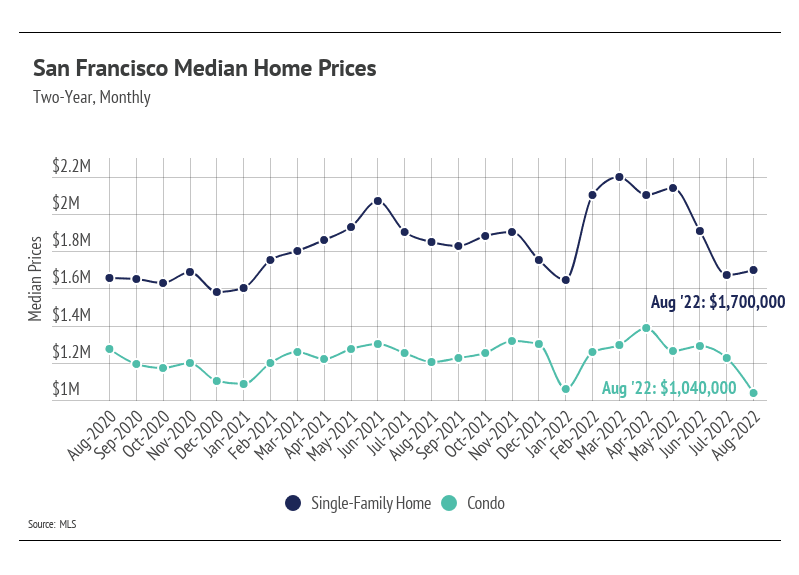
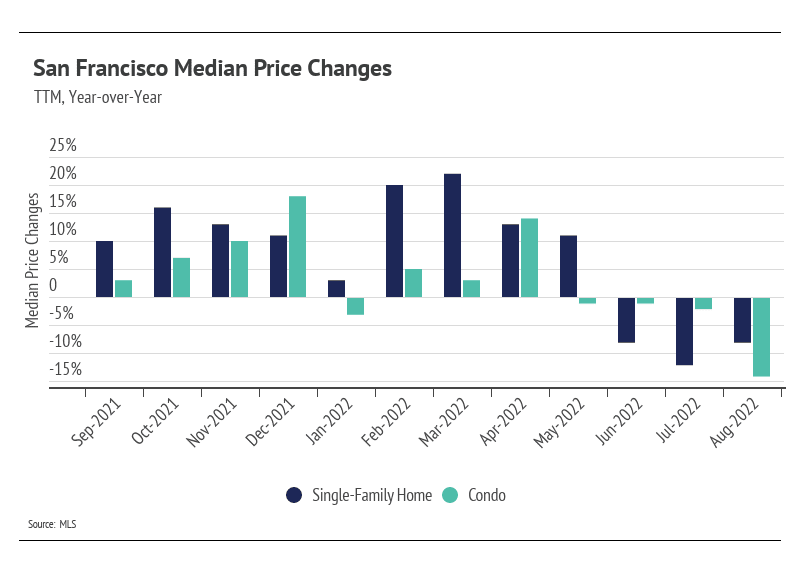
Prices tend to stagnate or decline this time of year, which is exactly the case in San Francisco. The median single-family home price rose slightly month-over-month after huge price drops in June and July, and condo prices declined, continuing the downward trend from the April peak. Since their peaks earlier this year, prices have contracted by 23% for single-family homes and 25% for condos. The price movements aren’t unexpected, as we are returning to more normal seasonal trends of price growth in the first half of the year and contraction in the second half. This is, of course, exacerbated by rising mortgage rates. Although the current average 30-year mortgage rate of 5.66% is still historically low, the hyper-low rates we experienced in 2020 and 2021 allowed many more buyers to enter the market. We saw firsthand what happens when demand booms in an already undersupplied market: Home prices skyrocketed. When we link the price increases and seasonal trends with the 2.5% increase in 30-year mortgage rates, which increase the monthly mortgage payment by about 35%, we get a better picture of why sales have slowed and prices declined.
Sales increased in August, but remain low
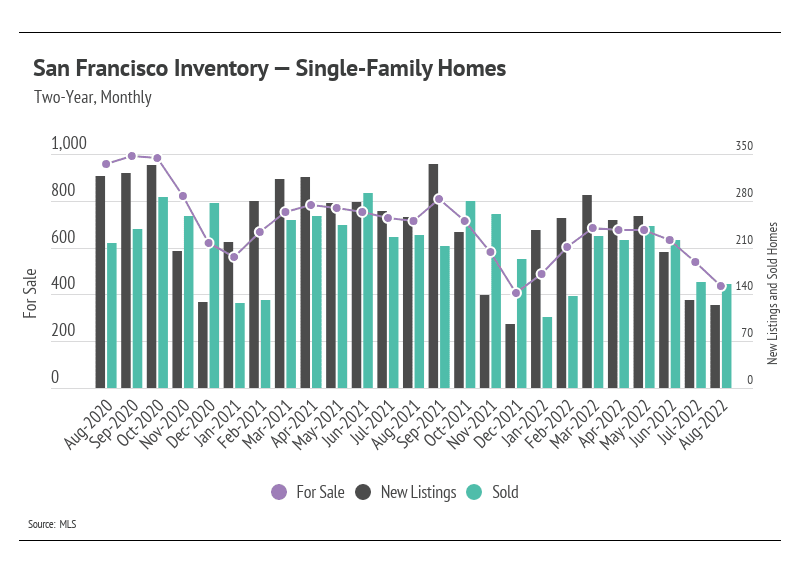
Single-family home and condo sales increased month-over-month, while new listings declined, dropping inventory further. The number of homes for sale has trended lower over the past three years and settled at lower levels, which is likely the new normal for housing inventory in the country. Generally, smaller supply equates to fewer sales. For example, if 500 homes sold last year, but there are only 300 homes for sale on the market this year, it’s awfully difficult to hit more than 300 sales. There were 44% fewer homes on the market in August 2022 than in August 2020. With the drop in inventory in August, the peak inventory level for 2022 will undoubtedly be one of the lowest on record.
Additionally, the huge number of sales in 2021 implies a sales slowdown in the future, and the future is now. On average, people move about 12 times in their lifetime in the United States, meaning if a million more people than average buy a home one year, there’s a decent chance about a million fewer people will buy a home the next. Homes are generally not something people continuously buy year after year.
Months of Supply Inventory declined, implying a sellers’ market
Months of Supply Inventory (MSI) quantifies the supply/demand relationship by measuring how many months it would take for all current homes listed on the market to sell at the current rate of sales. The long-term average MSI is around three months in California, which indicates a balanced market. An MSI lower than three indicates that there are more buyers than sellers on the market (meaning it’s a sellers’ market), while a higher MSI indicates there are more sellers than buyers (meaning it’s a buyers’ market). Single-family home MSI has stayed generally low over the last 12 months, indicating a sellers’ market. However, condo MSI dropped to three months, implying a more balanced market.
Local Lowdown Data
Top SF realtors Jennifer Burden & Carren Shagley are here to answer any of real estate questions.
We are A Powerful Force On Your Side!