Leave a Message

Thank you for your message. We will be in touch with you shortly.

The Big Story: Median home price hits record high for the second month

July 24, 2024

The Big Story: Median home price hits record high for the second month

The Big Story: Median home price hits record high for the second month

Quick Take:

  • Since January 2024, prices have climbed 13.6%, reaching an all-time high in May and another in June 2024. Similarly, the monthly cost of financing has hit a record high, meaning that home affordability is at a record low.
  • In June, the average 30-year mortgage rate declined to 6.86%, dropping 0.17% from the 2024 high reached in April. The Fed may cut rates as early as September, but the magnitude of the cut will be small, likely 0.25% this year. Currently, we expect rates to remain between 6% and 8% for the rest of 2024.
  • Sales fell 0.7% month over month, while inventory rose 6.7%. The combination of rising prices and high interest rates has kept sales historically low. Since January 2023, sales have trended more horizontally, although we expect sales to decline until spring 2025.
Note: You can find the charts & graphs for the Big Story at the end of the following section.


Surprisingly unsurprising: high rates, high prices, high inventory

In June, prices rose for the fifth month in a row, peaking at an all-time high in June 2024. This also marks the 12th consecutive month of year-over-year price growth. According to typical seasonality, the median price peaks in June, so we expect prices to decline starting in July. Over time, prices generally move much higher in the first half of the year than they decline in the second half; you can think of it as two steps forward and one step back, year after year. Last year, for example, prices rose 13.7% from January 2023 to June 2023, then fell 7.7% from June 2024 to January 2024, which was still a year-over-year gain of 4.9%. This year will likely look similar, although we don’t think that prices will decline as much in the second half of 2024 as they did in 2023, especially if the Fed cuts rates in the fall. Even a minor rate cut, like the expected 0.25%, could significantly affect mortgage rates, as it would signal the beginning of more and more cuts.
 
For the moment though, we are starting summer with a combination of elevated mortgage rates and record high prices, which have brought affordability to an all-time low. Low affordability has resulted in fewer sales and growing inventory. Demand is still high relative to supply, even though inventory is building. We know that demand is still high because buyers are still buying at peak prices. From a historical context, we should’ve expected this to happen. We took a look at data from the 1980s to see how much home prices appreciated during a decade-long period of the highest mortgage rates in history. From January 1, 1980, to January 1, 1990, the 30-year mortgage rate ranged from 9.03% to 18.63%, with an average rate of 12.71%. Although home prices didn’t increase dramatically like they have in the recent past, inflation-adjusted home prices still increased about 8% during that decade. Today, with the strong U.S. economy, it was never very likely for home prices to stagnate or decline due to higher mortgage rates. However, high rates have slowed sales volume considerably, which has caused inventory to grow.
 
Overall, inventory growth is great news for the undersupplied U.S. housing market. According to data from the National Association of REALTORS® (NAR), inventory reached its highest level since August 2022. The market is still broadly undersupplied, but the increasing inventory level should cause rising home prices to slow. In the pre-pandemic seasonal trends, sales, new listings, inventory, and price would roughly all rise in the first half of the year and decline in the second half of the year. Sales and new listings have been far lower than usual since mortgage rates started climbing, which is to be expected. Because we don’t anticipate sales to pick up until the spring of 2025, inventory could continue to grow in the second half of the year.
 
Different regions and individual houses vary from the broad national trends, so we’ve included a Local Lowdown below to provide you with in-depth coverage for your area. As always, we will continue to monitor the housing and economic markets to best guide you in buying or selling your home.
 

Big Story Data

The San Francisco Real Estate Local Lowdown

Quick Take:
  • Median single-family home and condo prices rose meaningfully in the first half of 2024, up 14.0% and 7.2%, respectively. Year-over-year prices also appreciated 4% for single-family homes, but are down 8% for condos.
  • Active listings fell 17.5% month over month, along with a 19.9% decline in sales and a 43.9% drop in new listings. Housing supply is at a record low and will certainly remain tight for the rest of the year.
  • Months of Supply Inventory declined for single-family homes but rose for condos. In June, MSI indicated a sellers’ market for single-family homes and a buyers’ market for condos.
Note: You can find the charts/graphs for the Local Lowdown at the end of this section.
 

The median single-family home and condo prices are up 14% and 7%, respectively, year to date

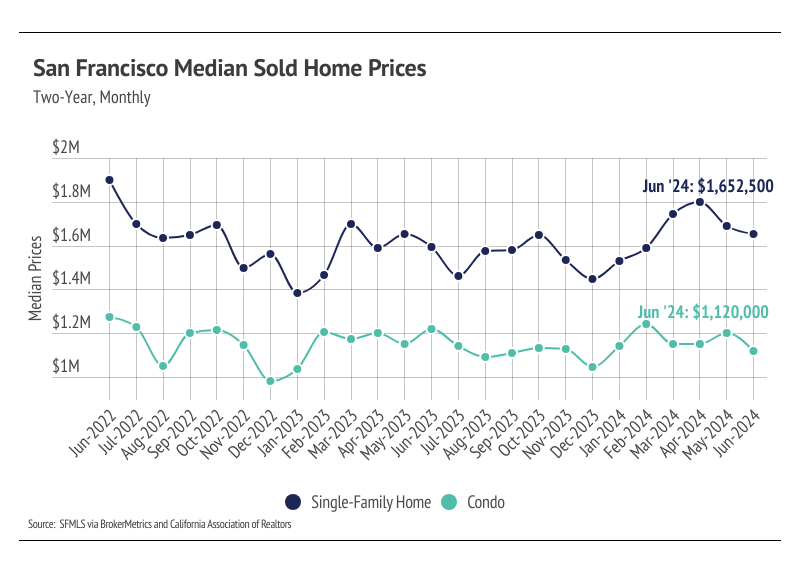
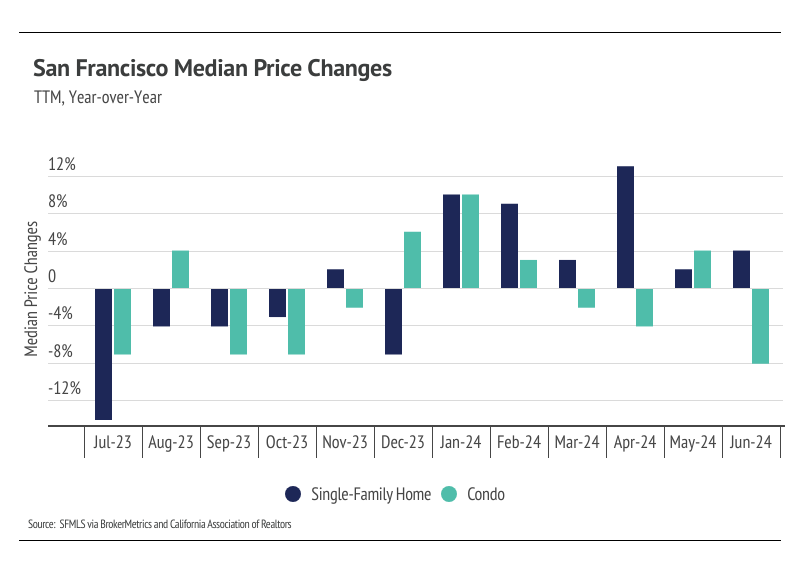
In San Francisco, home prices haven’t been largely affected by rising mortgage rates after the initial period of price correction from May 2022 to July 2022. Since July 2022, the median single-family home and condo prices have hovered around $1.5 million and $1.2 million, respectively. However, the horizontal trend may be changing. From December 2023 to June 2024, the median single-family home price rose 14%, and condo prices were up 7%. Year over year, the median price was up 4% for single-family homes and down 8% for condos. Prices are more likely to rise if more sellers come to the market. Inventory is so low that rising supply will only increase prices as buyers are better able to find the best match. More homes must come to the market to get anything close to a healthy market.

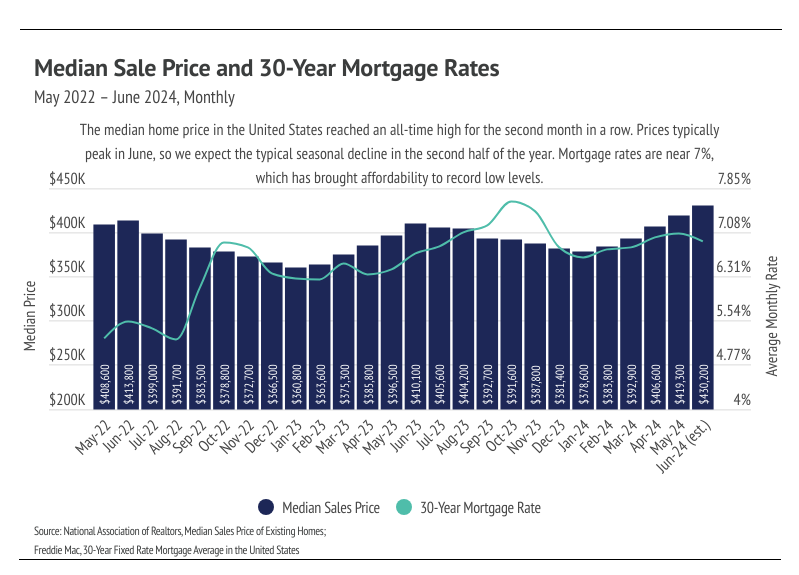
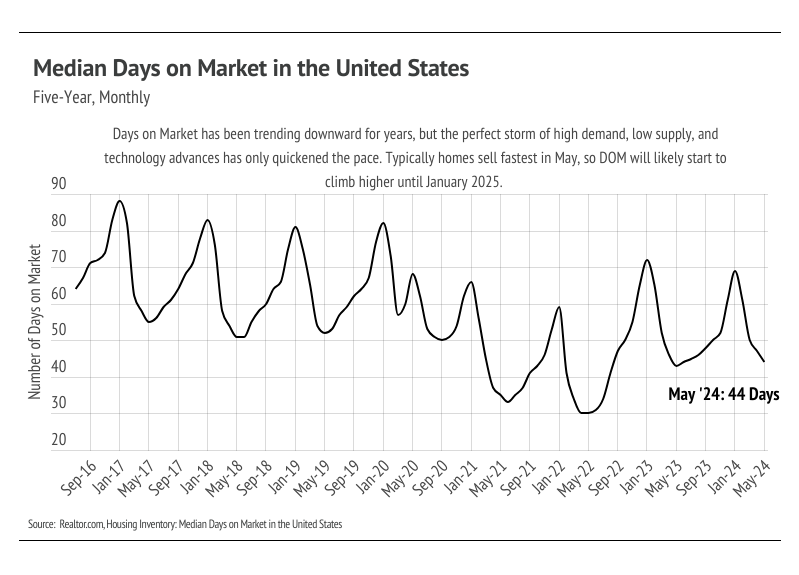
High mortgage rates soften both supply and demand, but home buyers and sellers seemed to tolerate rates above 6%. Now that rates are near 7% again, sales are slowing during the time of the year when sales tend to be at their highest. This phenomenon isn’t great for the market, but it isn’t terrible, either, as it may allow inventory to build in a massively undersupplied market.

Inventory hits a record low in June

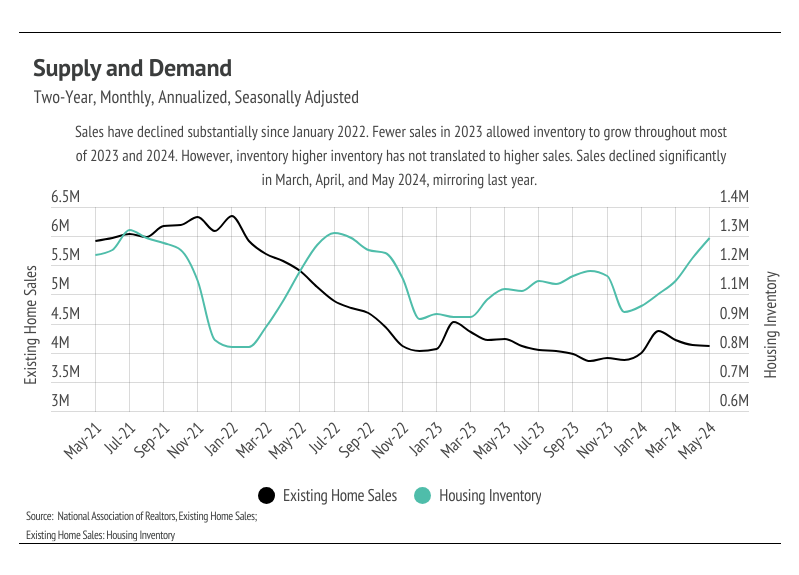
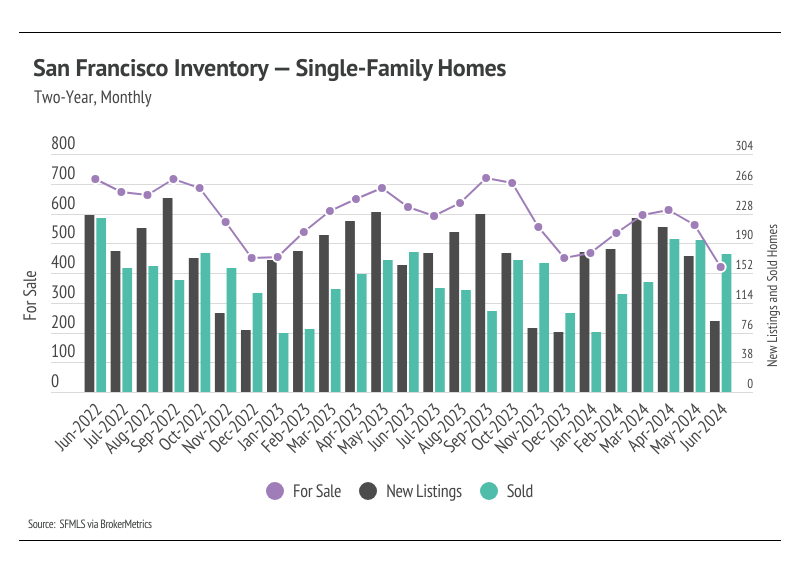
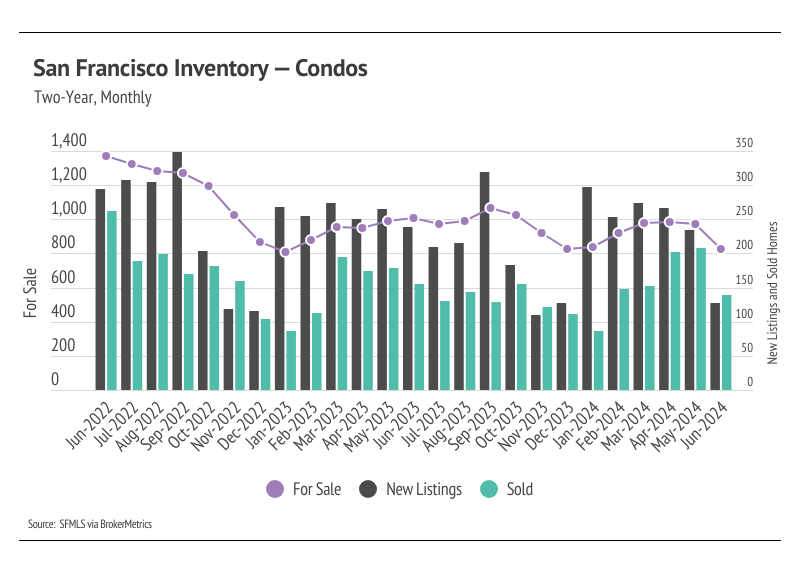
In 2023, single-family home inventory followed fairly typical seasonal trends, but at a significantly depressed level, while condo inventory has been in decline since May 2022. Low inventory and fewer new listings have slowed the market considerably. Typically, inventory in San Francisco has two peaks, one in May and one in September, and then declines through December or January, but the lack of new listings prevented meaningful inventory growth. New listings have been exceptionally low, so the little inventory growth throughout 2023 was driven by fewer sales. In November and December 2023, new listings dropped significantly without a proportional drop in sales, causing inventory to fall to an all-time low in December, which further highlights how undersupplied the market has been over the past year.

In the beginning of 2024, we were hopeful that inventory and new listings would resemble historically seasonal patterns. However, new listings haven’t come to the market in the quantity needed to bring a significant increase in inventory. This year, inventory looks to have already seen its first peak in April, which was an early sign that inventory would remain tight in 2024. The second sign was inventory falling to an all-time low in June, which is far from the seasonal norm. The number of new listings coming to market is a significant predictor of sales, and buyers simply aren’t able to buy homes that aren’t for sale. The demand in San Francisco is there, but supply — especially new supply — hasn’t come to the market. Now that we’re halfway through the year, it’s clear that supply will remain tight until spring 2025 at the earliest.

Months of Supply Inventory in June 2024 indicated a sellers’ market for single-family homes and a buyers’ market for condos

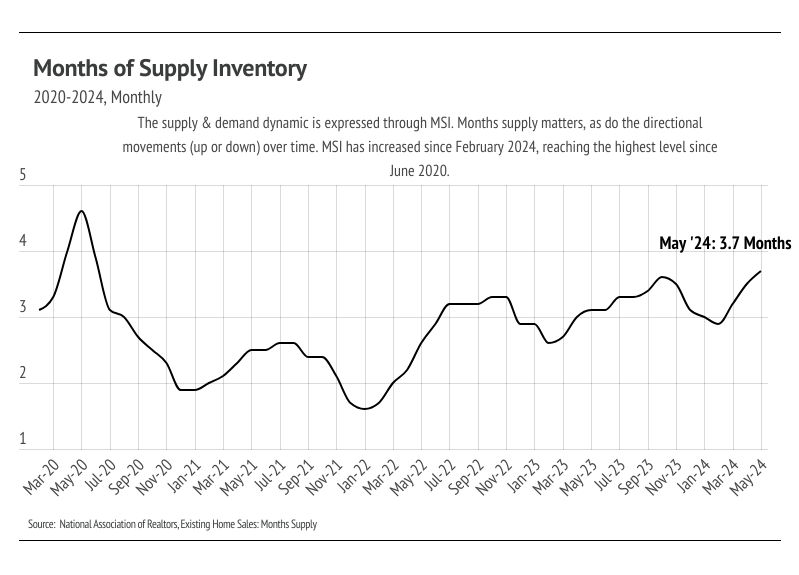
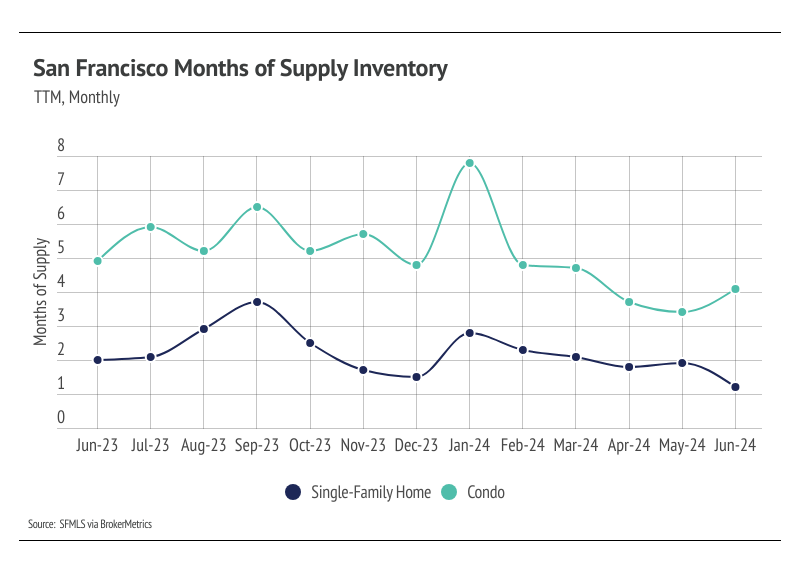
Months of Supply Inventory (MSI) quantifies the supply/demand relationship by measuring how many months it would take for all current homes listed on the market to sell at the current rate of sales. The long-term average MSI is around three months in California, which indicates a balanced market. An MSI lower than three indicates that there are more buyers than sellers on the market (meaning it’s a sellers’ market), while a higher MSI indicates there are more sellers than buyers (meaning it’s a buyers’ market). The San Francisco market tends to favor sellers, at least for single-family homes, which is reflected in its low MSI. However, we’ve seen over the past 12 months that this isn’t always the case. MSI has been volatile, moving between a buyers’ and sellers’ market throughout the year. From January to May, MSI declined significantly. In June, single-family home MSI continued to decline, while condo MSI rose sharply. Currently, the single-family home market favors sellers, and the condo market favors buyers.

Local Lowdown Data


Let's Talk

You’ve got questions and we can’t wait to answer them.