BY THE NUMBERS: SF Bay Area Housing Market Update
January 25, 2021

January 25, 2021
This month, we take a look at the ways in which the U.S. housing market has behaved during the pandemic. We do so by examining the Case-Shiller 20-City Composite Index, which tracks property values across 20 different cities and indicates the health of the overall economy.
As of December 7, many counties in California had once again implemented stay-at-home orders due to COVID-19, and the United States as a whole is seeing new peaks every day. Even amidst this uncertainty, demand for homes has never been higher. Mortgage rates continue at all-time lows, and buyers are devoting more of their total spending to housing costs.
As we make our way through the holiday months, we continue to provide you with the most up-to-date market information so that you feel supported and informed in your buying and selling decisions.
In this month’s newsletter, we cover the following:
Key Topics and Trends
As we entered the final month of 2020, demand remained significantly high. Typically, the majority (55% to 70%) of American homebuyers are also home sellers, swapping their previous homes for something better suited to their changing needs. The current increase in price and decrease in supply, however, imply that more first-time homebuyers are entering the markets (a record-setting 2+ million first-time buyers), and more existing homeowners are buying second homes. For years, the amount of available housing has not kept up with demand, but the new wave of buyers has highlighted just how considerable the housing shortage is in the United States.
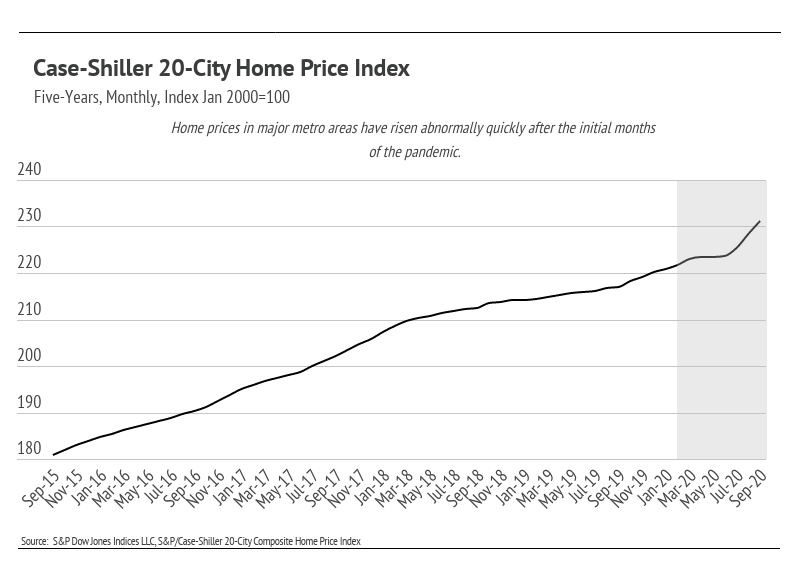
The Case-Shiller 20-City Home Price Index measures, in aggregate, the cost of a home across 20 major U.S. cities. It also serves as a barometer for the overall health of the economy. As we can see in the chart below, home prices have moved significantly higher over a short period of time, reaching record highs.
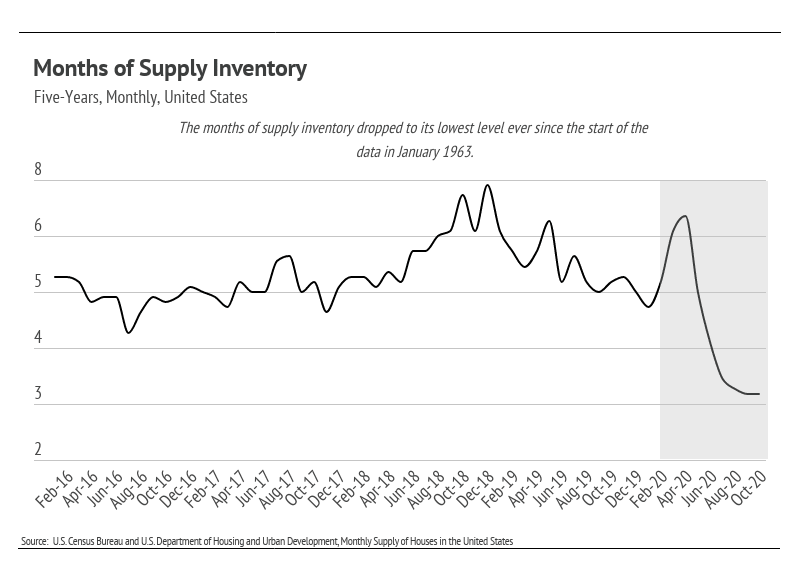
We can couple the price information with the Months of Supply Inventory (MSI), which quantifies the relationship between supply and demand. More specifically, MSI refers to the number of months it would take for the current inventory of homes on the market to sell given the current sales pace. Historically, six months of supply is associated with moderate price appreciation, and a lower MSI tends to push prices up more rapidly, according to the National Association of Realtors. At a national level, the supply of homes relative to demand is the lowest it has ever been since the data were first tracked in 1963. Because of technological advances, virtual tours, and faster document processing, homes can be sold quickly, thereby reducing the supply of homes for sale at a much faster rate.
The current situation creates a feedback loop that drives prices higher. The most desirable benefit, especially when there are three to four offers on a property, is that the property will be sold for the highest possible price. That home then becomes a comparable property for other homes nearby, driving up prices in the neighborhood when they, in turn, go on the market.
President-elect Joe Biden released a $640 billion housing plan, part of which aims to make homeownership more accessible to mid- and low-income Americans. Some ideas in the plan include giving a tax credit up to $15,000 at the time of purchase and offering down payment assistance to teachers, first responders, and other essential service workers. Although this will certainly help some people, the most desirable properties will likely remain within reach only for upper-income earners. Additionally, if new affordable housing is not built, prices could rise for the currently more affordable homes. We will keep an eye on the implementation of these policies to gauge their efficacy.
Demand shows no sign of decline in the near term. Today, housing is one of the best investments one can make, as it has been historically.
December Housing Market Updates for San Francisco
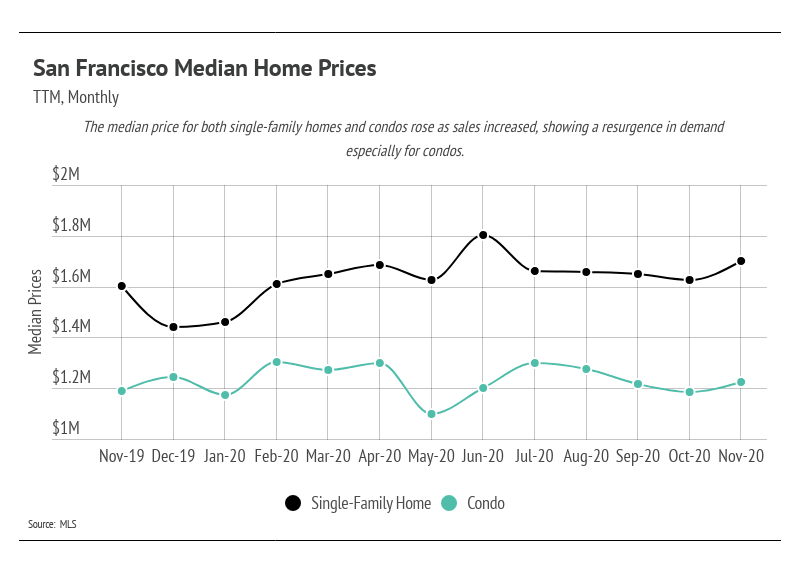
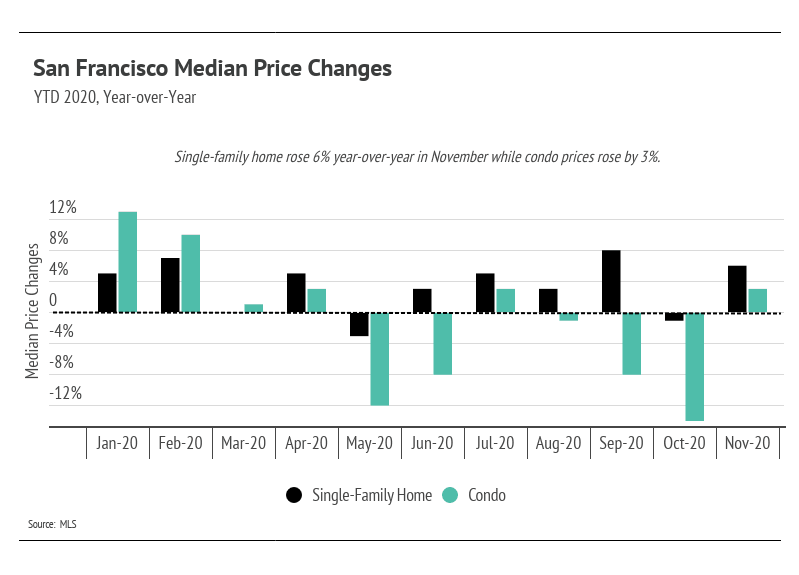
The median single-family home and condo prices rose month-over-month and year-over-year. Inventory has begun to decline as sales have increased, highlighting demand. Condo prices have notably declined from August through October, but the median price in November was 3% higher than last year.
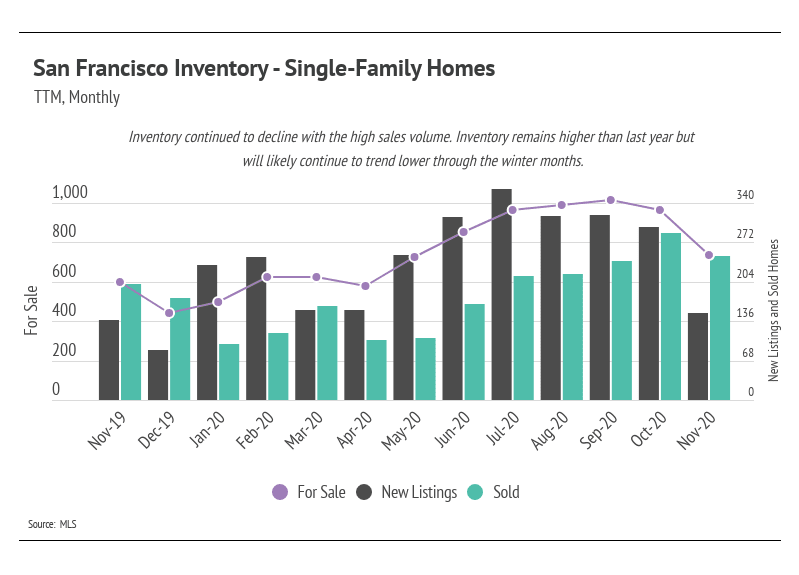
Total inventory continued to decline as fewer new homes came to market and the number of sold homes remained high. Like the rest of the country, demand is outpacing new supply, which increases home prices.
Single-family home sales have climbed since the initial months of the pandemic (March through May). Generally, buyers and sellers left the market in April and May, causing pent-up demand. Since May, sales have increased and are still near their highest levels this year for single-family homes. Usually, we expect sales to decline in the autumn and winter months, but this year’s summer selling season was delayed and seems to be spilling well into autumn. Single-family home inventory is noticeably lower, and is likely to decline as we make our way into the winter months.
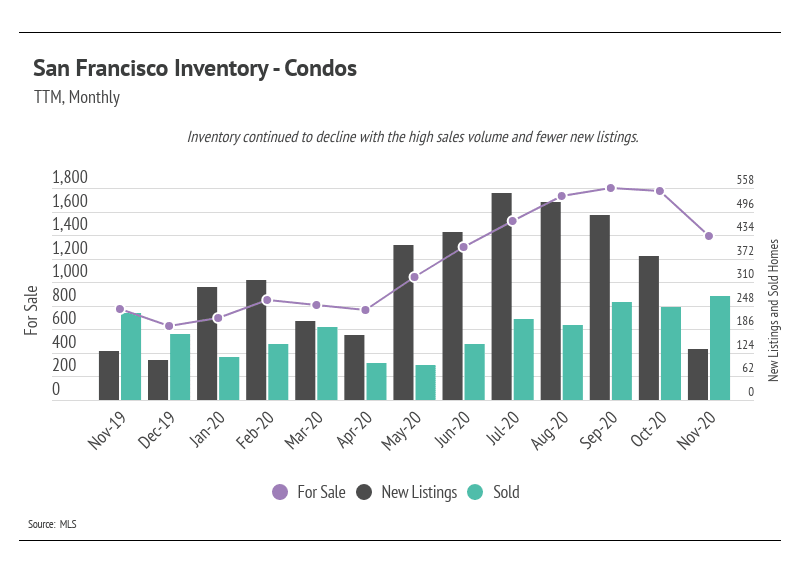
The number of condos on the market declined significantly in November. New condos coming to market have outpaced sales every month this year except for November, when sales were far greater than new supply. In November, condo inventory was still 24% higher than it was last year, but we are pleased to see a reduction in some of the excess inventory.
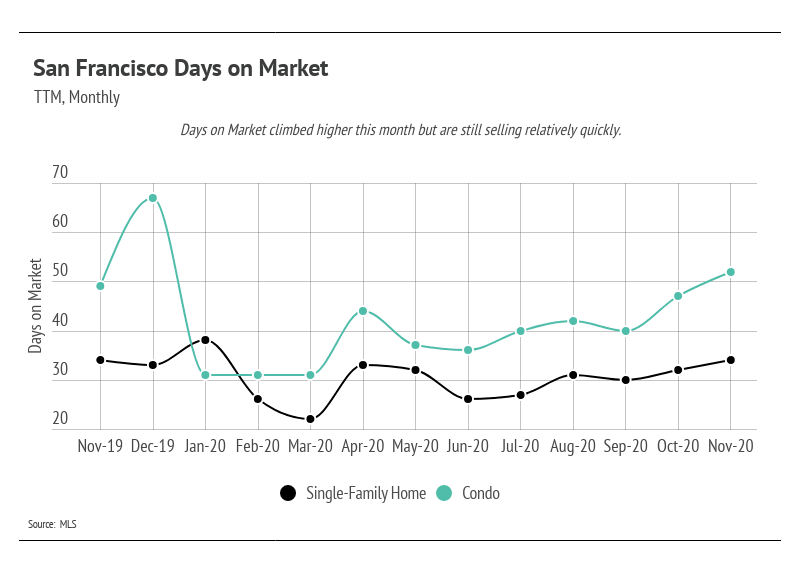
Days on Market was higher in November, which is attributed to sold homes that have been on the market for longer than average. Normally, rising DOM indicates a slowing market, but that is not the case for San Francisco. As we will see, the pace of sales affects MSI and has contributed to the low MSI over the past several months.
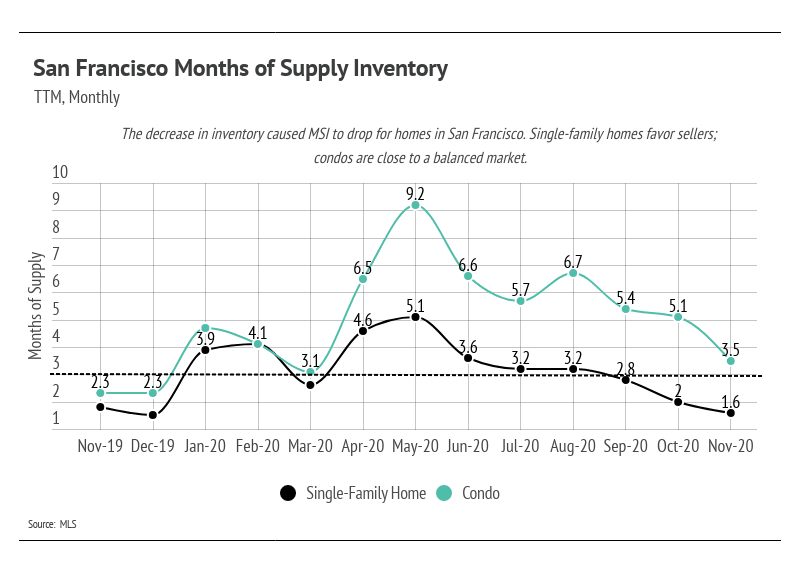
We can use MSI as a metric to judge whether the market favors buyers or sellers. The average MSI is three months in California (far lower than the national average of six months of supply), which indicates a balanced market. An MSI lower than three means that buyers dominate the market and there are relatively few sellers (i.e., it is a sellers’ market), while a higher MSI means there are more sellers than buyers (i.e., it is a buyers’ market). The MSI remains below two for single-family homes, which favors sellers. The MSI for condos fell considerably and now indicates a more balanced market.
In summary, the high demand in San Francisco has sustained home prices. Inventory for single-family homes and condos will likely decline further as we enter the winter months, and fewer sellers will likely come to market, potentially lifting prices higher. The condo market still is experiencing an oversupply, but is trending toward balance. Overall, the housing market has shown its resilience through the pandemic and remains one of the safest asset classes. The data show that housing has remained consistently strong through this period.
We anticipate new listings to slow through the holiday months. The autumn/winter season tends to see a slowdown in activity, although we may see a new trend this year with higher-than-normal sales.
As always, we remain committed to helping our clients achieve their current and future real estate goals. Our team of experienced professionals are happy to discuss the information we have shared in this newsletter. We welcome you to contact us with any questions about the current market or to request an evaluation of your home or condo.
Stay up to date on the latest real estate trends.

June 5, 2026
What San Francisco Homebuyers Need to Know Before Making an Offer

June 3, 2026
Are Home Prices Still Rising in Bernal Heights?

June 1, 2026
Are Home Prices Rising in Pacifica? How Fast Are Homes Selling? Here's What the Data Shows.

May 21, 2026
Breaking down home prices, condo trends, inventory levels, and buyer activity across San Francisco.
You’ve got questions and we can’t wait to answer them.