SF Housing Market Snapshot: Prices Up, Inventory Down, Homes Flying
December 23, 2025

December 23, 2025
Quick Take:
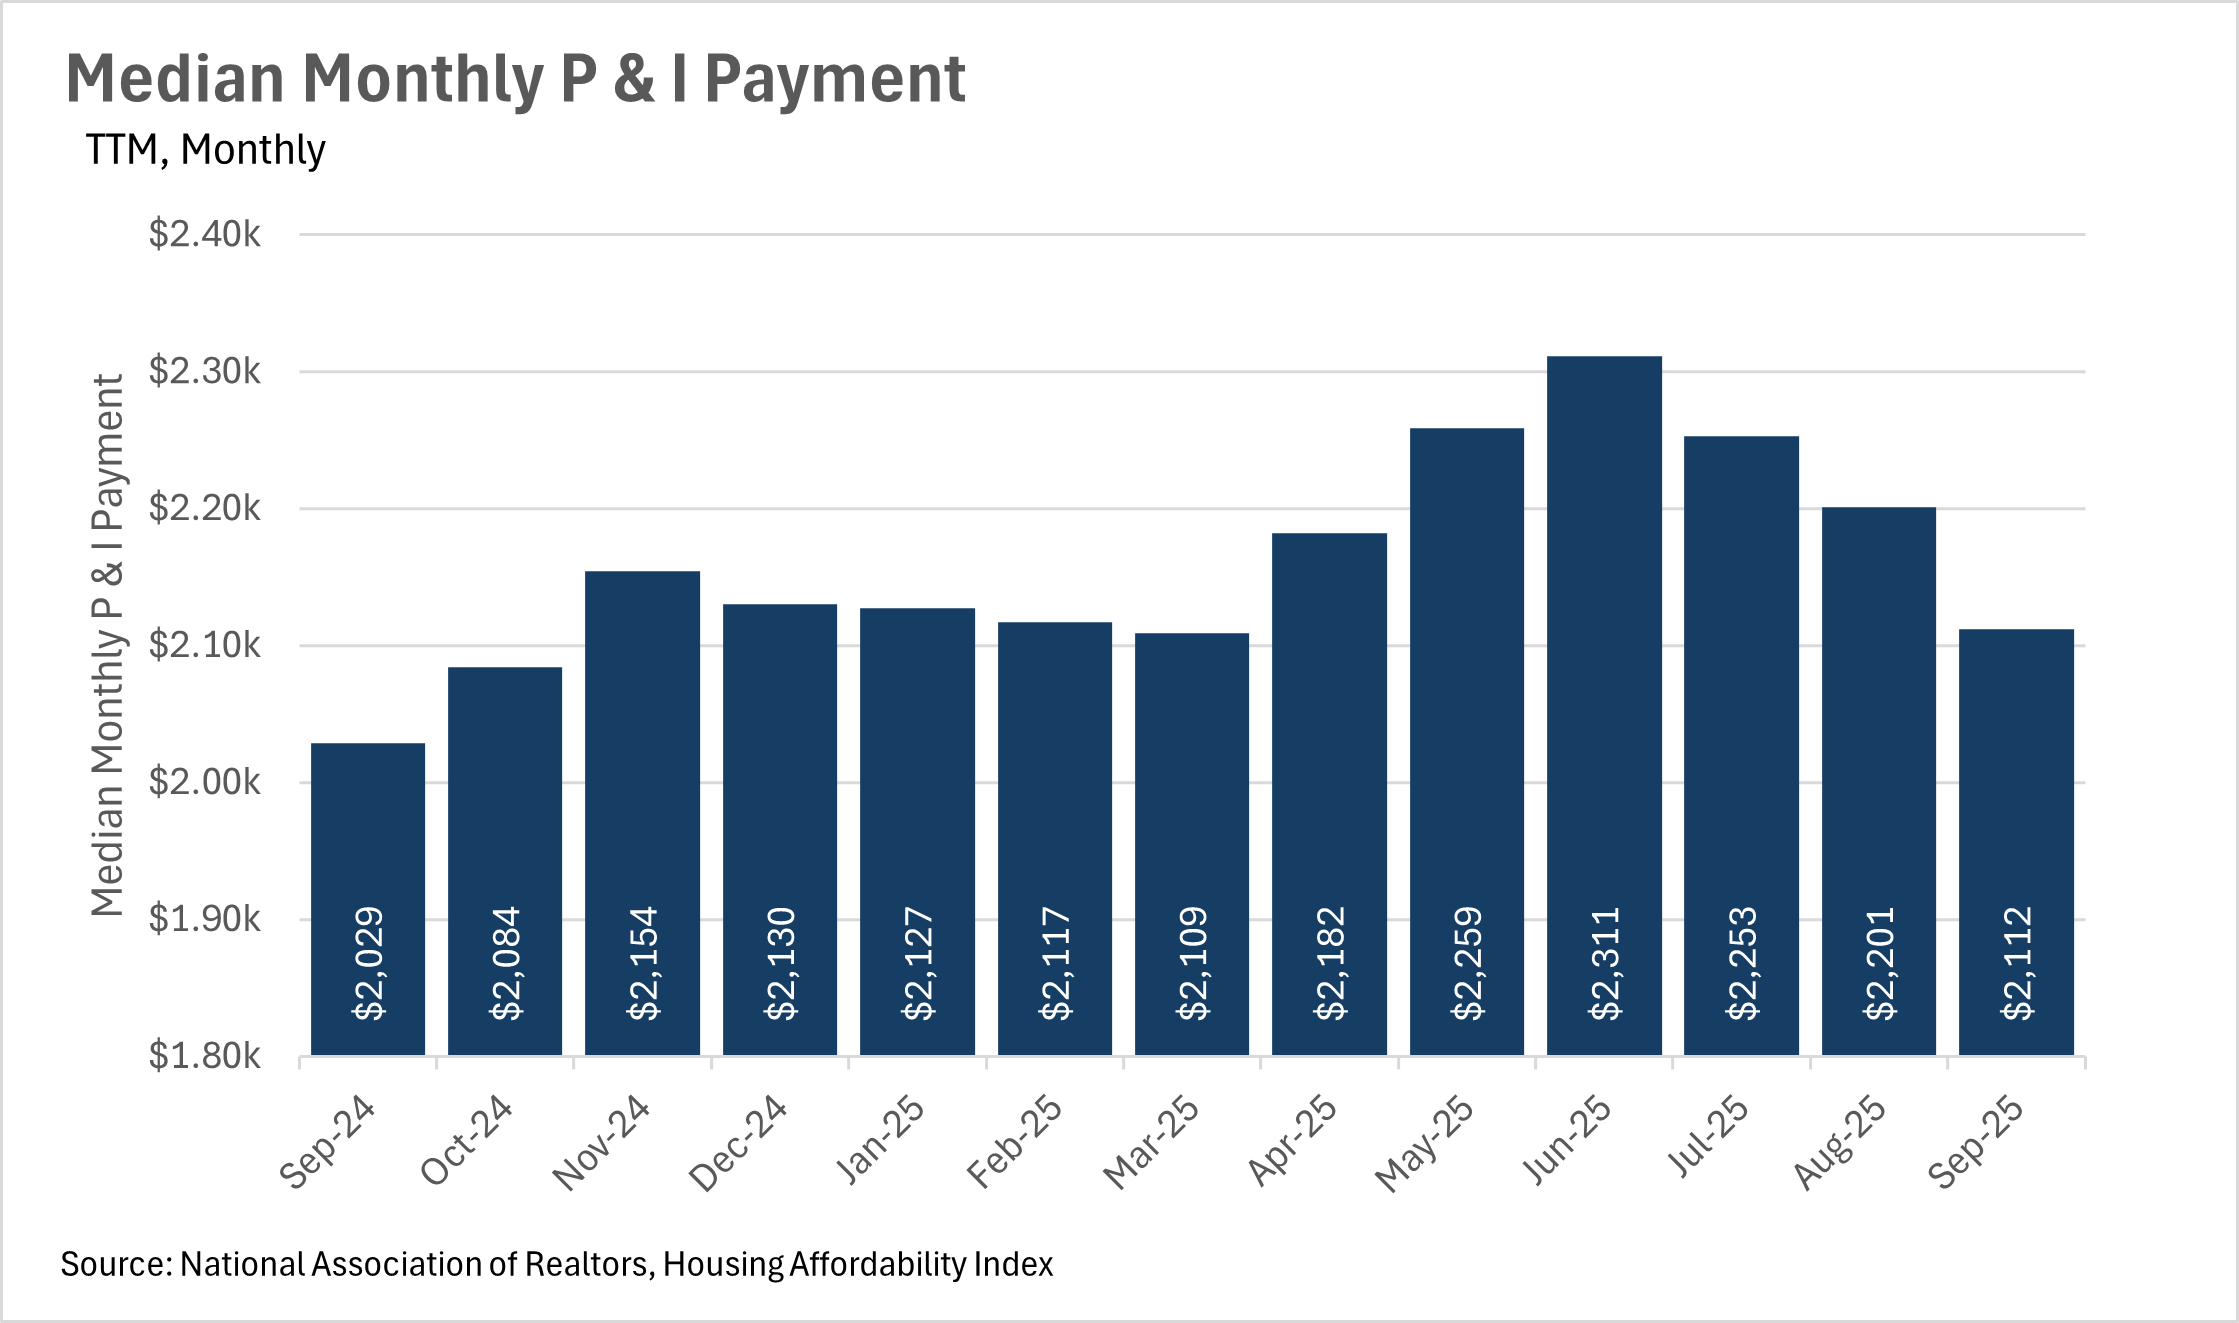
Unfortunately, we have yet to see mortgage rates drop below the 6% mark, as the Federal Reserve continues its cutting cycle, after its third consecutive cut to the federal funds rate in December. Although many are hopeful that we will continue to see rate cuts into 2026, the future of the federal funds rate is relatively uncertain. While there’s still roughly a month and a half before the next interest rate decision, CME’s FedWatch tool is predicting roughly a 25% chance that we see another rate cut in January. As we all know, the federal funds rate is the most important factor in the determination of interest rates, so paying attention to what the Fed is doing is pivotal! We’ll likely see an increase in the probability of another rate cut if some of the new/delayed economic data that’s coming out provides a cause for concern.
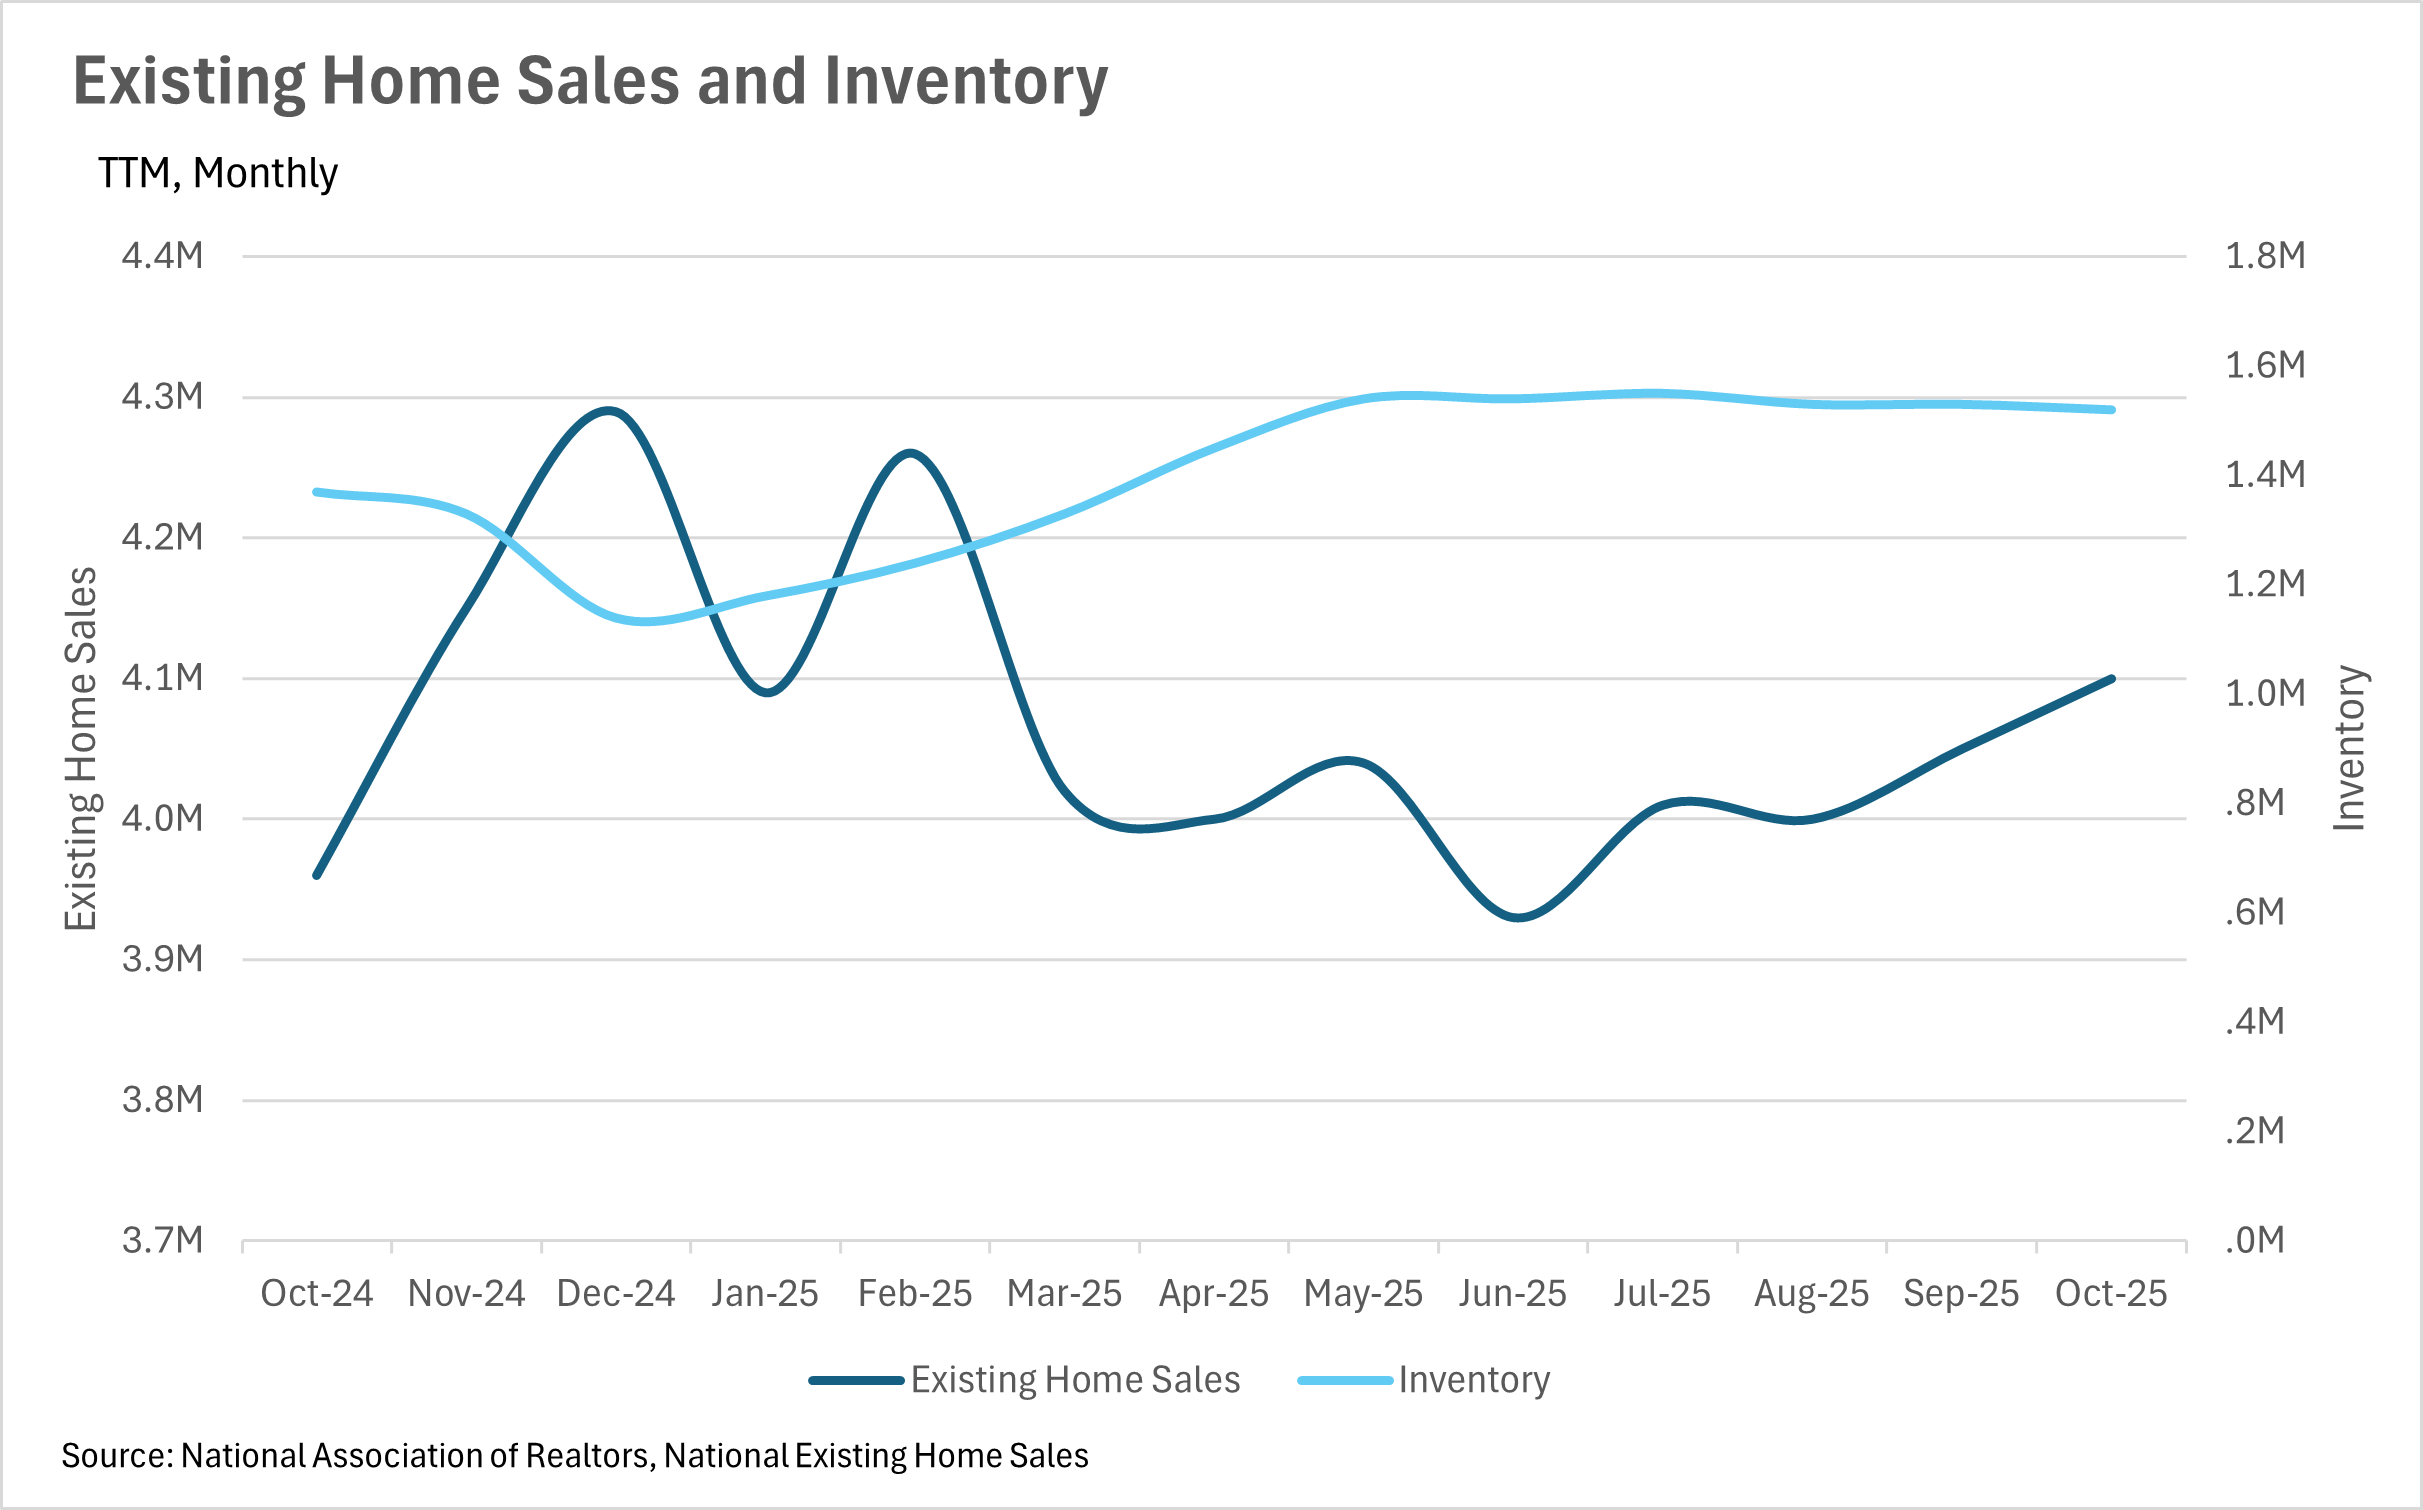
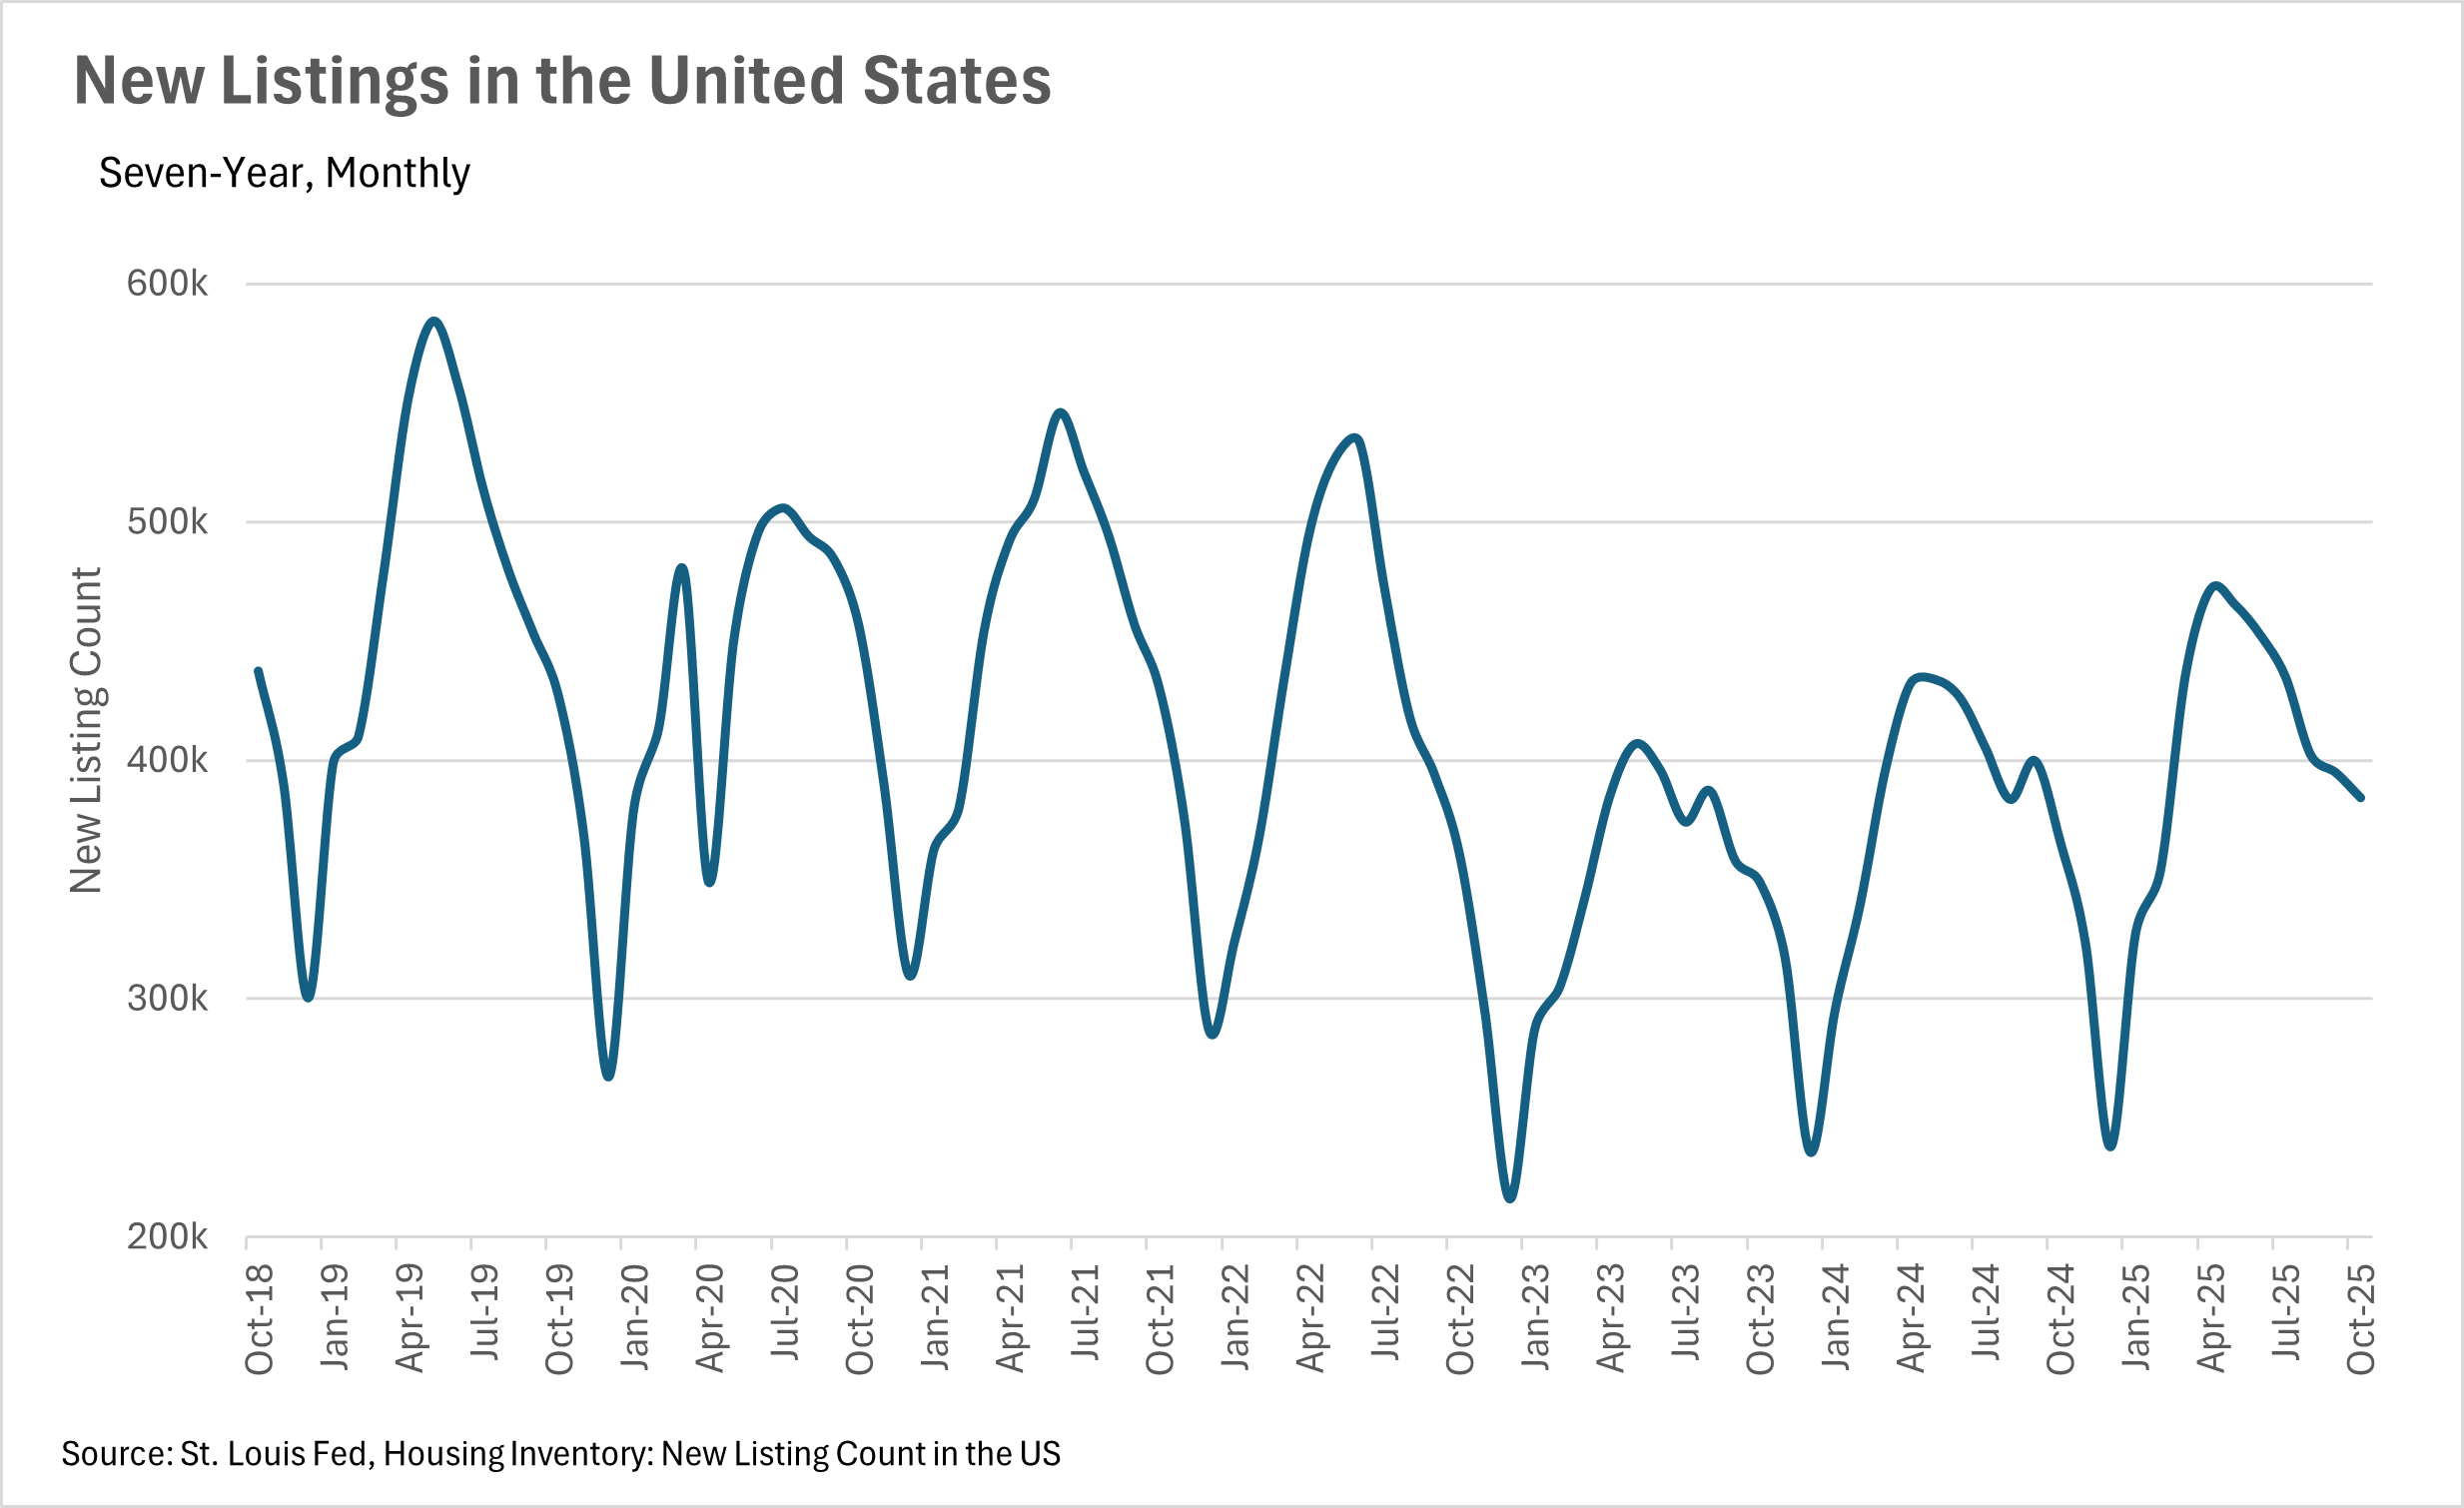
Throughout much of the year, inventories at a national level have remained remarkably steady, with most months hovering near the 1.5 million mark. With that being said, in the month of October, we saw inventory levels at roughly 1,520,000, representing a 10.95% increase on a year-over-year basis. During that same time period, we saw more than 384,000 new homes hit the market, representing an increase of 5.08% on a year-over-year basis. We also saw the median sale price for a home increase by 2.06%, bringing the median home value to $415,200.
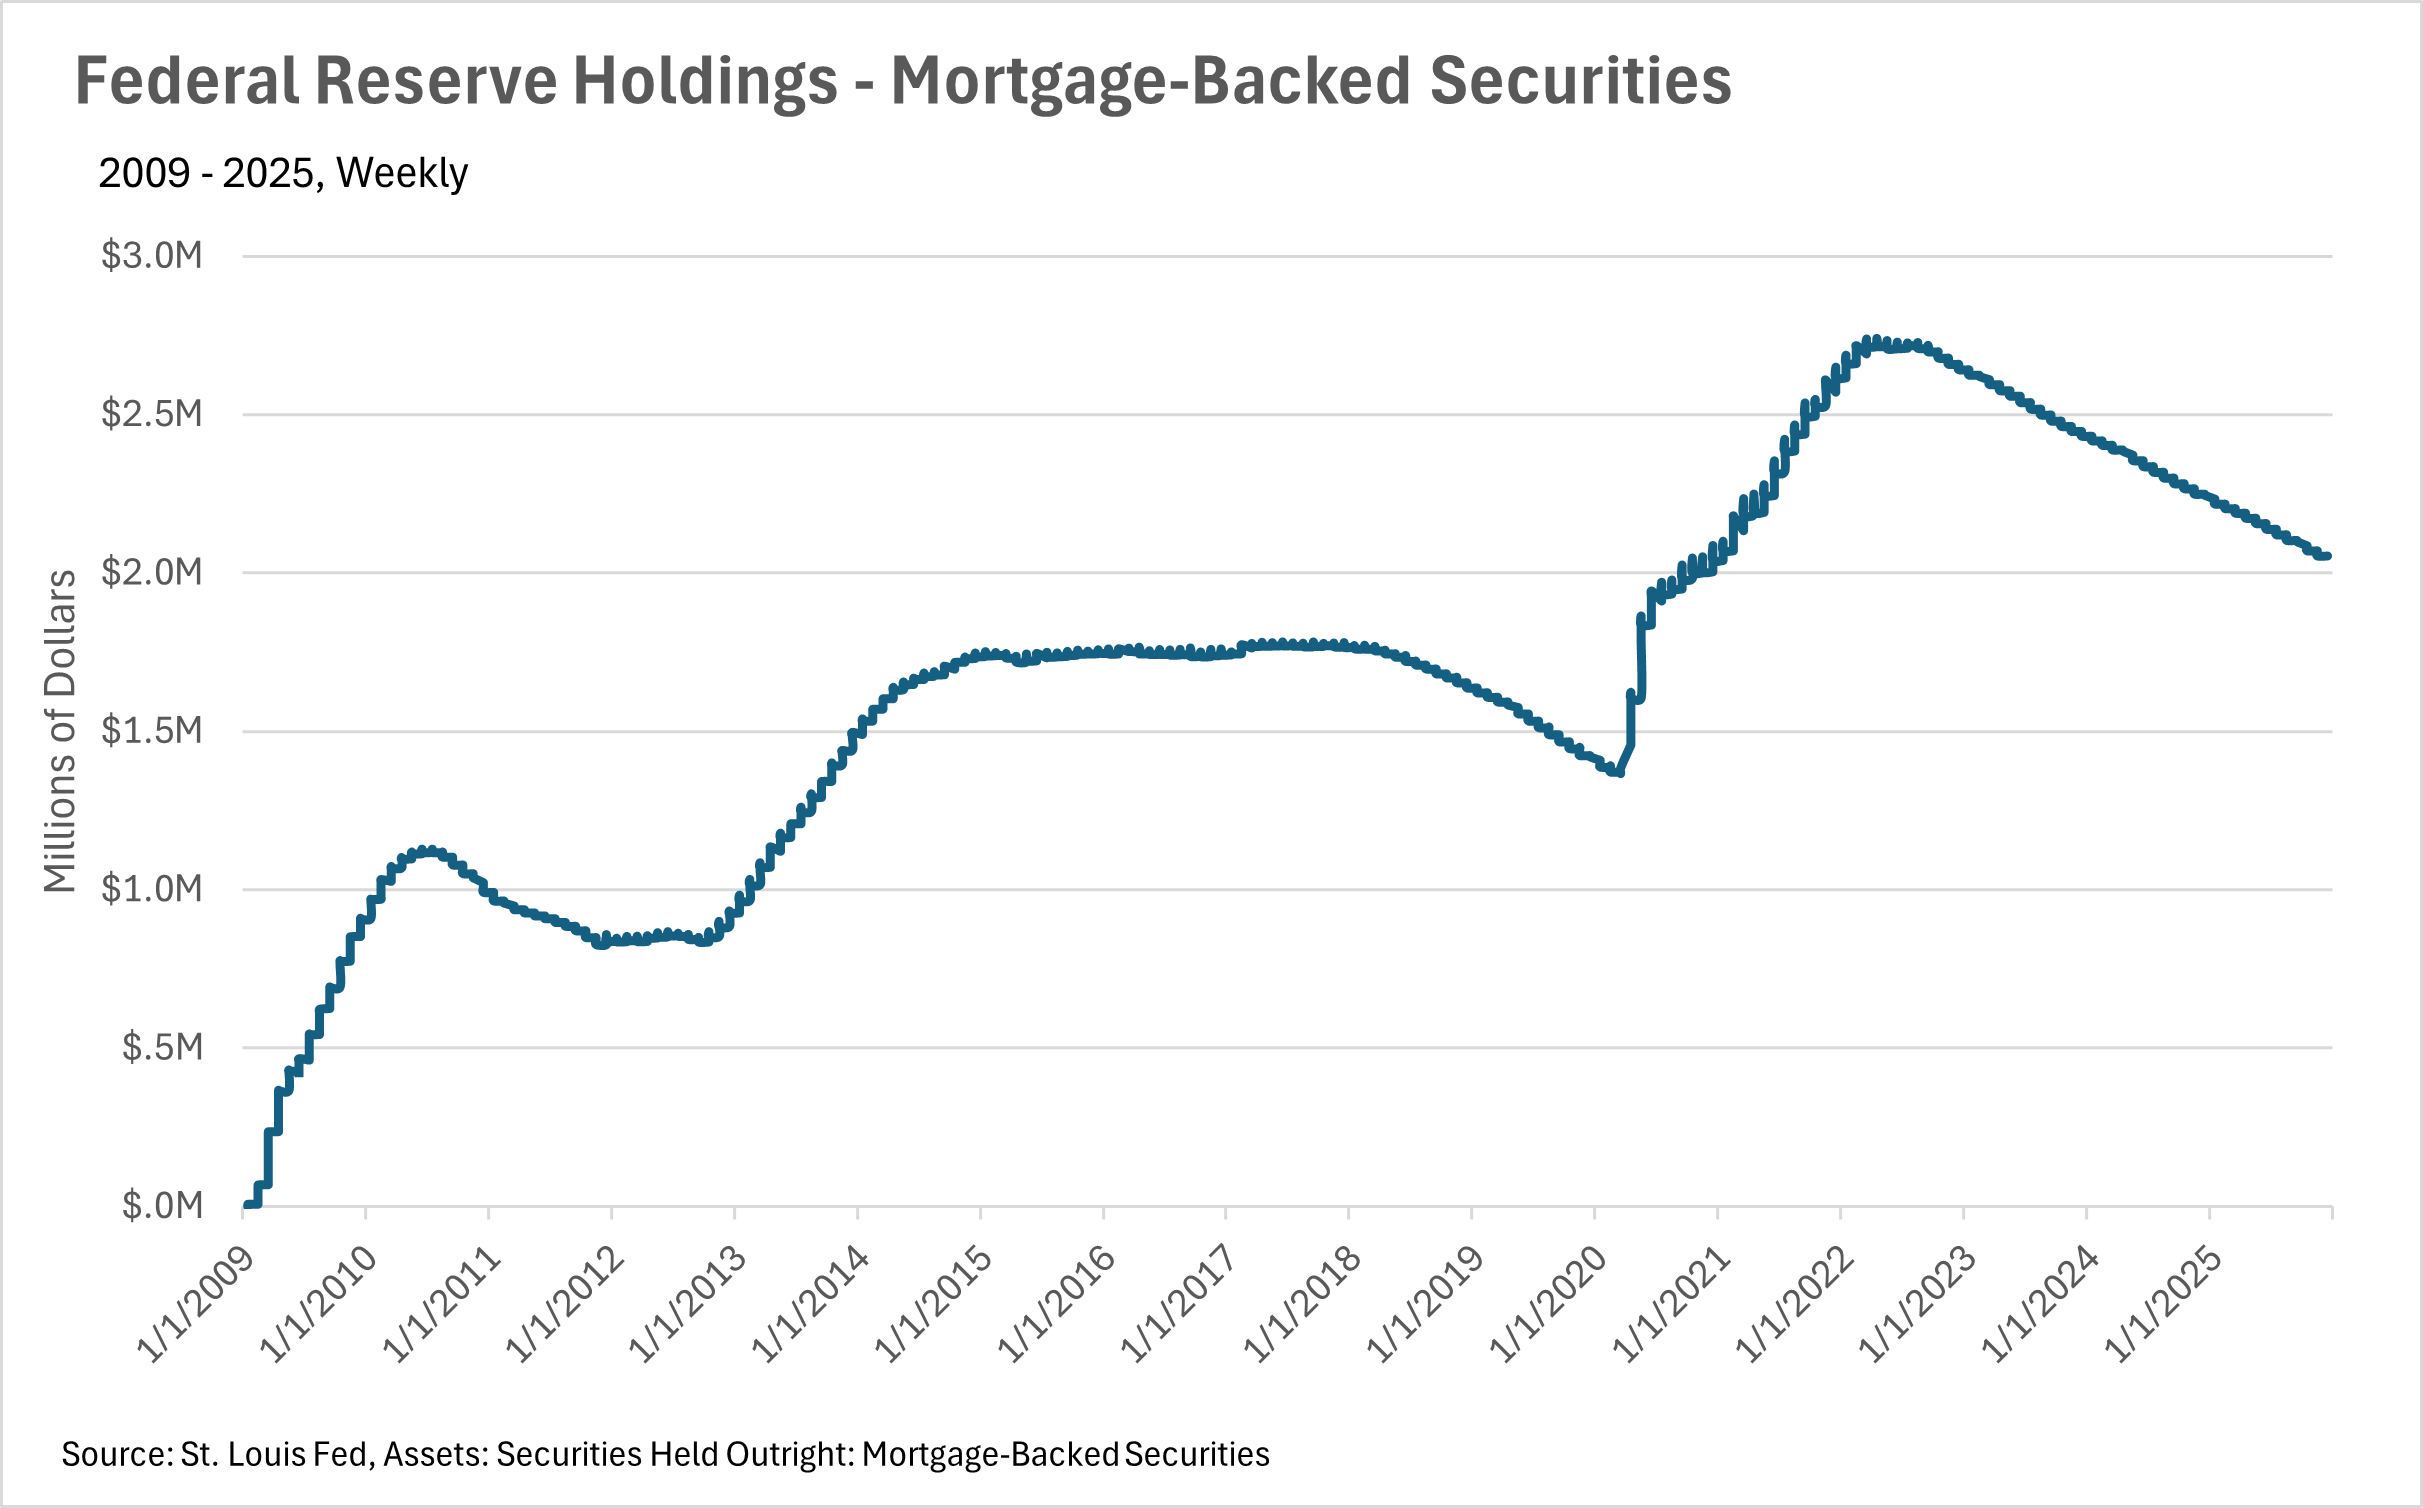
Right now, we’re in the midst of a relatively interesting period of time, economically speaking. During the government shutdown, not only were there very few publicly released economic datapoints, but many offices responsible for collecting data were unable to. This means we’re receiving economic data that has been tremendously delayed. Uncertainty like this, of course, does not bode well with countless entities, like lenders, markets, and most importantly, the Federal Reserve. Since the Fed is so reliant on public data that has been inaccessible/delayed given the government shutdown, it’s hard to tell what they will do next with interest rates. Luckily for homebuyers and sellers alike, we saw another quarter-point cut in December, but overall, it’s unclear whether or not this cut cycle will continue.
However, this is just what we’re seeing at a national level. As we all know, real estate is incredibly localized, so be sure to check out your local lowdown below!
Quick Take:
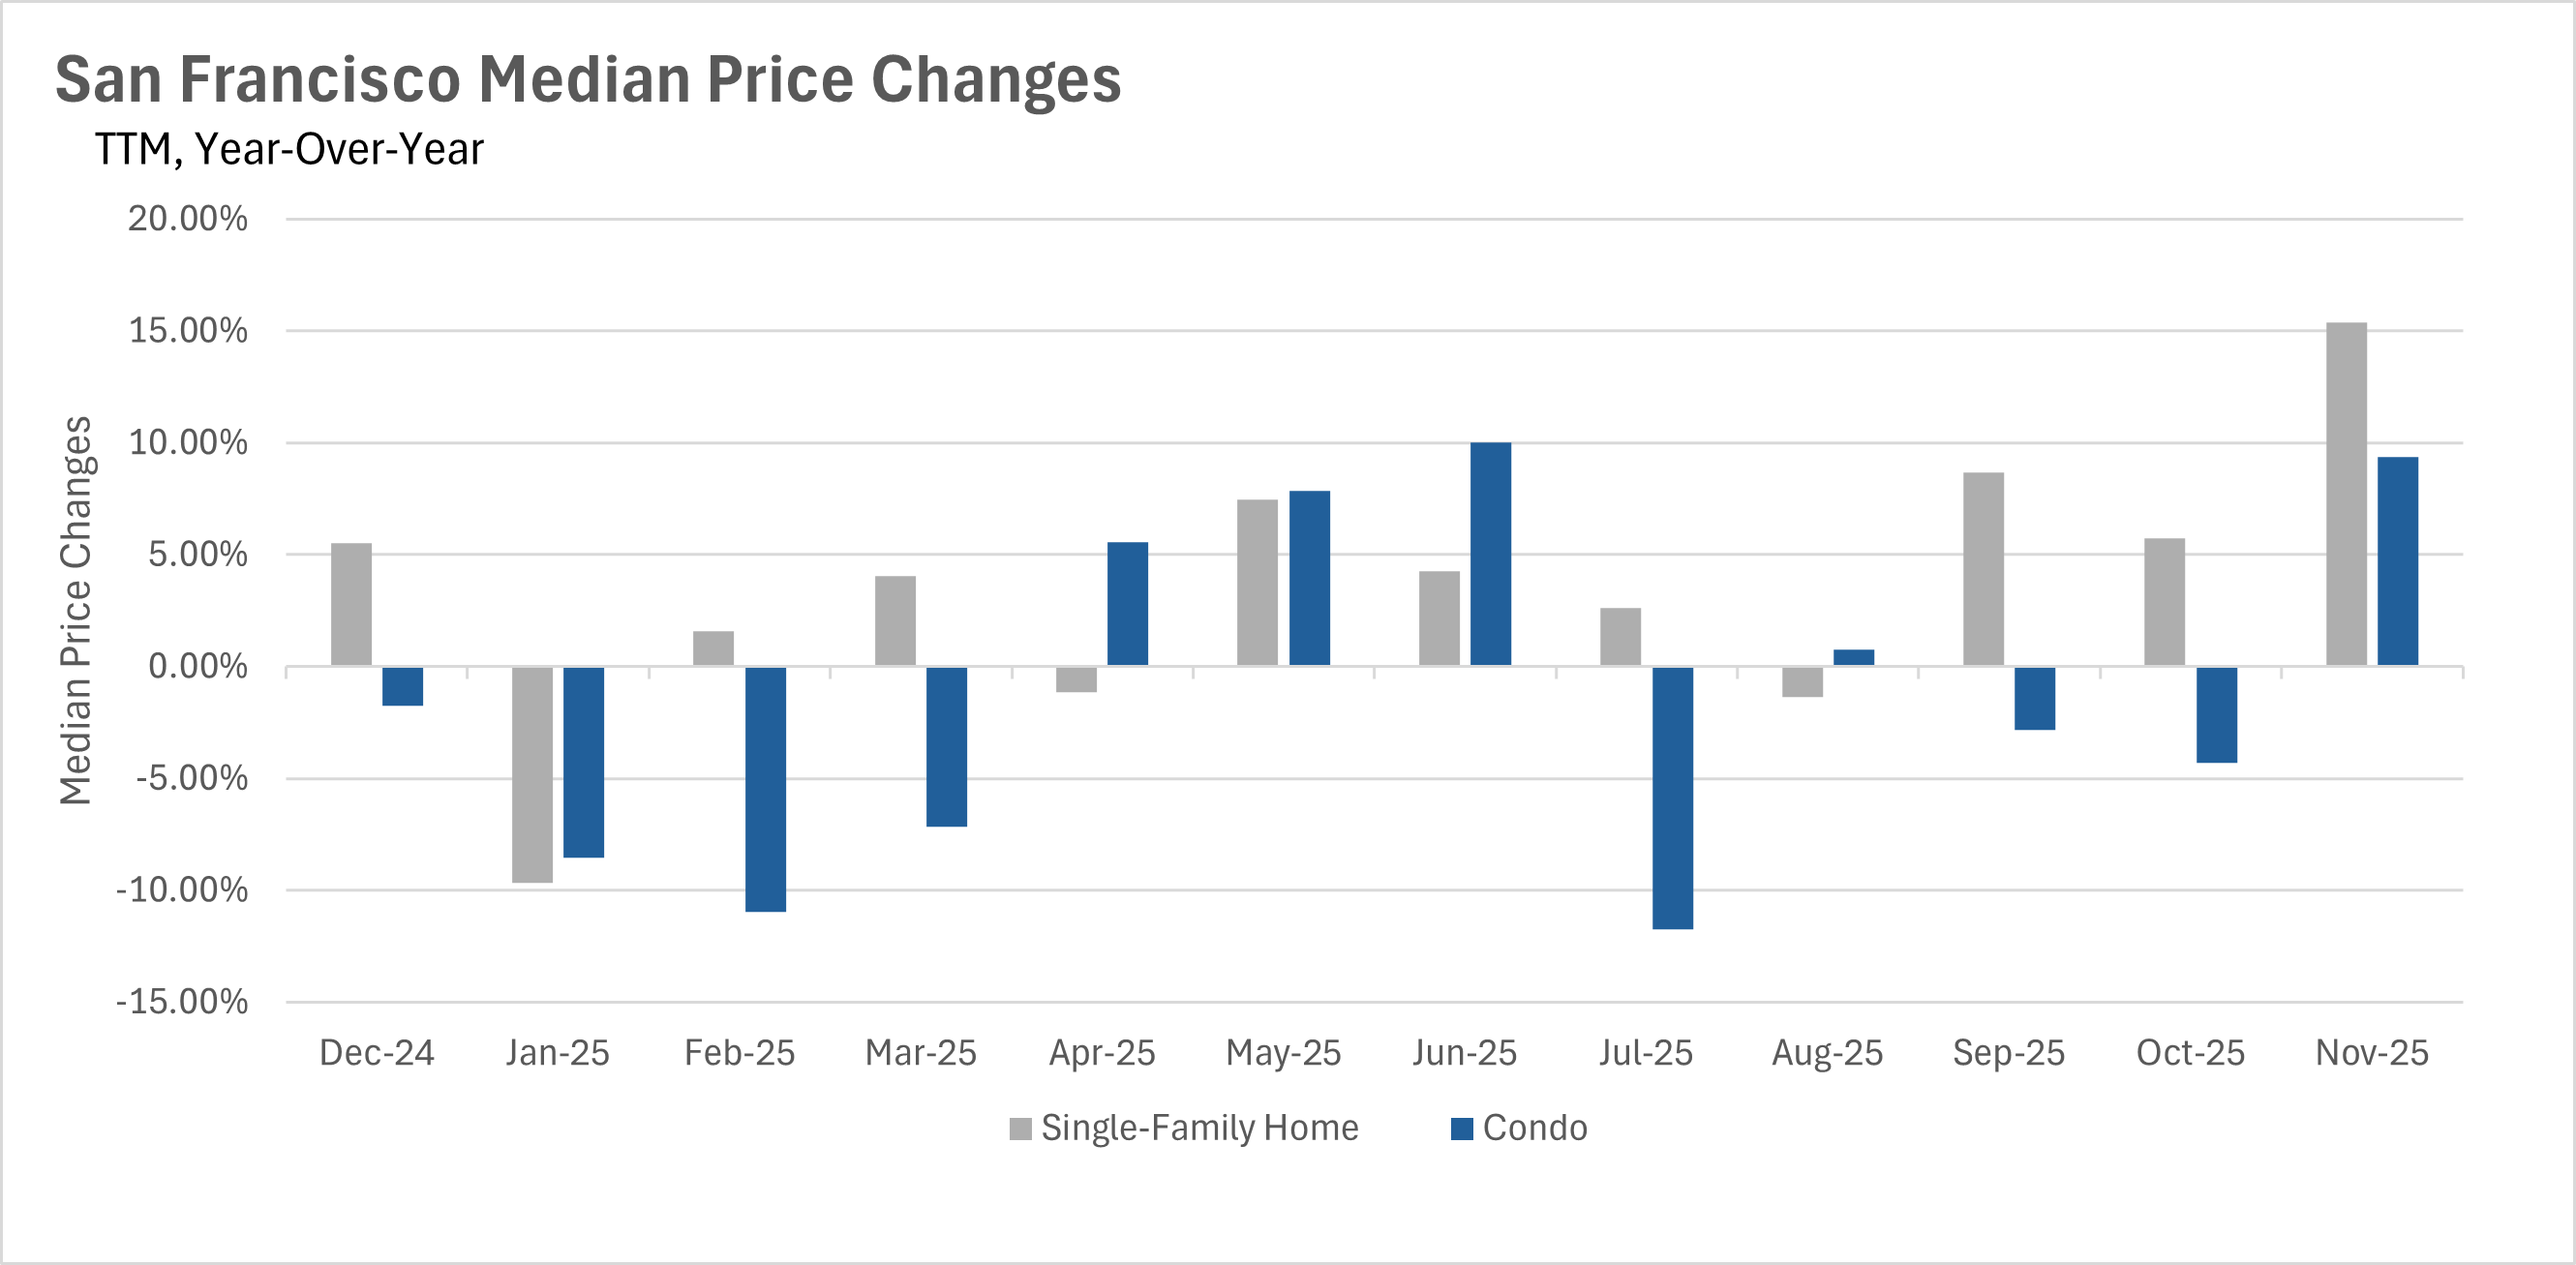
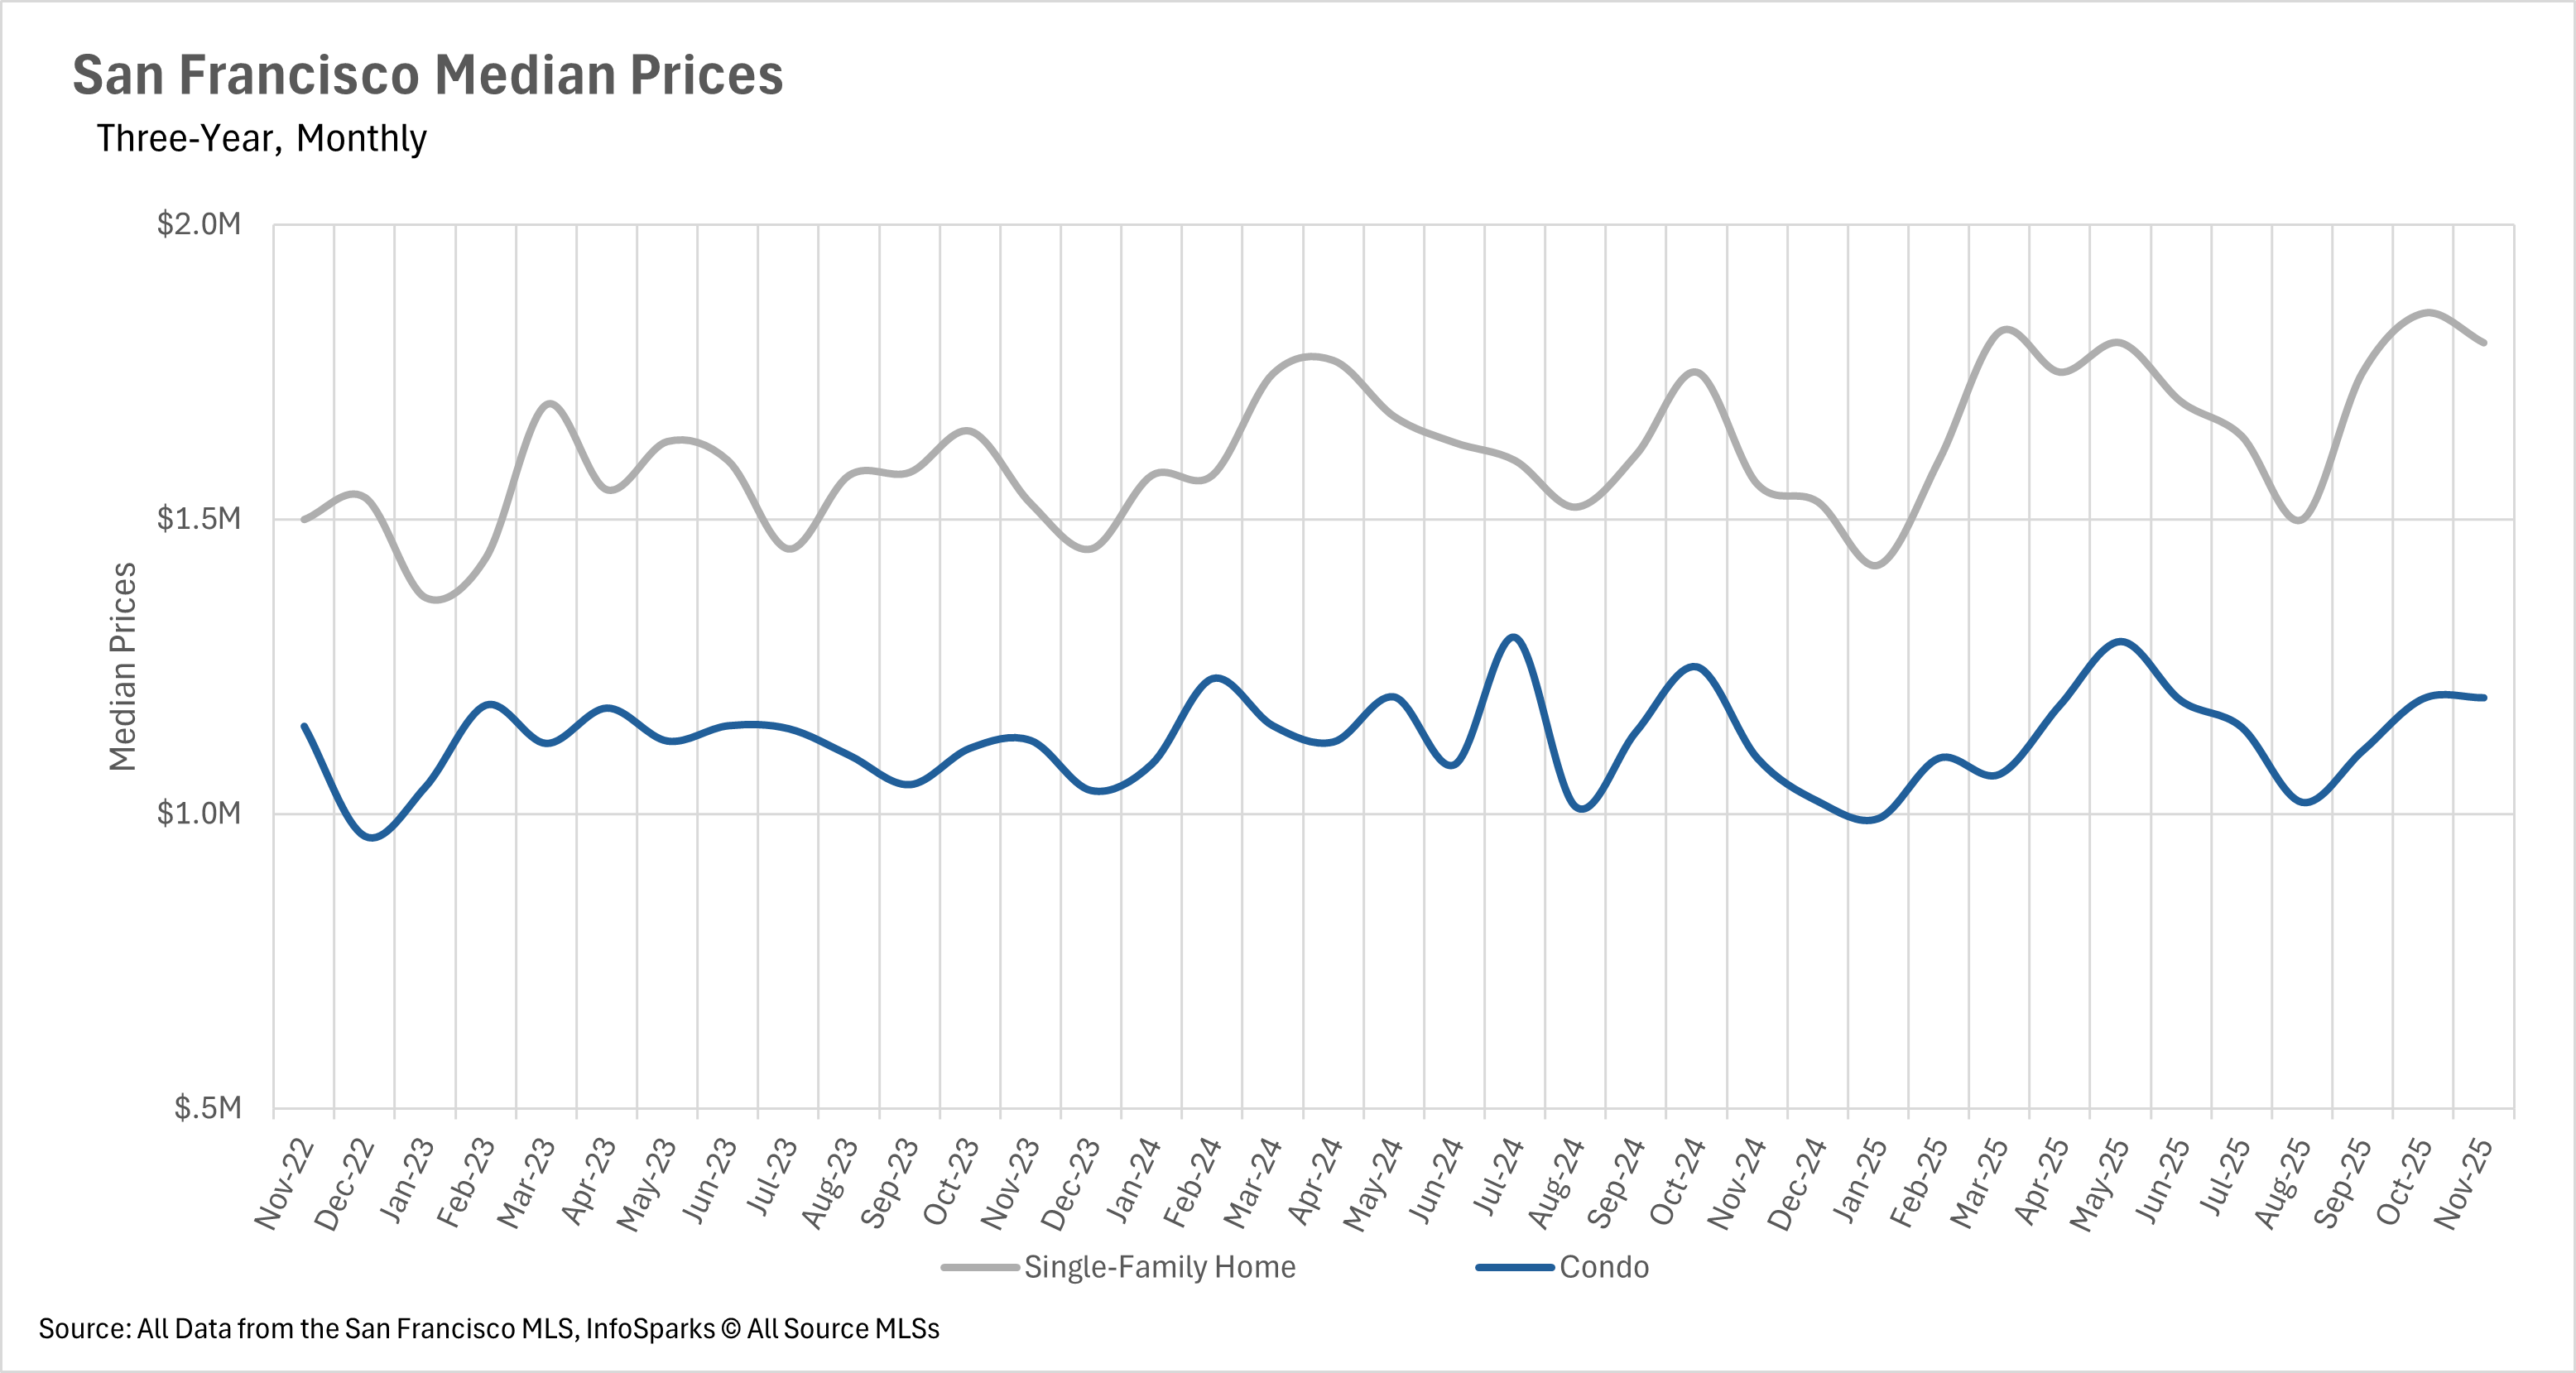
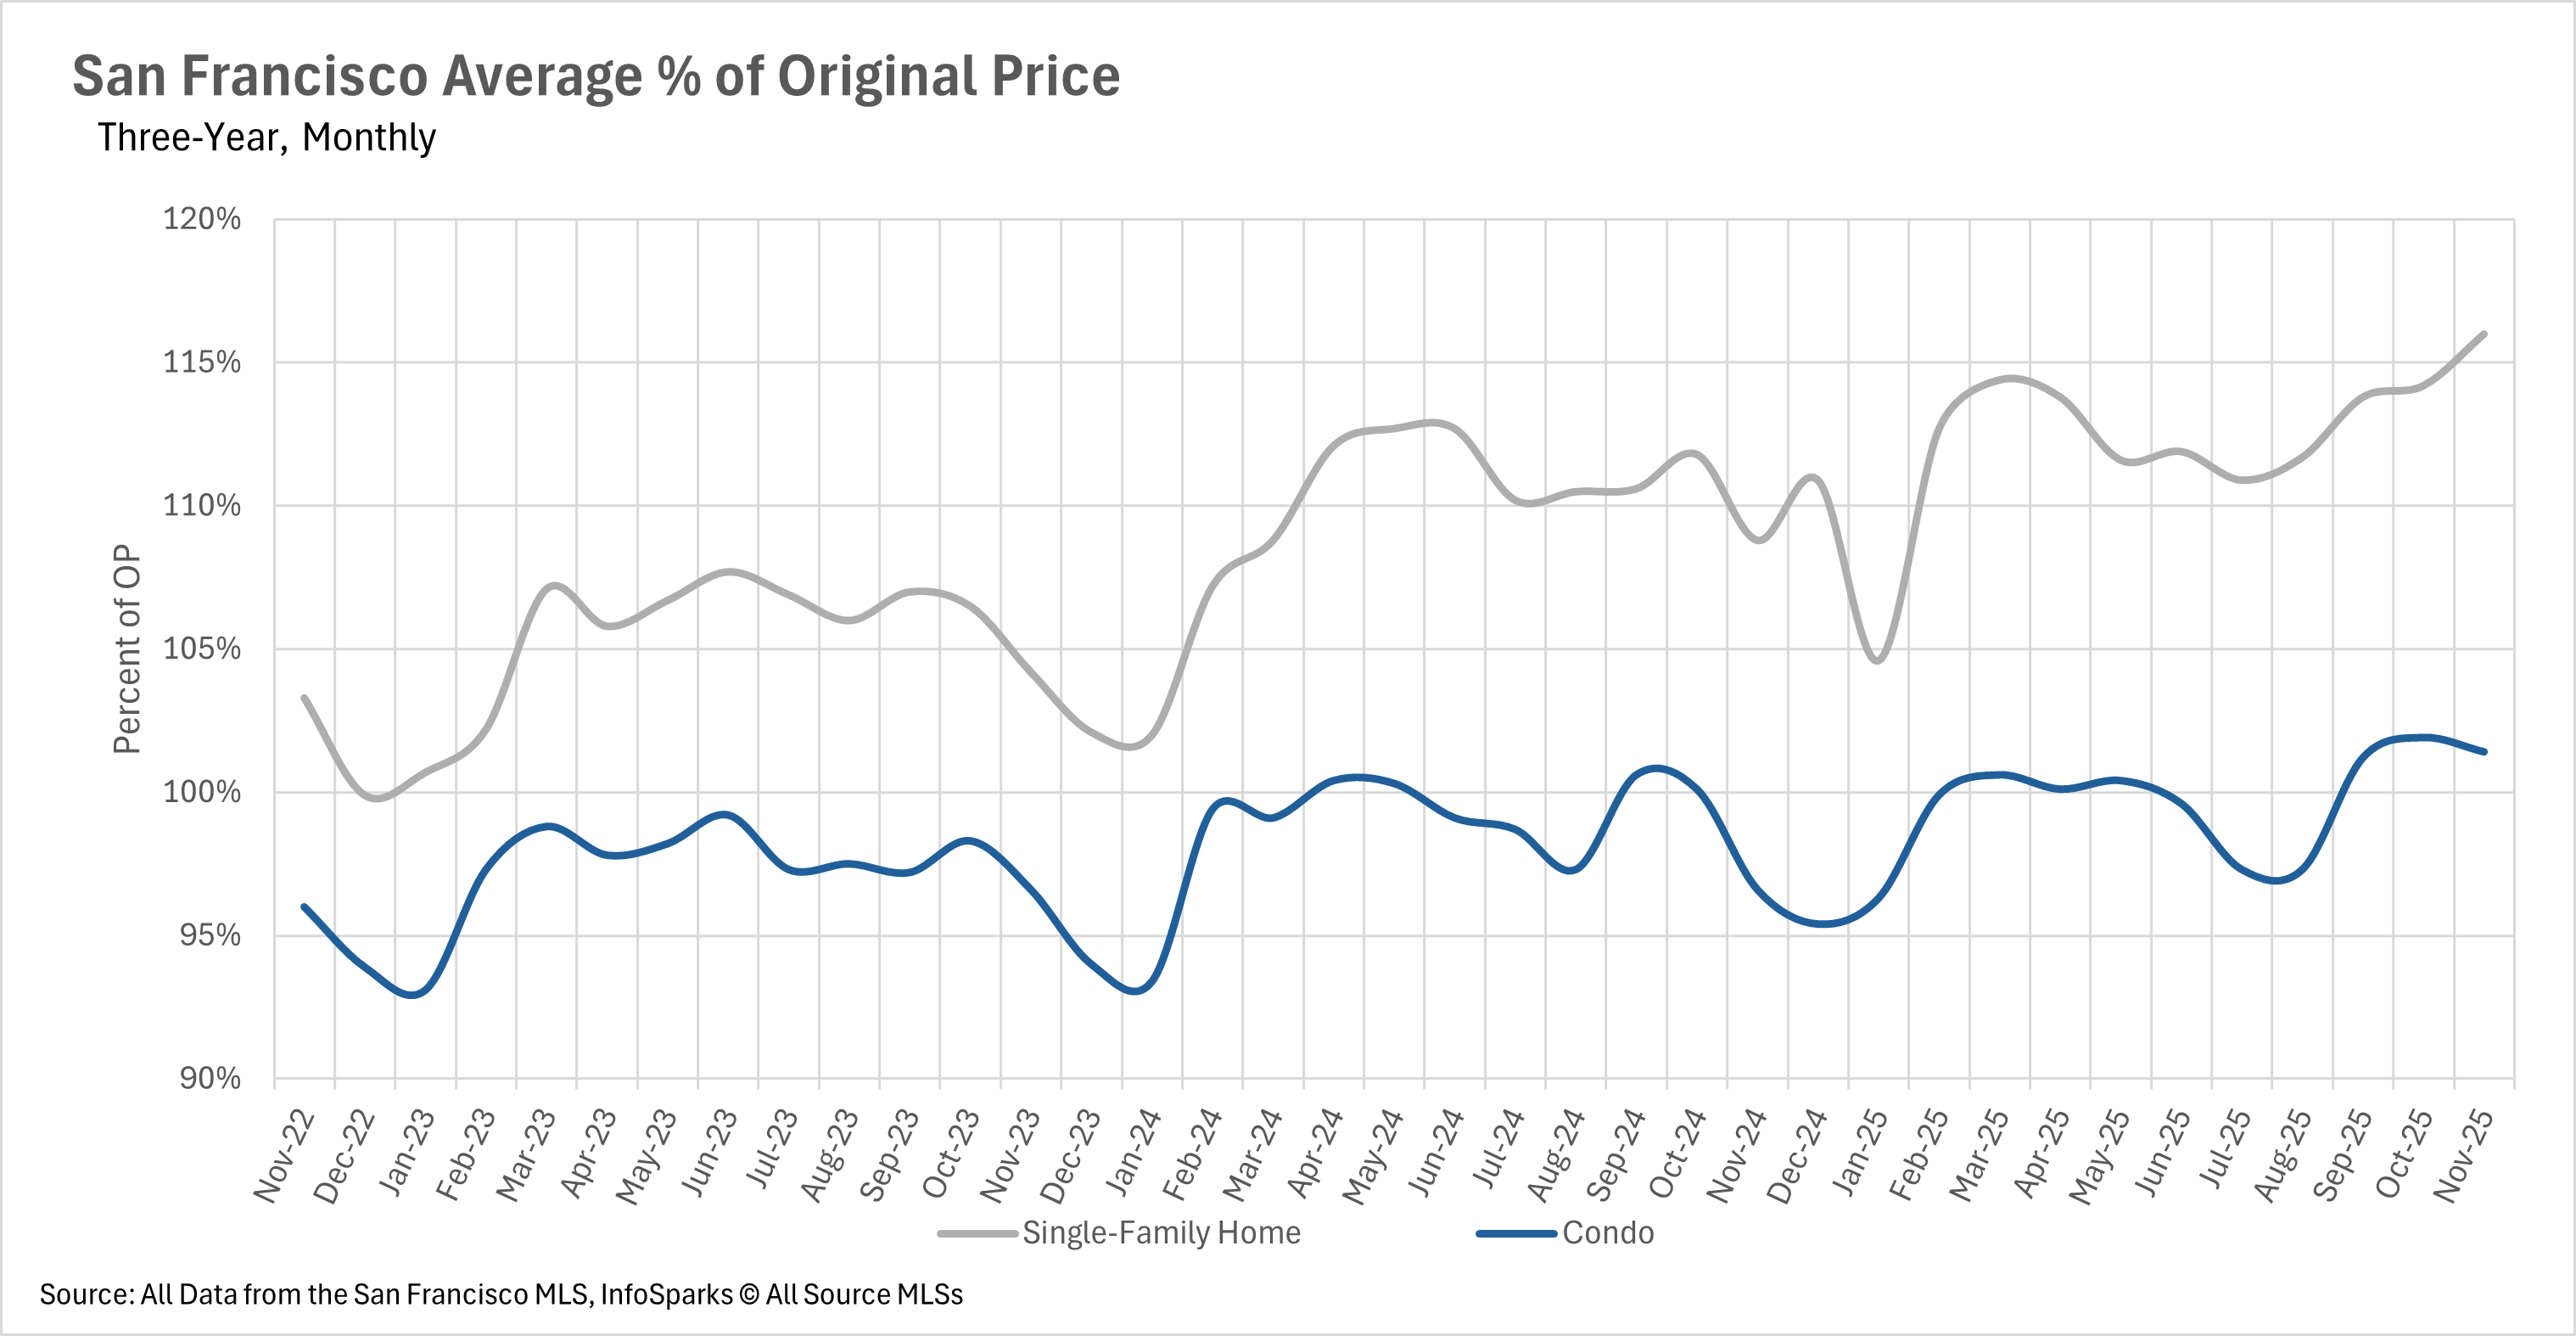
In the month of November, we saw median sale prices soar on a year-over-year basis. Typically, we see a drastic decline in median sale price from October to November, but we didn’t see that this year. The decrease in median sale price was very modest, which resulted in the median sale price of single-family homes increasing by 15.82%, and the median sale price of condos increasing by 9.36% year-over-year. Additionally, single-family homes are selling for the highest premium that we’ve seen in the past three years, with the average home selling for 16% over the original asking price!
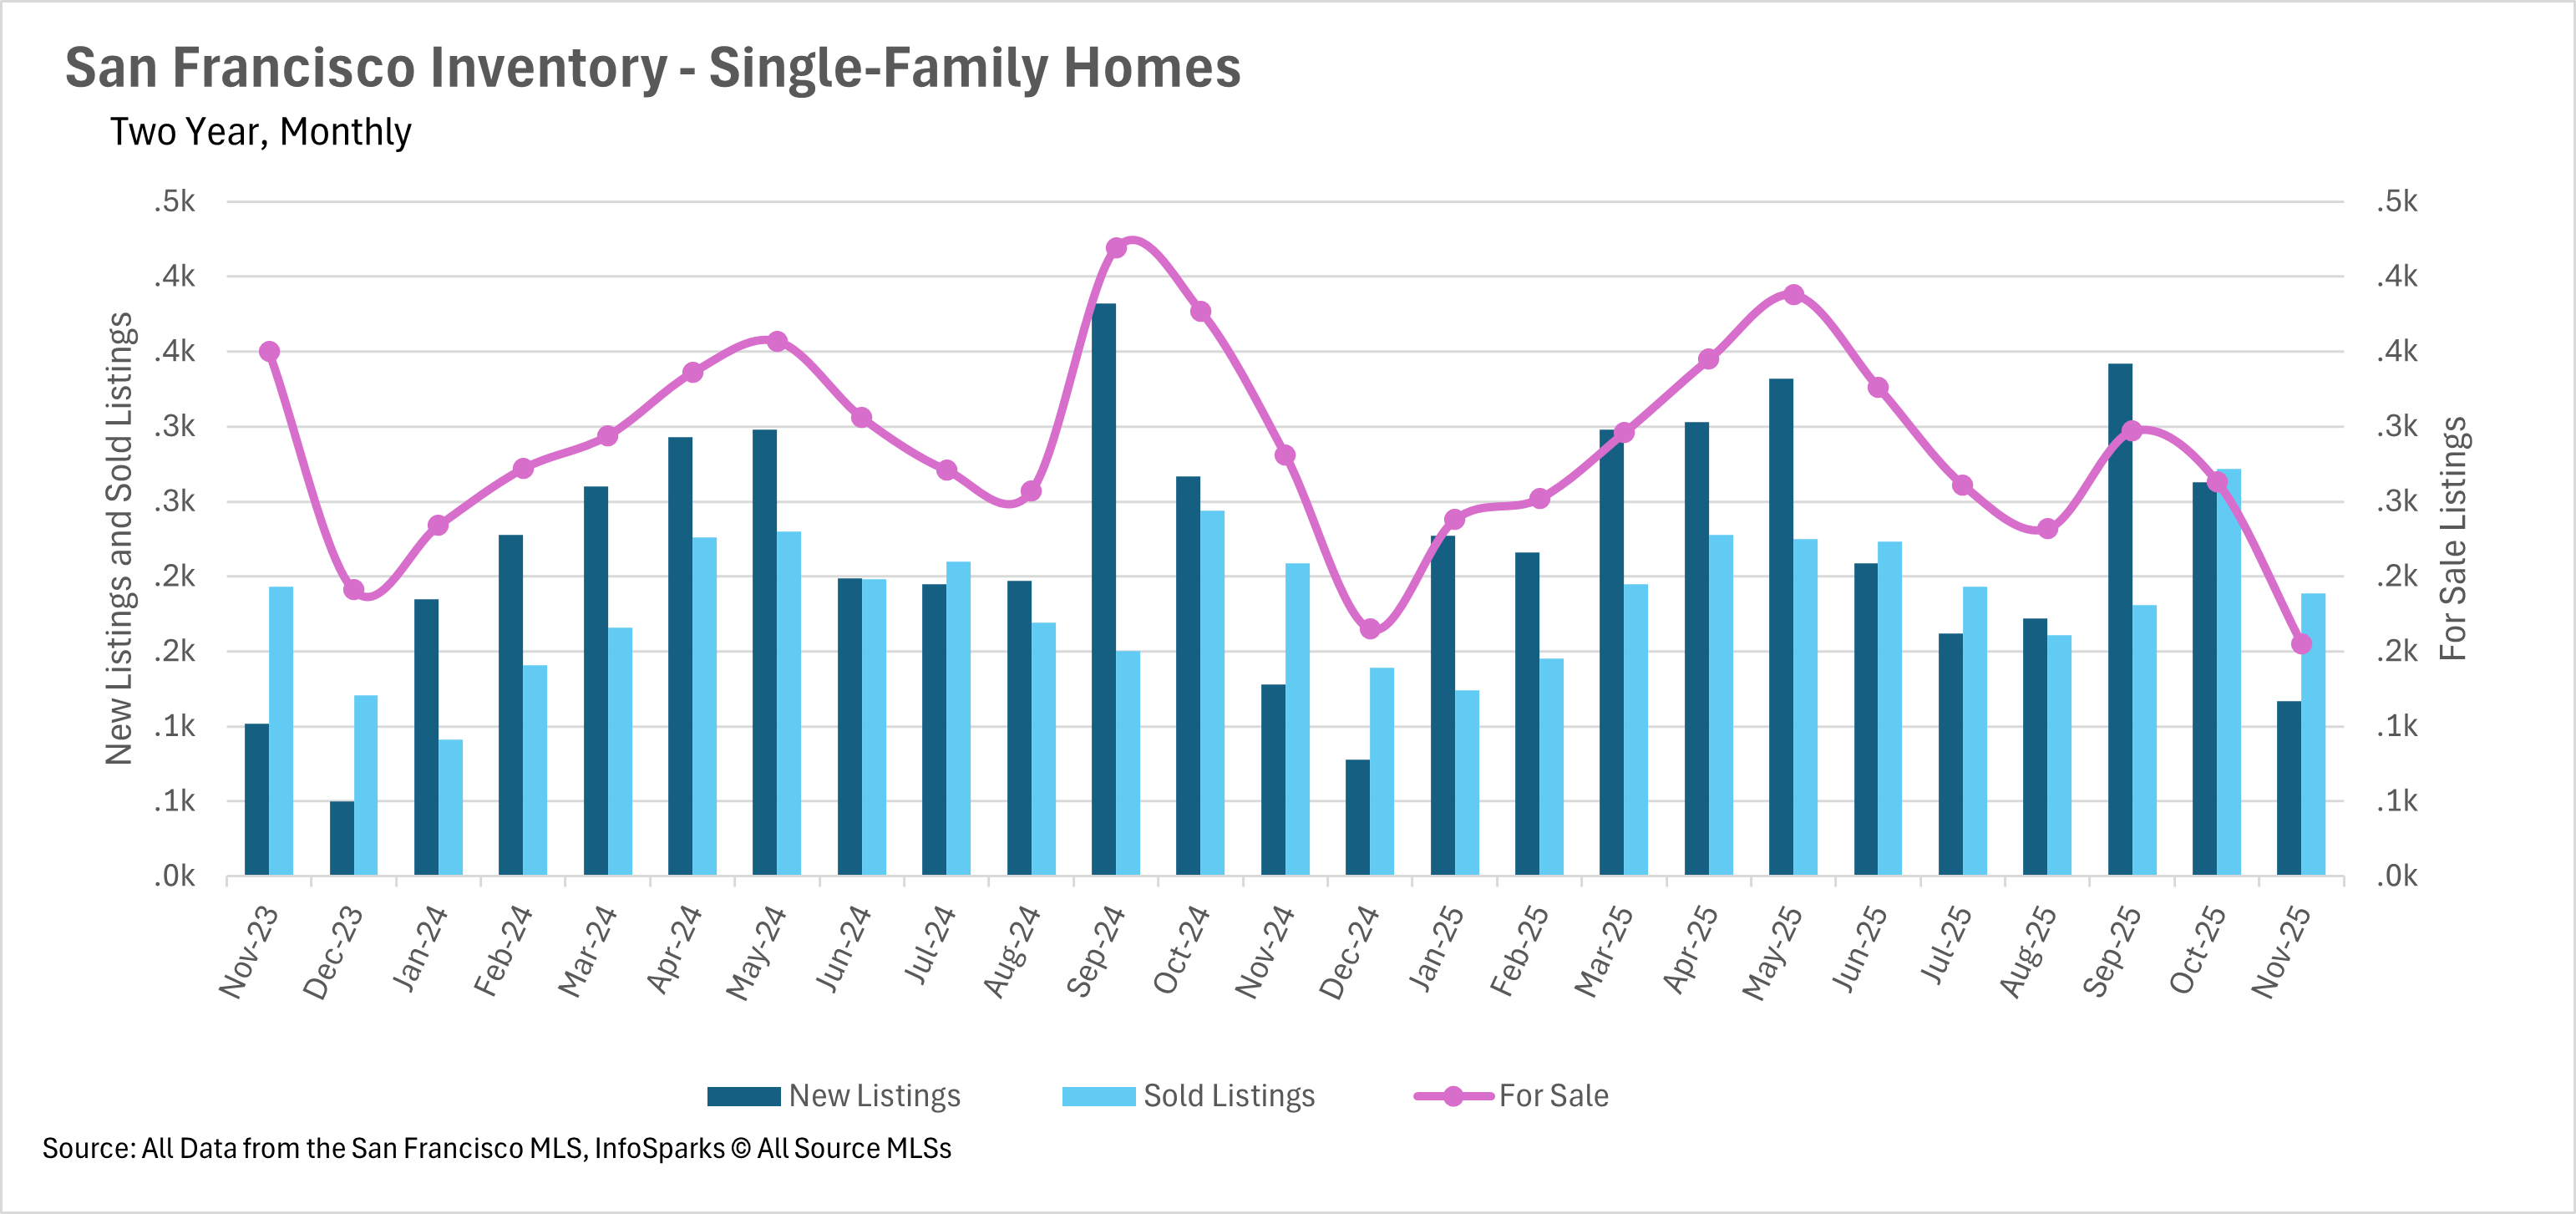
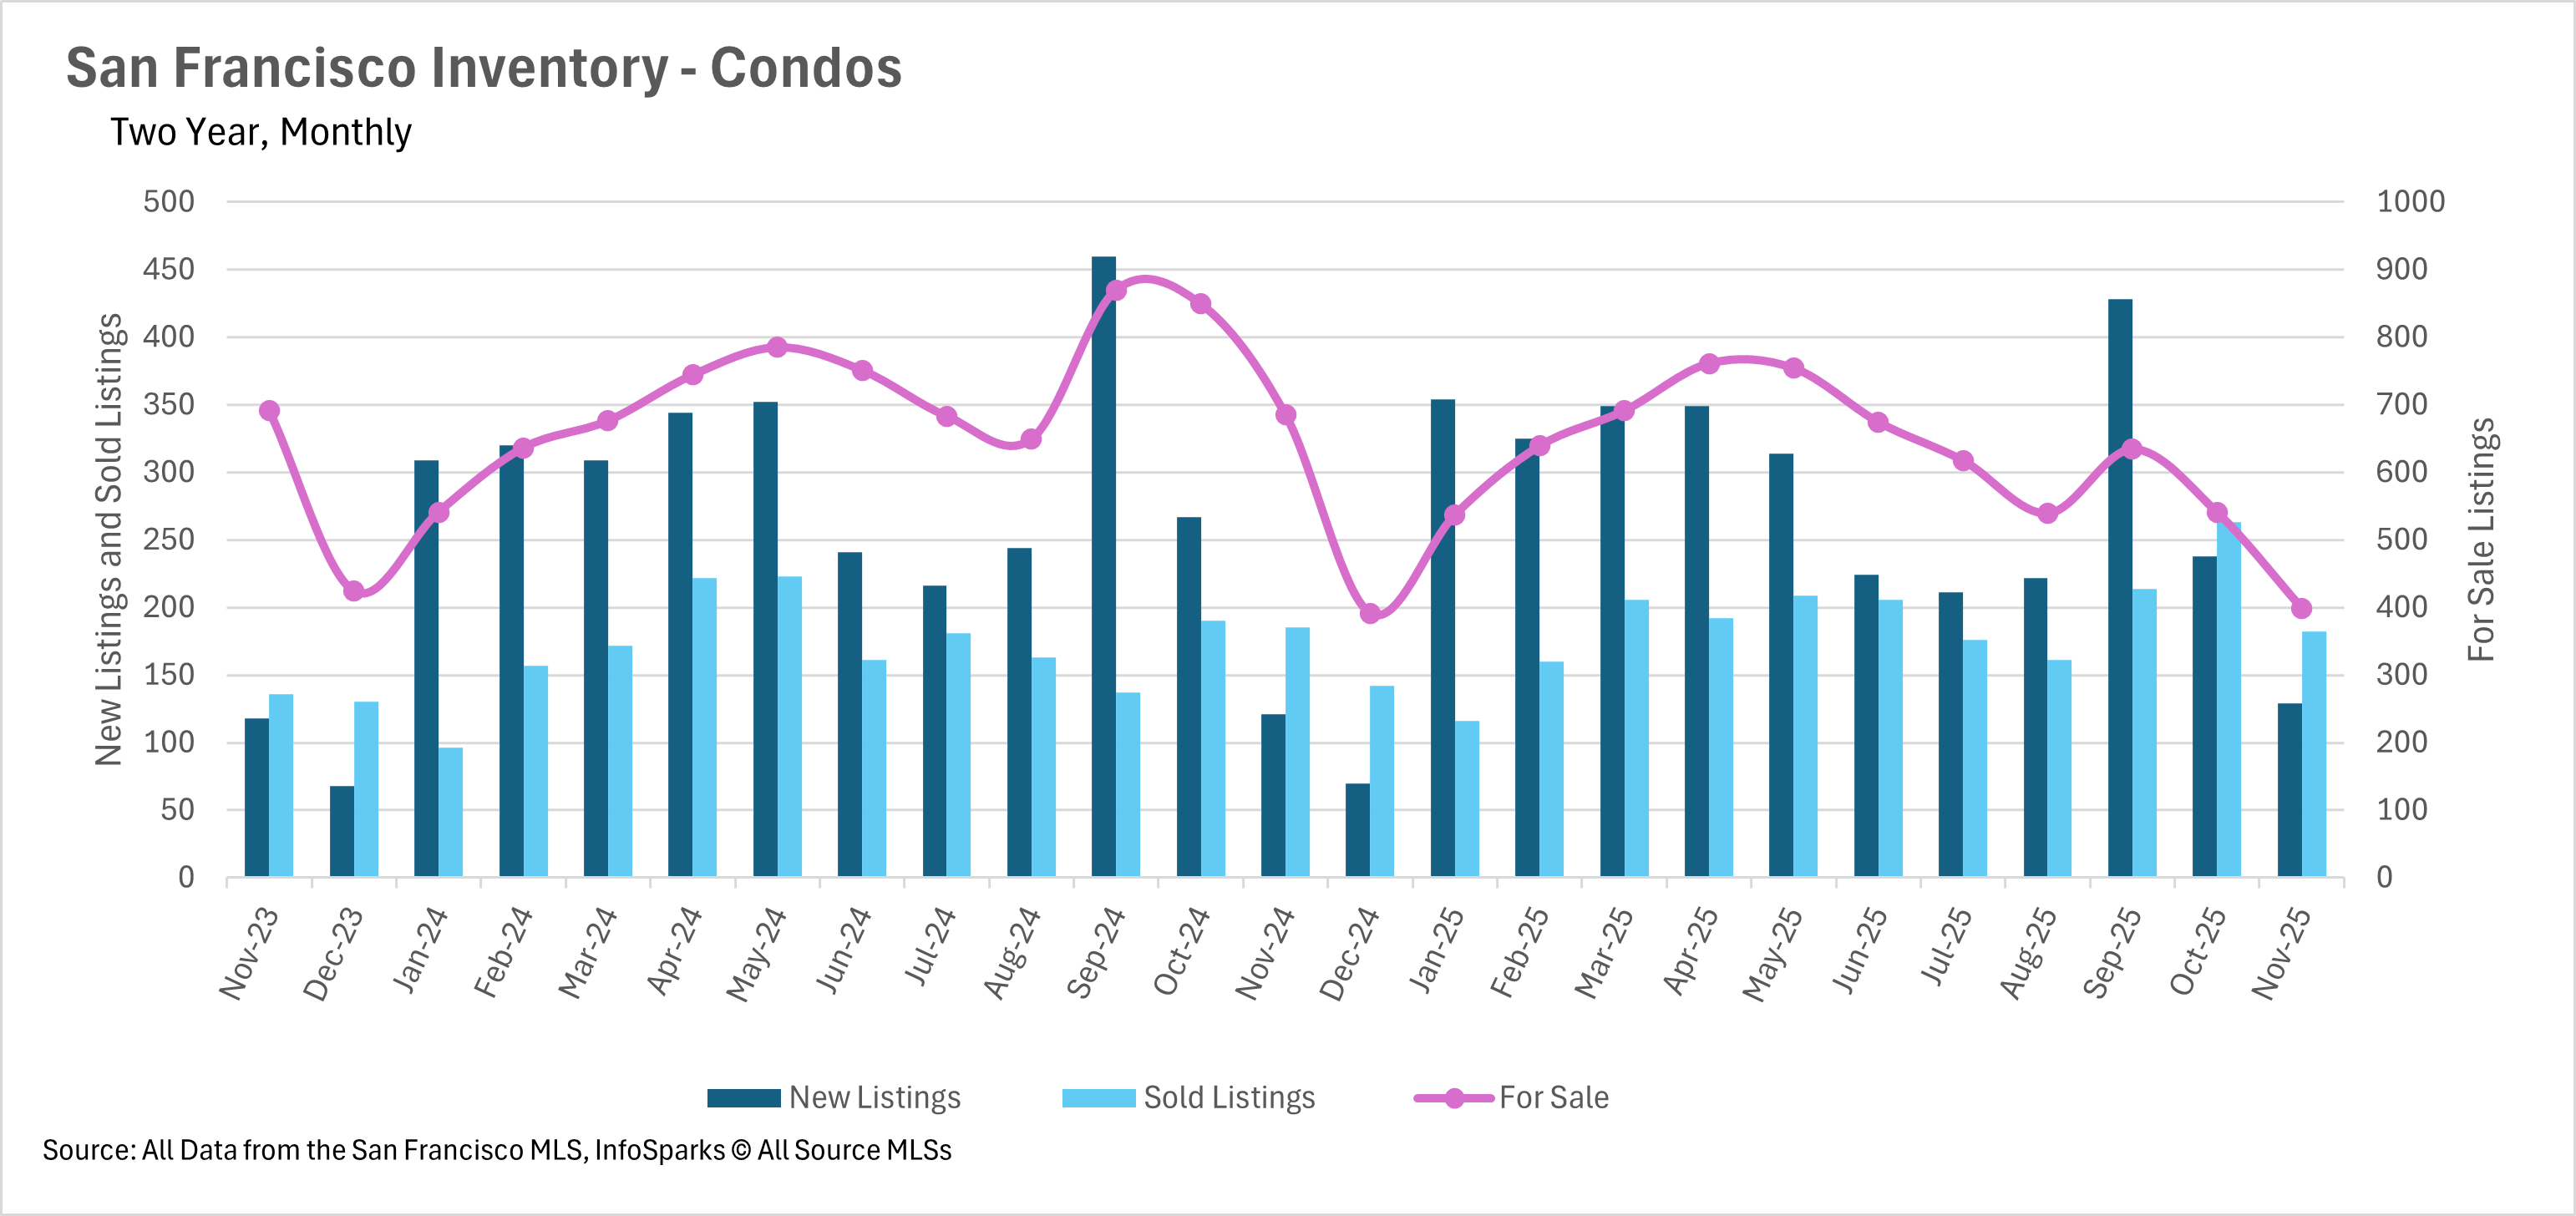
Inventory levels have reached the lowest levels we’ve seen in the past three years, which is concerning, as we typically see further declines in inventory in December. On a year-over-year basis, single-family home inventories declined by 44.84%, and condo inventories declined by 41.90%. Unfortunately, there is no end in sight for the inventory glut that we’ve been experiencing over the past couple of years. If there are further rate cuts in the future, that may incentivize people to move, which would give the market some much-needed fresh inventory!
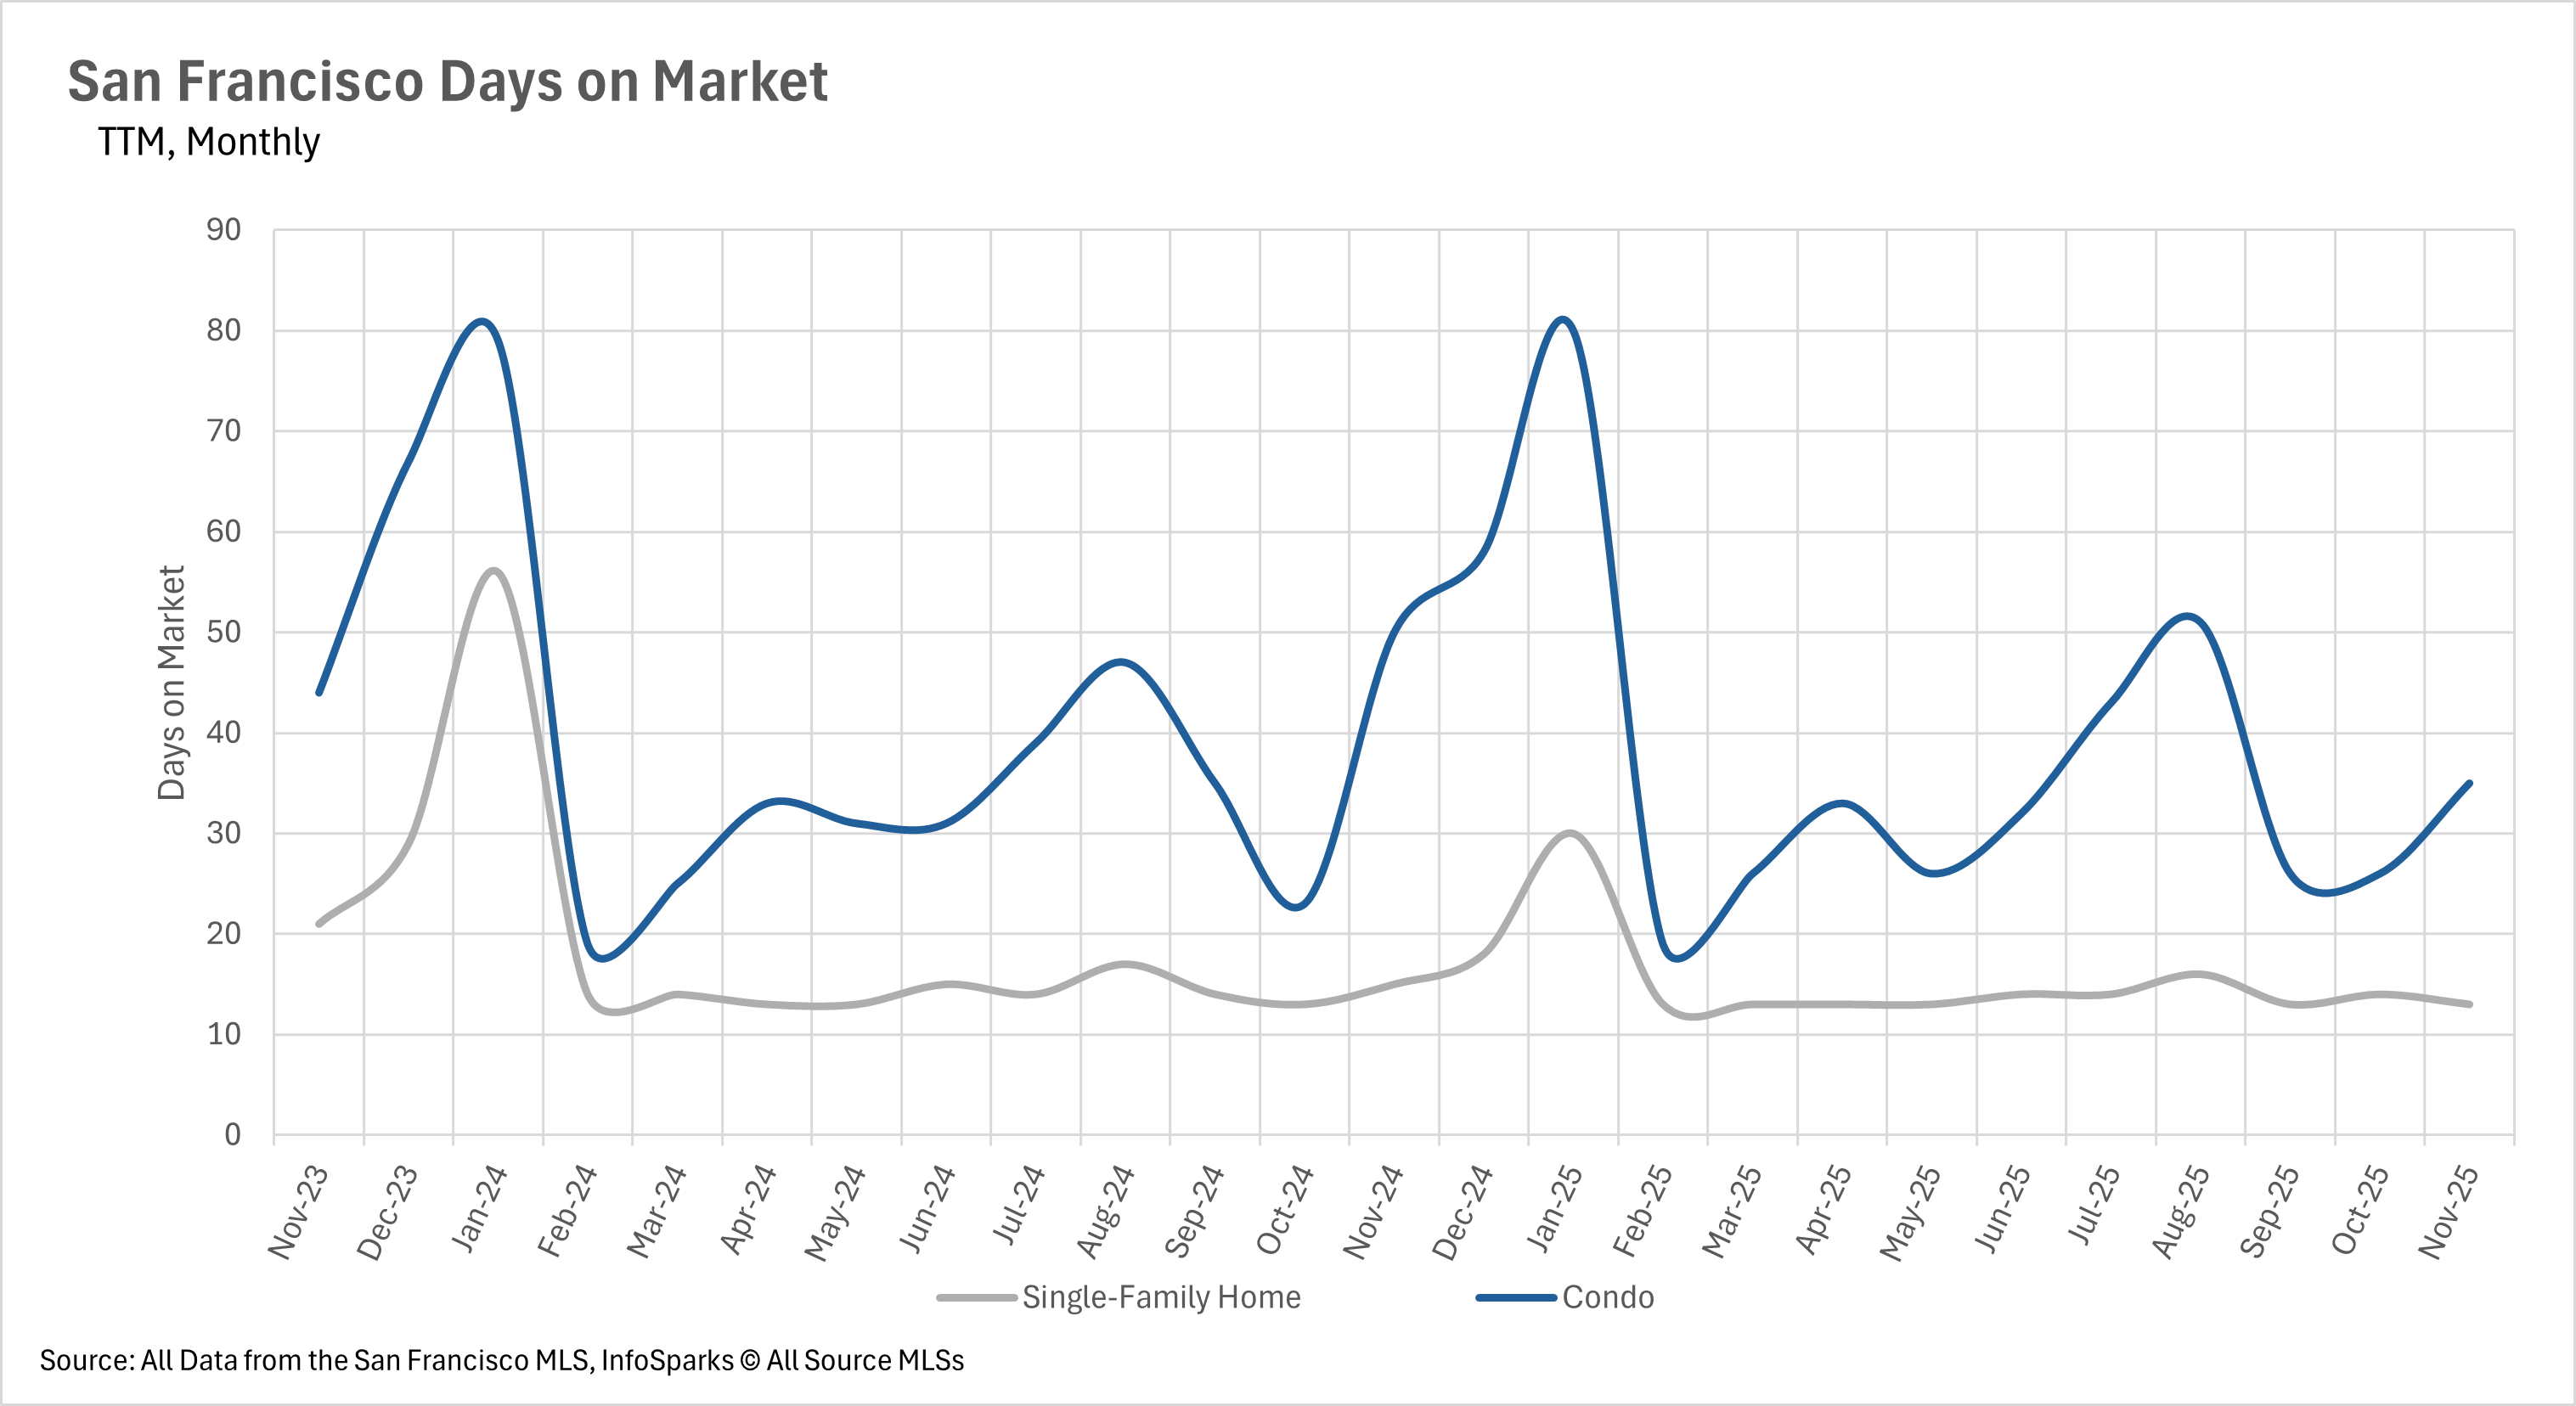
Since inventories are declining steadily over time, listings are spending less and less time on the market. The average single-family home in San Francisco is selling in just 13 days. This represents a 13.33% year-over-year decrease. Likewise, condos are moving incredibly quickly as well, with the average condo selling in just 35 days, representing a 30% year-over-year decline. Unfortunately, this means that buyers don’t have time to ponder an offer before they make it, and this issue won’t resolve itself until the market is able to absorb some inventory!
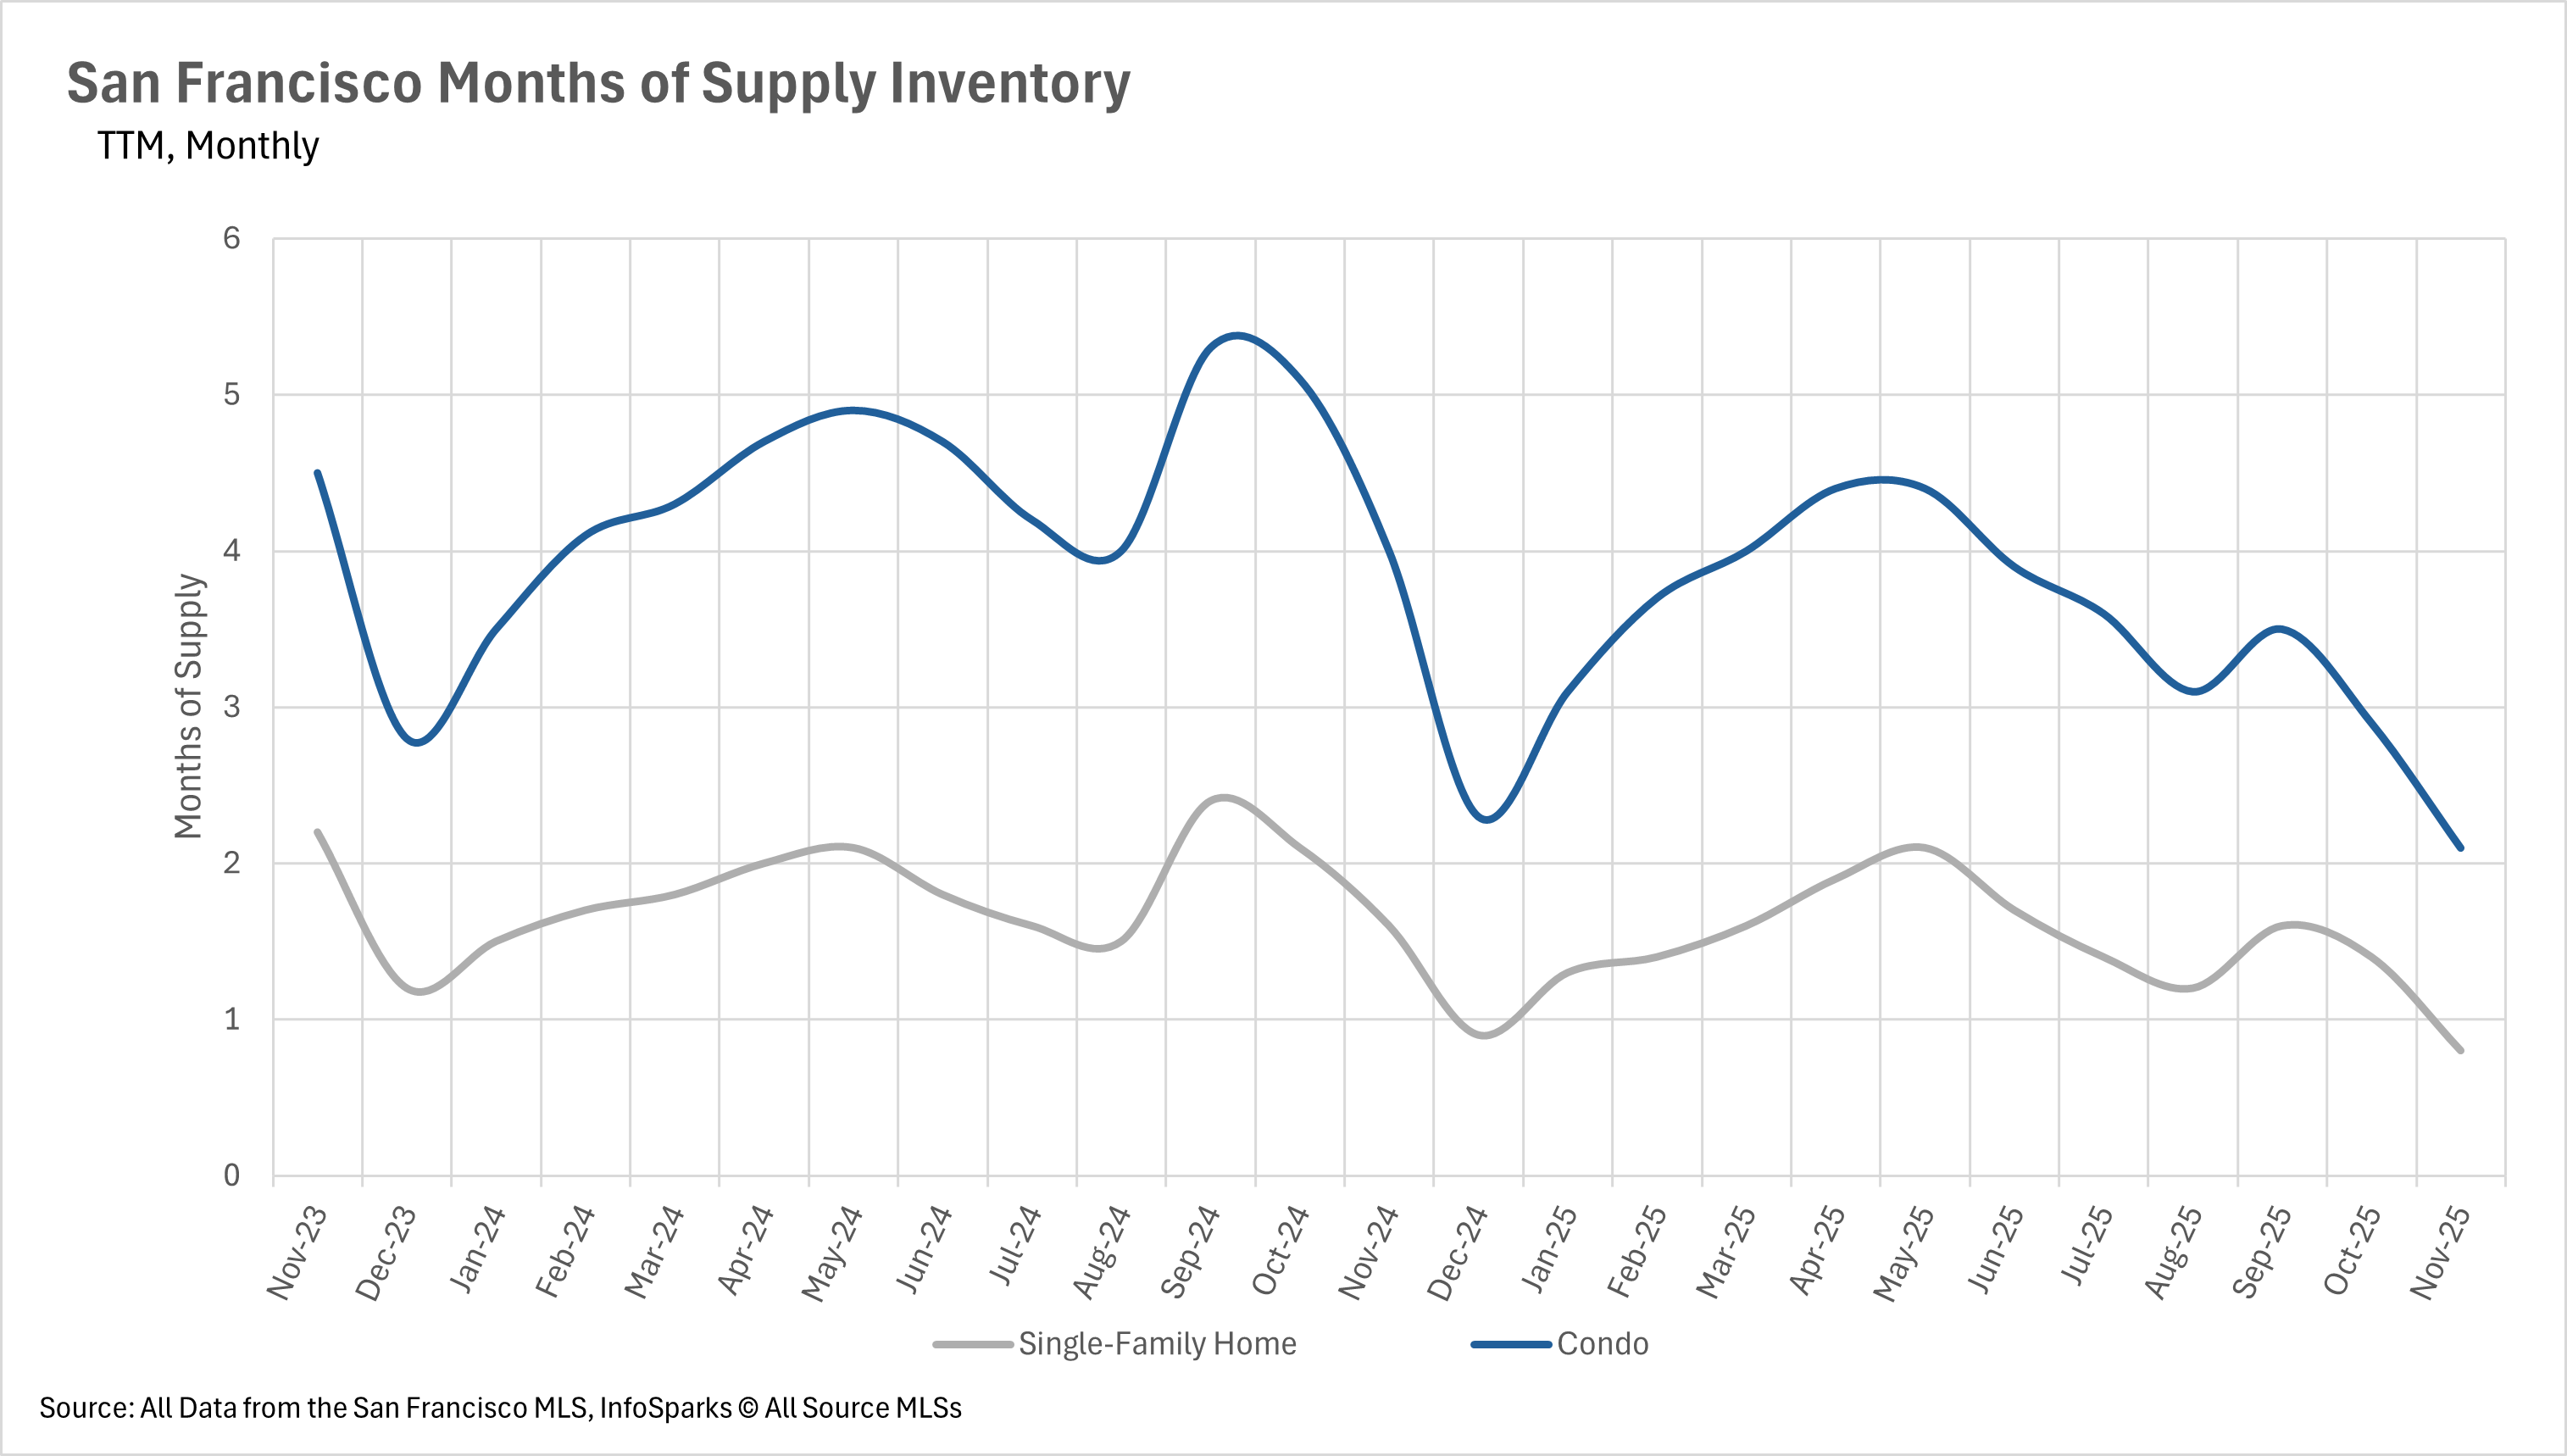
When determining whether a market is a buyers’ market or a sellers’ market, we look to the Months of Supply Inventory (MSI) metric. The state of California has historically averaged around three months of MSI, so any area with at or around three months of MSI is considered a balanced market. Any market that has lower than three months of MSI is considered a sellers’ market, whereas markets with more than three months of MSI are considered buyers’ markets.
With just 0.8 months of single-family home inventory and 2.1 months of condo inventory on the market, the entire San Francisco market has become a deeply entrenched seller's market. It does not appear that this will change any time soon!
If you’re tracking the market, these next reads will help you go one level deeper—whether you’re planning a move, sizing up timing, or just watching your neighborhood.
San Francisco Housing Market Update: Falling Rates & SF’s Competitive Market (Nov 2025)
San Francisco Real Estate in July 2025: A Tale of Two Markets
Bernal Heights Market Update: November 2025 Single-Family Home Stats
If you’d like comps and buyer-demand trends for your exact block (not just the neighborhood averages), request a quick snapshot here:
Stay up to date on the latest real estate trends.

July 17, 2026
Explore Life Near the Panhandle at 536 Broderick

July 14, 2026
June 2026 Pacifica housing market data, including median sale price, days on market, price per square foot, and sale-to-list price trends.

July 9, 2026
What Bernal Buyers and Sellers Should Know

July 2, 2026
Discovering the History and Charm of Precita Park in Bernal Heights
You’ve got questions and we can’t wait to answer them.