San Francisco Housing Market Update: Falling Rates & SF’s Competitive Market
November 19, 2025

November 19, 2025
Note: You can find the charts & graphs for the Big Story at the end of the following section.
*National Association of REALTORS® data is released two months behind, so we estimate the most recent month's data when possible and appropriate.
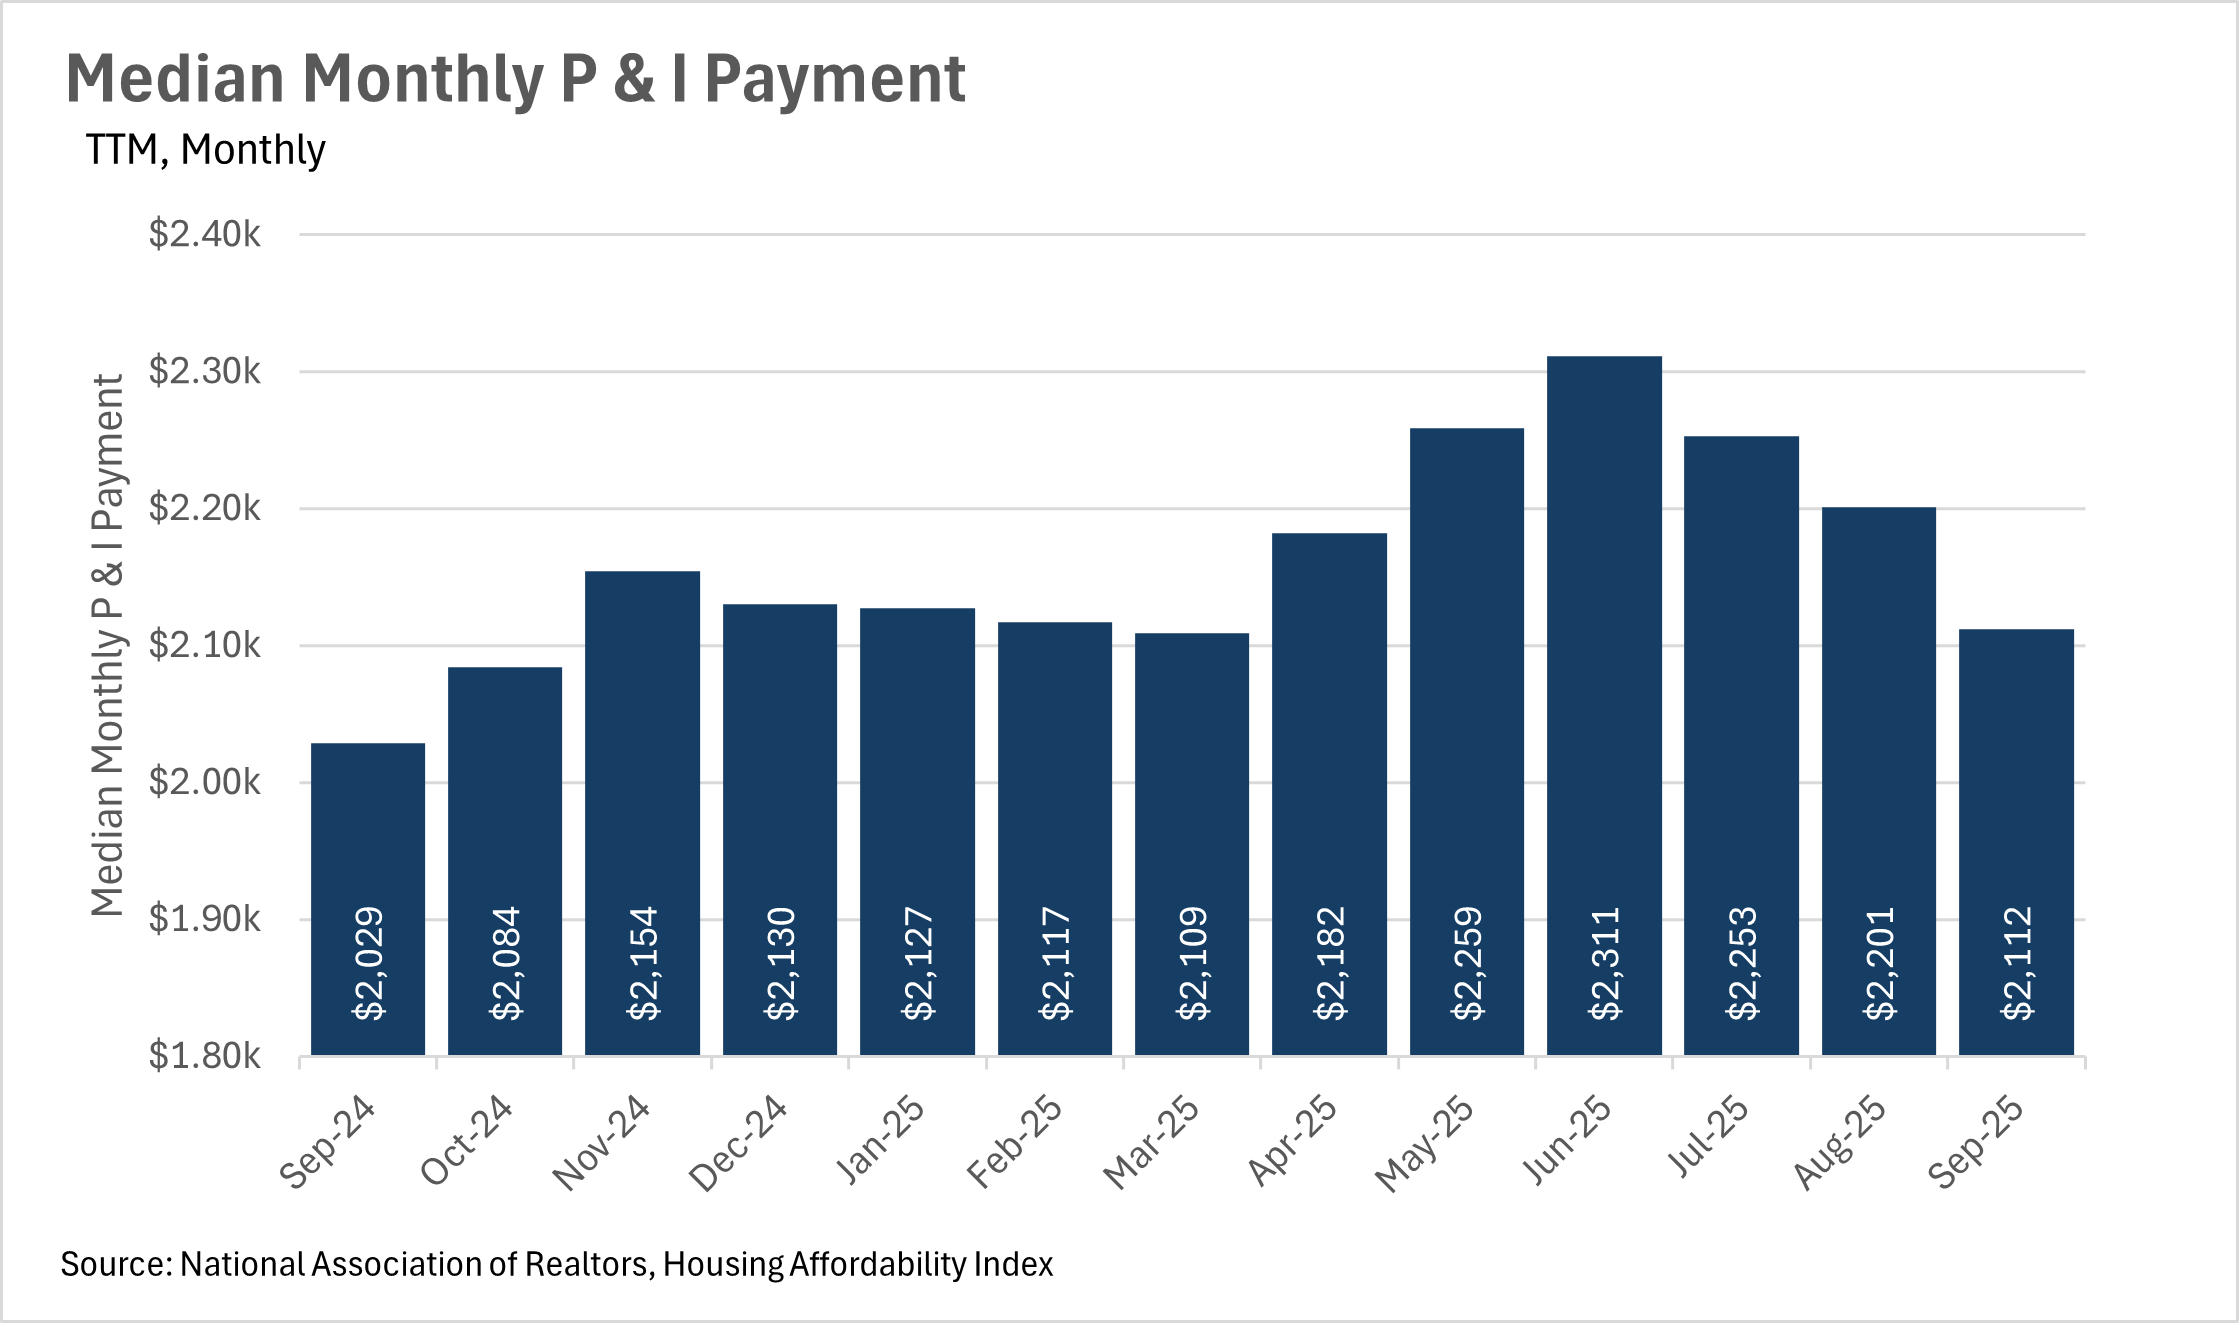
Median monthly P&I payments are on the decline, as one might expect when interest rates are falling. This, of course, is great for new buyers that are in the market for a home. If we see an influx of new buyers, there is the possibility that we might see a less stagnant market when the spring time rush comes in early 2026. Unfortunately though, interest rates are still much too high for many people who locked in rates in the 2-3% range to justify moving to a new home and taking on a considerably higher mortgage payment each month. We likely won’t see these homes/homeowners enter the market until rates come down substantially more than they already have.
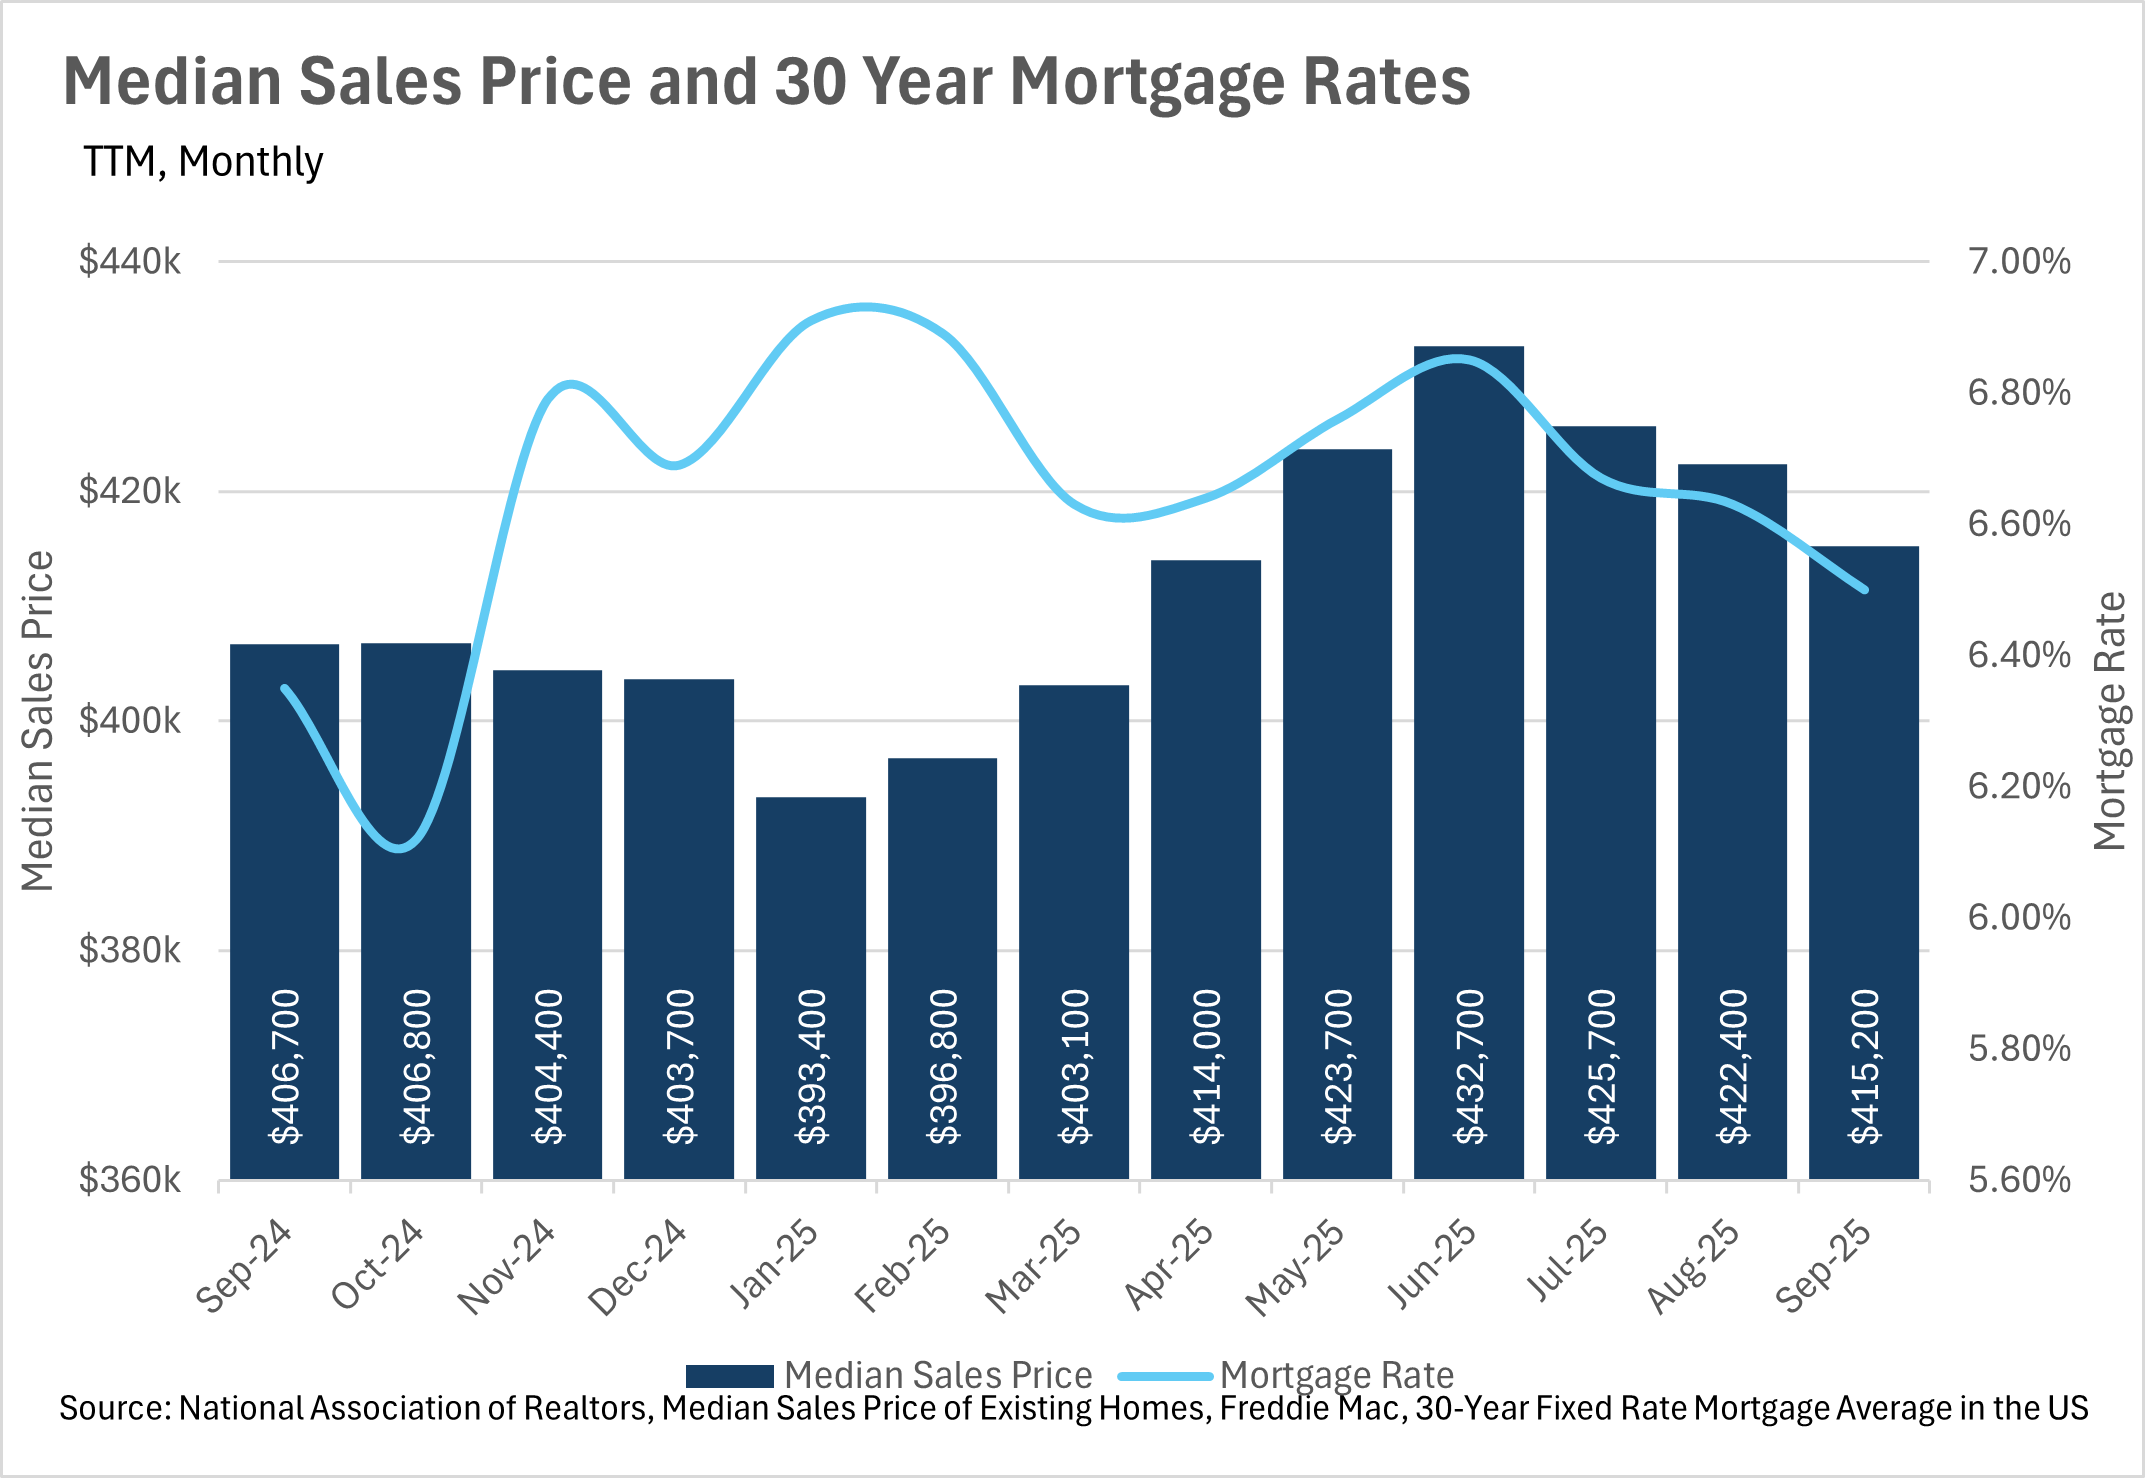
In the Fed’s October FOMC meeting, they decided to cut the federal funds rate by another quarter point, making the overnight interest rate range between 3.75% and 4.00%. This led mortgage rates to fall in unison, which is great news for prospective buyers and recent buyers that made the bet that they would be able to refinance at a lower rate sooner rather than later. It’ll be important to look at the economic data that’s released once the government shutdown ends, as this data is what the Fed bases their interest rate decisions on. Once we receive some more clarity regarding economic data, then we’ll have a better idea of whether or not to expect a rate cut in December.
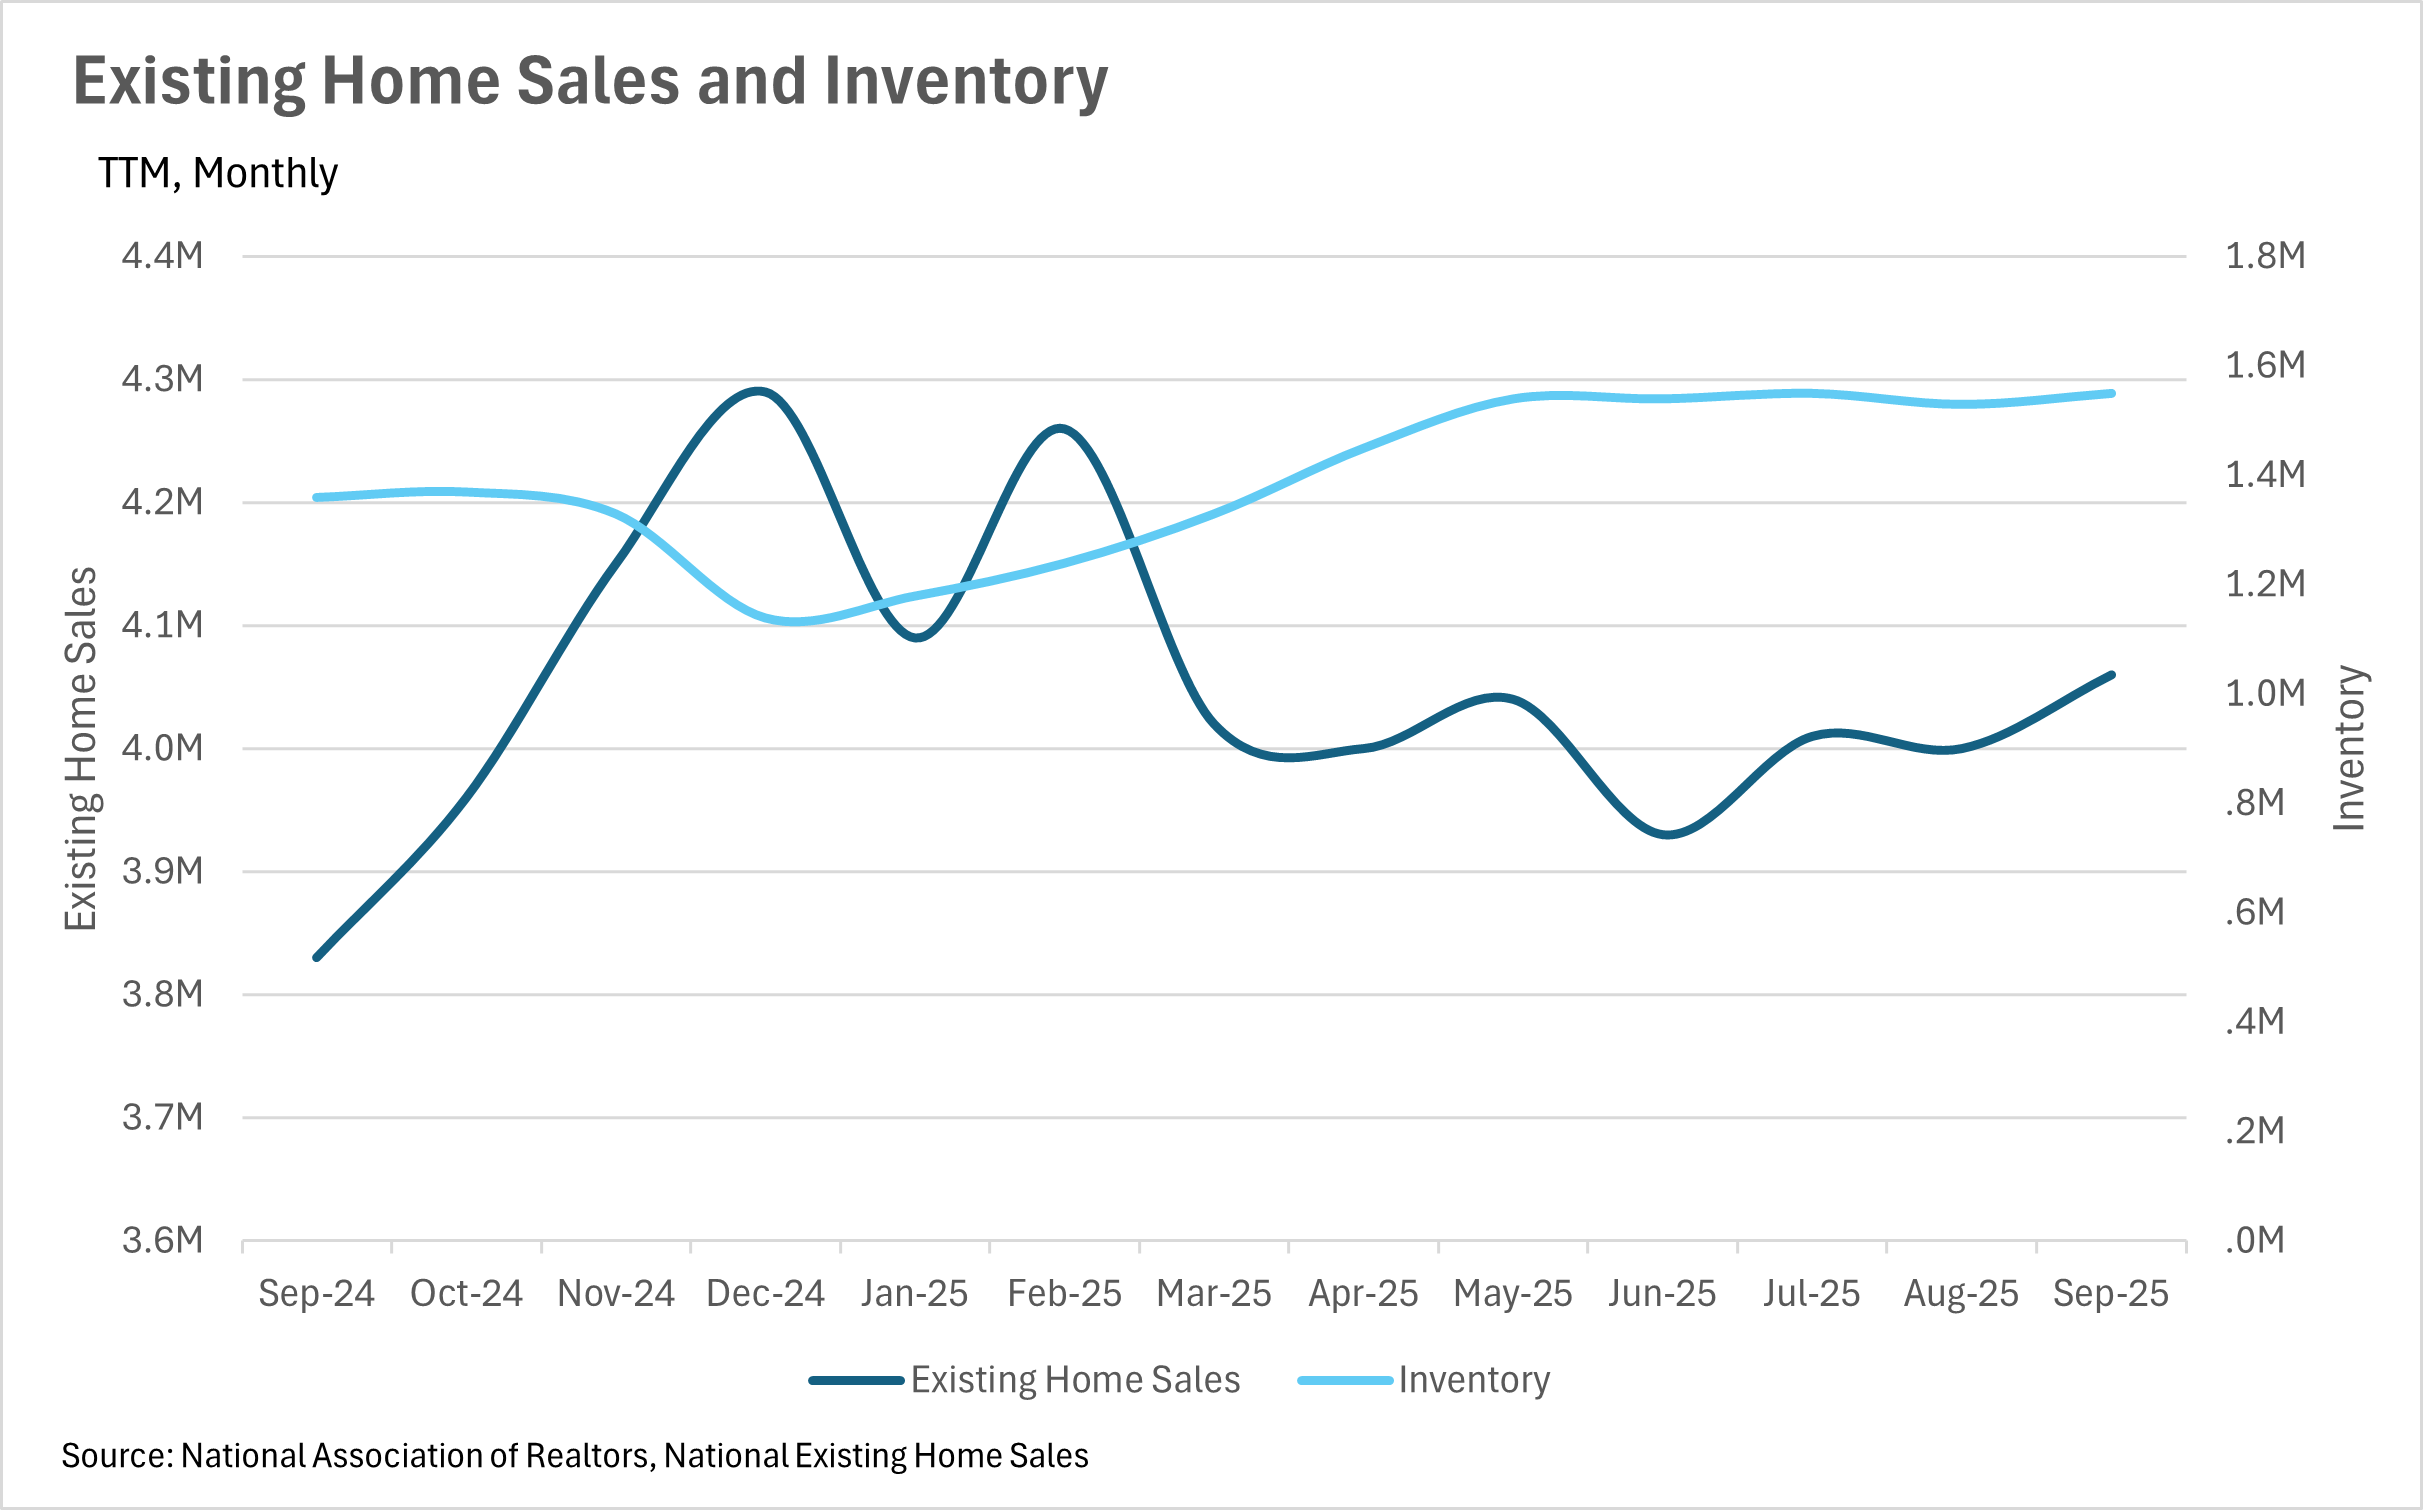
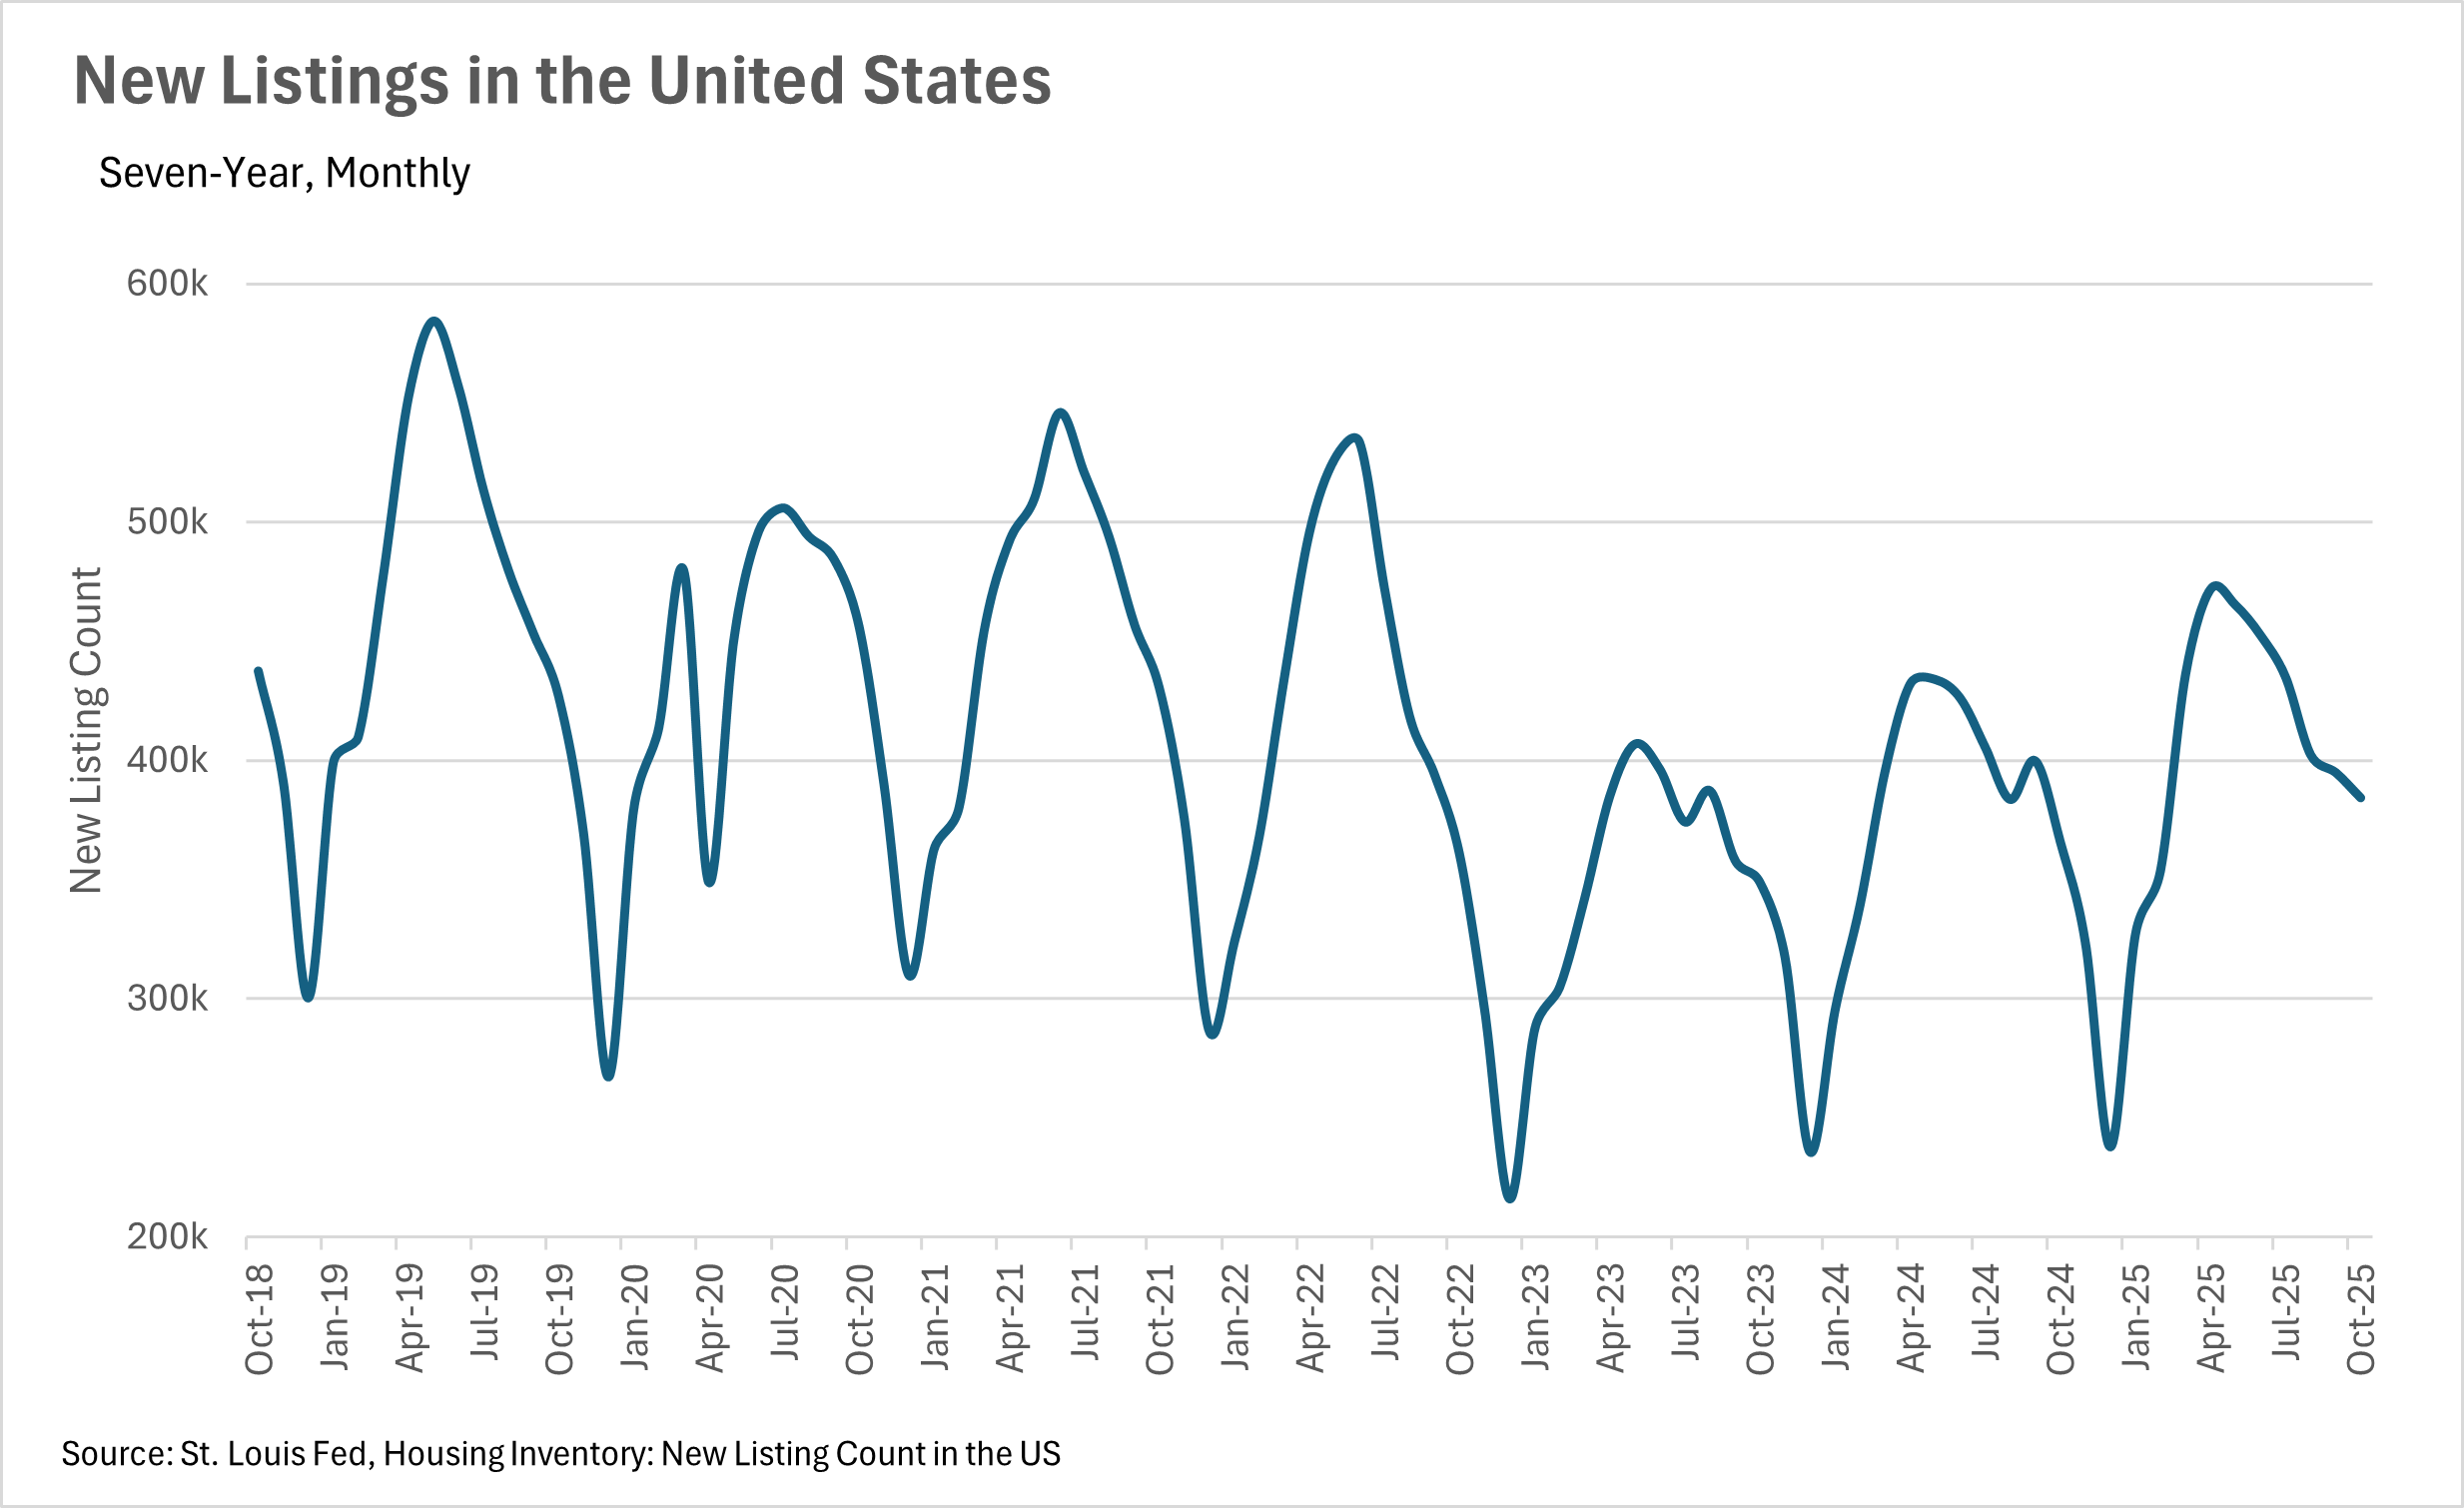
Inventories have remained incredibly strong throughout this year, as inventory growth has consistently outstripped existing home sale growth. This past month, we saw inventories grow by 13.97% on a year-over-year basis, while there were only 6.01% more existing homes sold. It’ll be interesting to see where inventories go over the course of the winter, since they usually decline meaningfully.
As we mentioned above, we might have another rate cut ahead of us, as CME’s FedWatch predicts a 65% chance of a 25 basis point rate cut in the Fed’s December meeting. However, it is worth noting that once the government shutdown-related “economic data moratorium” that we’ve been facing is lifted, this probability can shift very rapidly. If economic data is considerably better or worse than anticipated, then this may change how the Fed looks at the cutting cycle that we’re currently in. This means it’ll be very important to keep your eye out for key inflation and labor data once it eventually comes out.
Note: You can find the charts/graphs for the Local Lowdown at the end of this section.
Single-family homes are setting records?
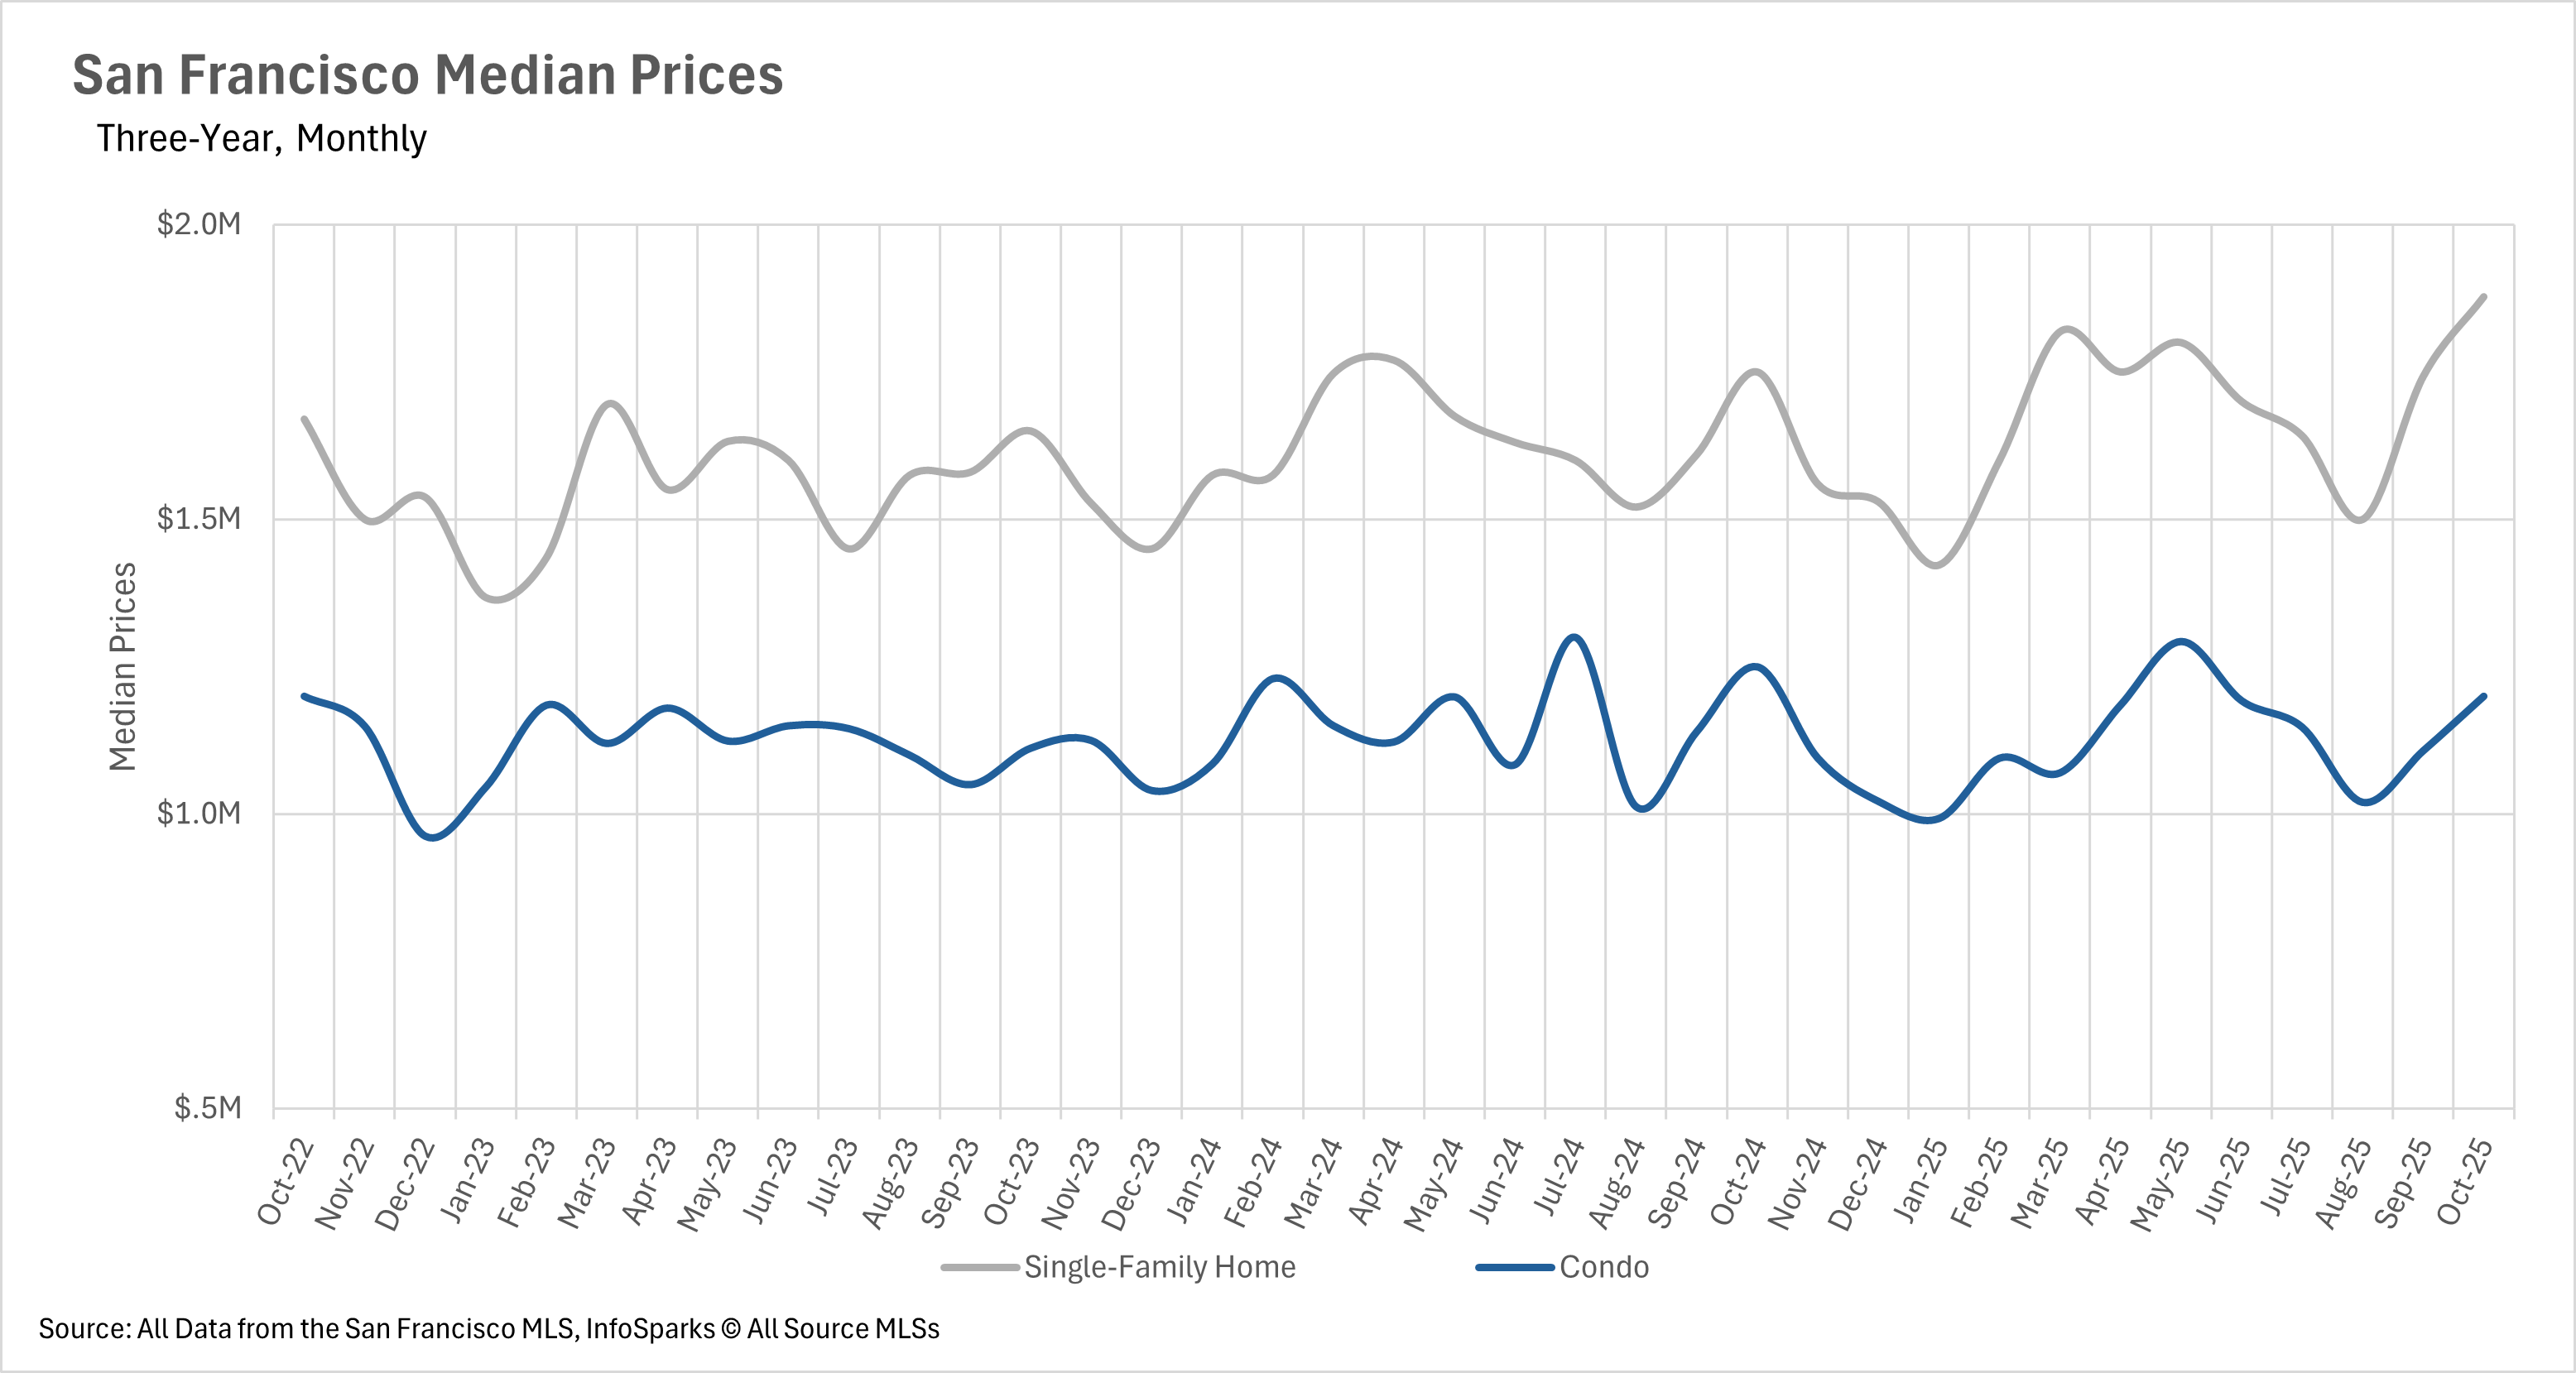
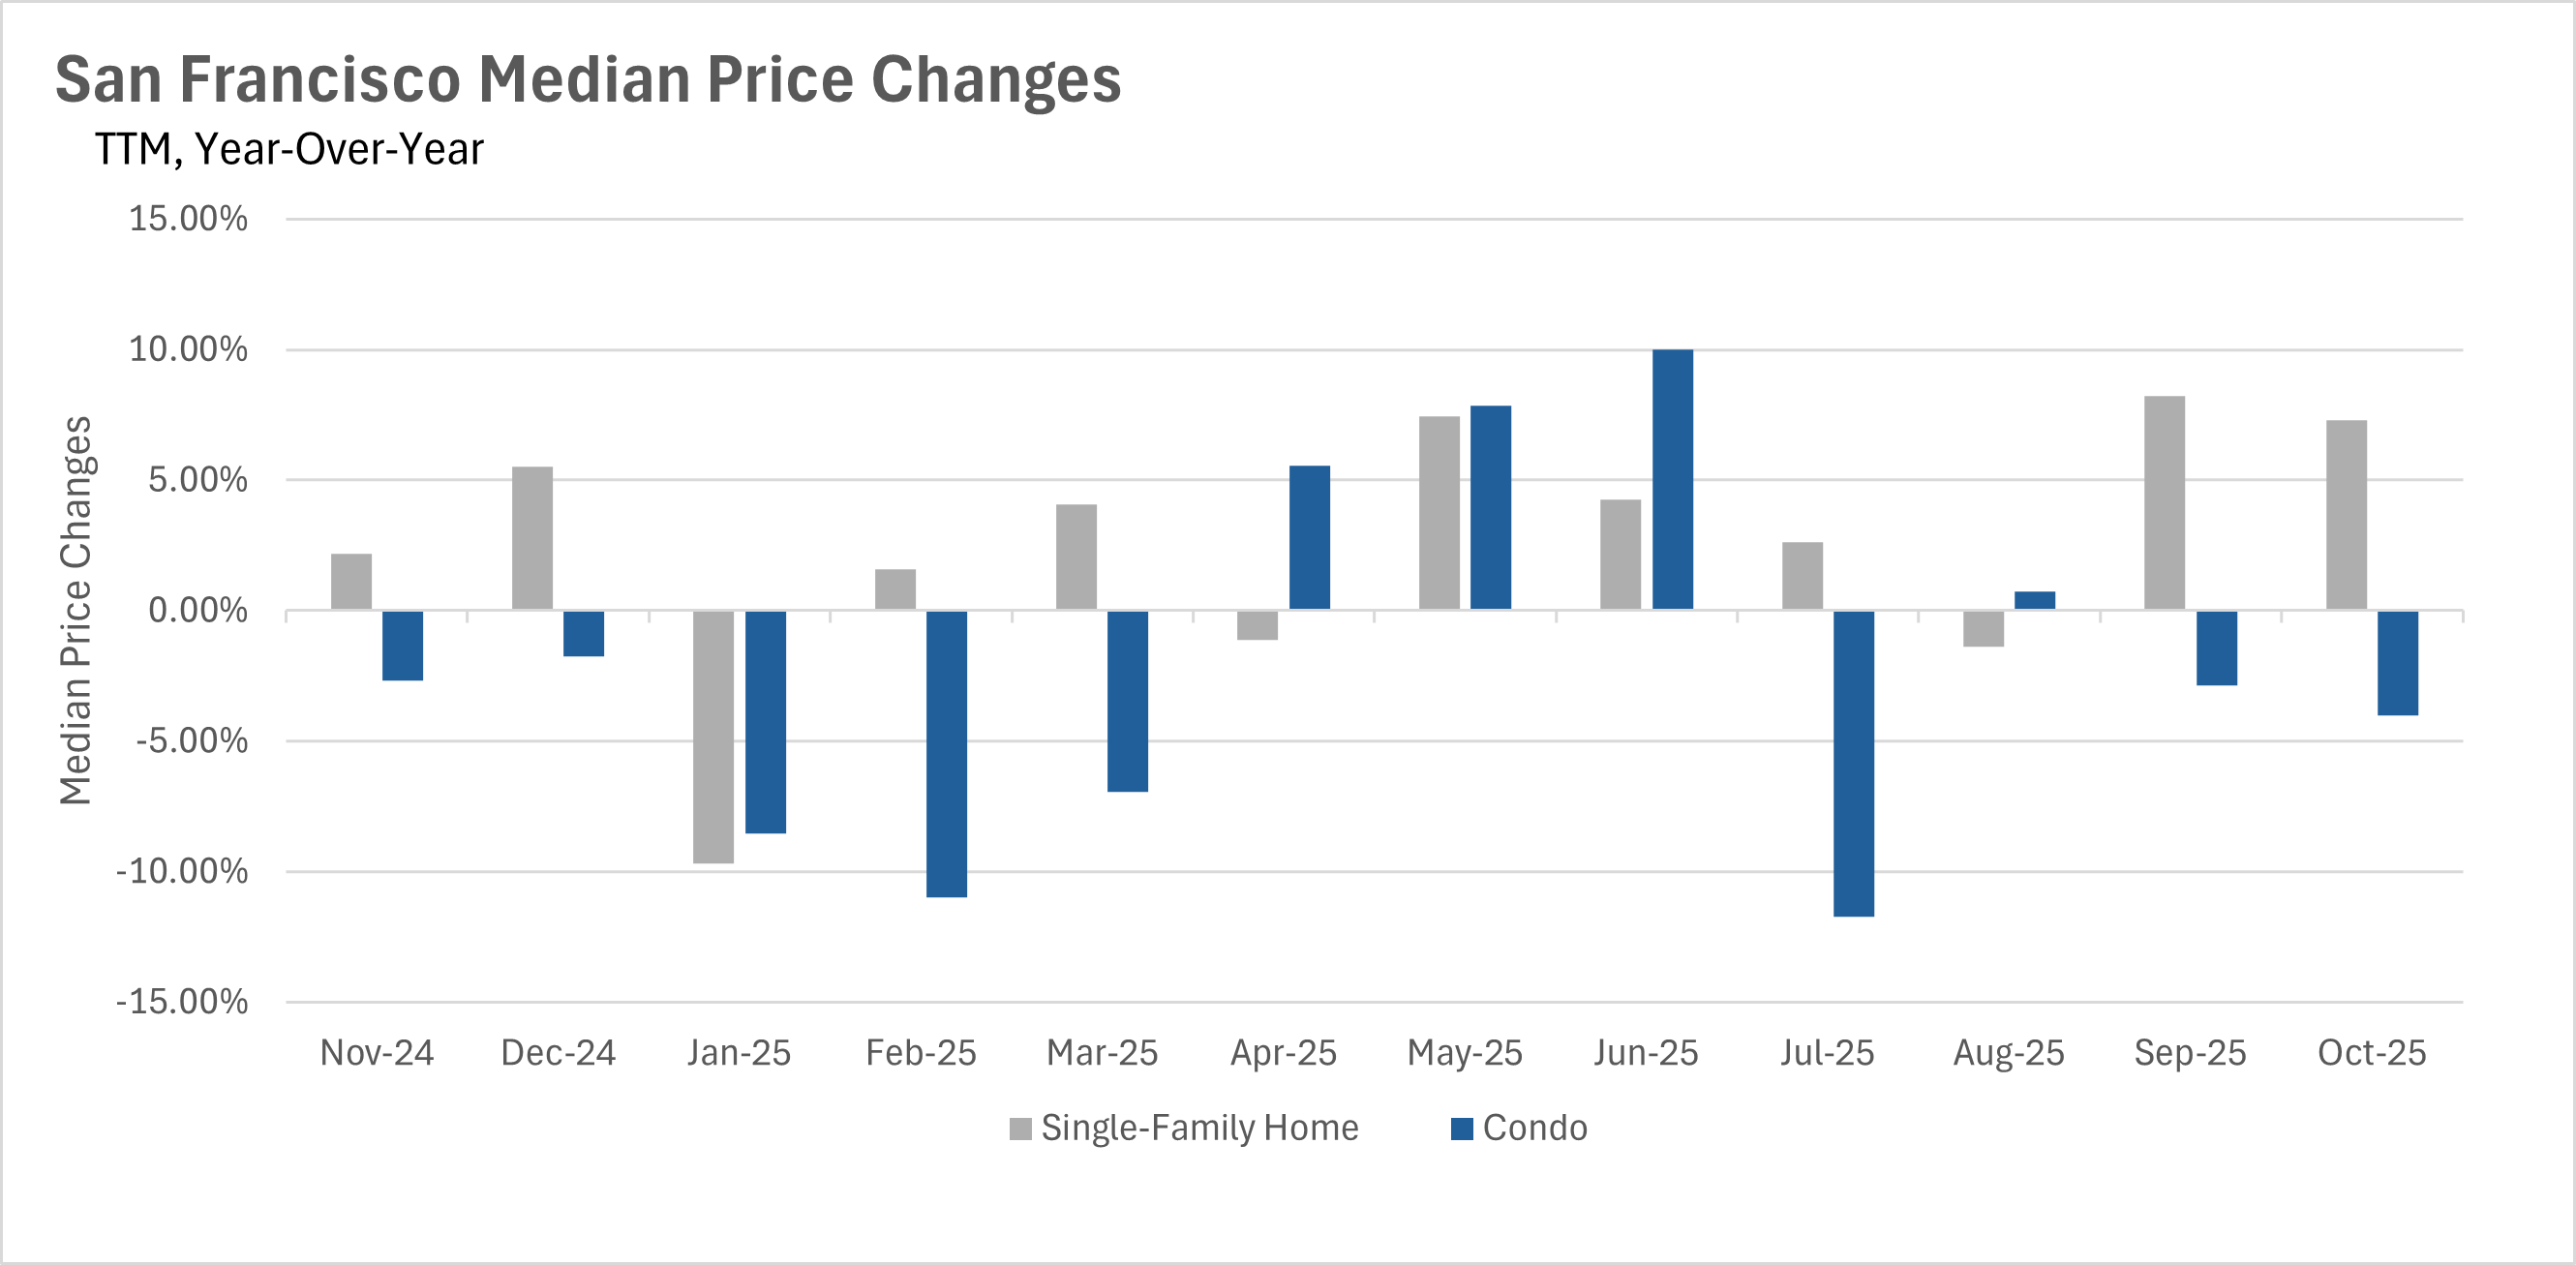
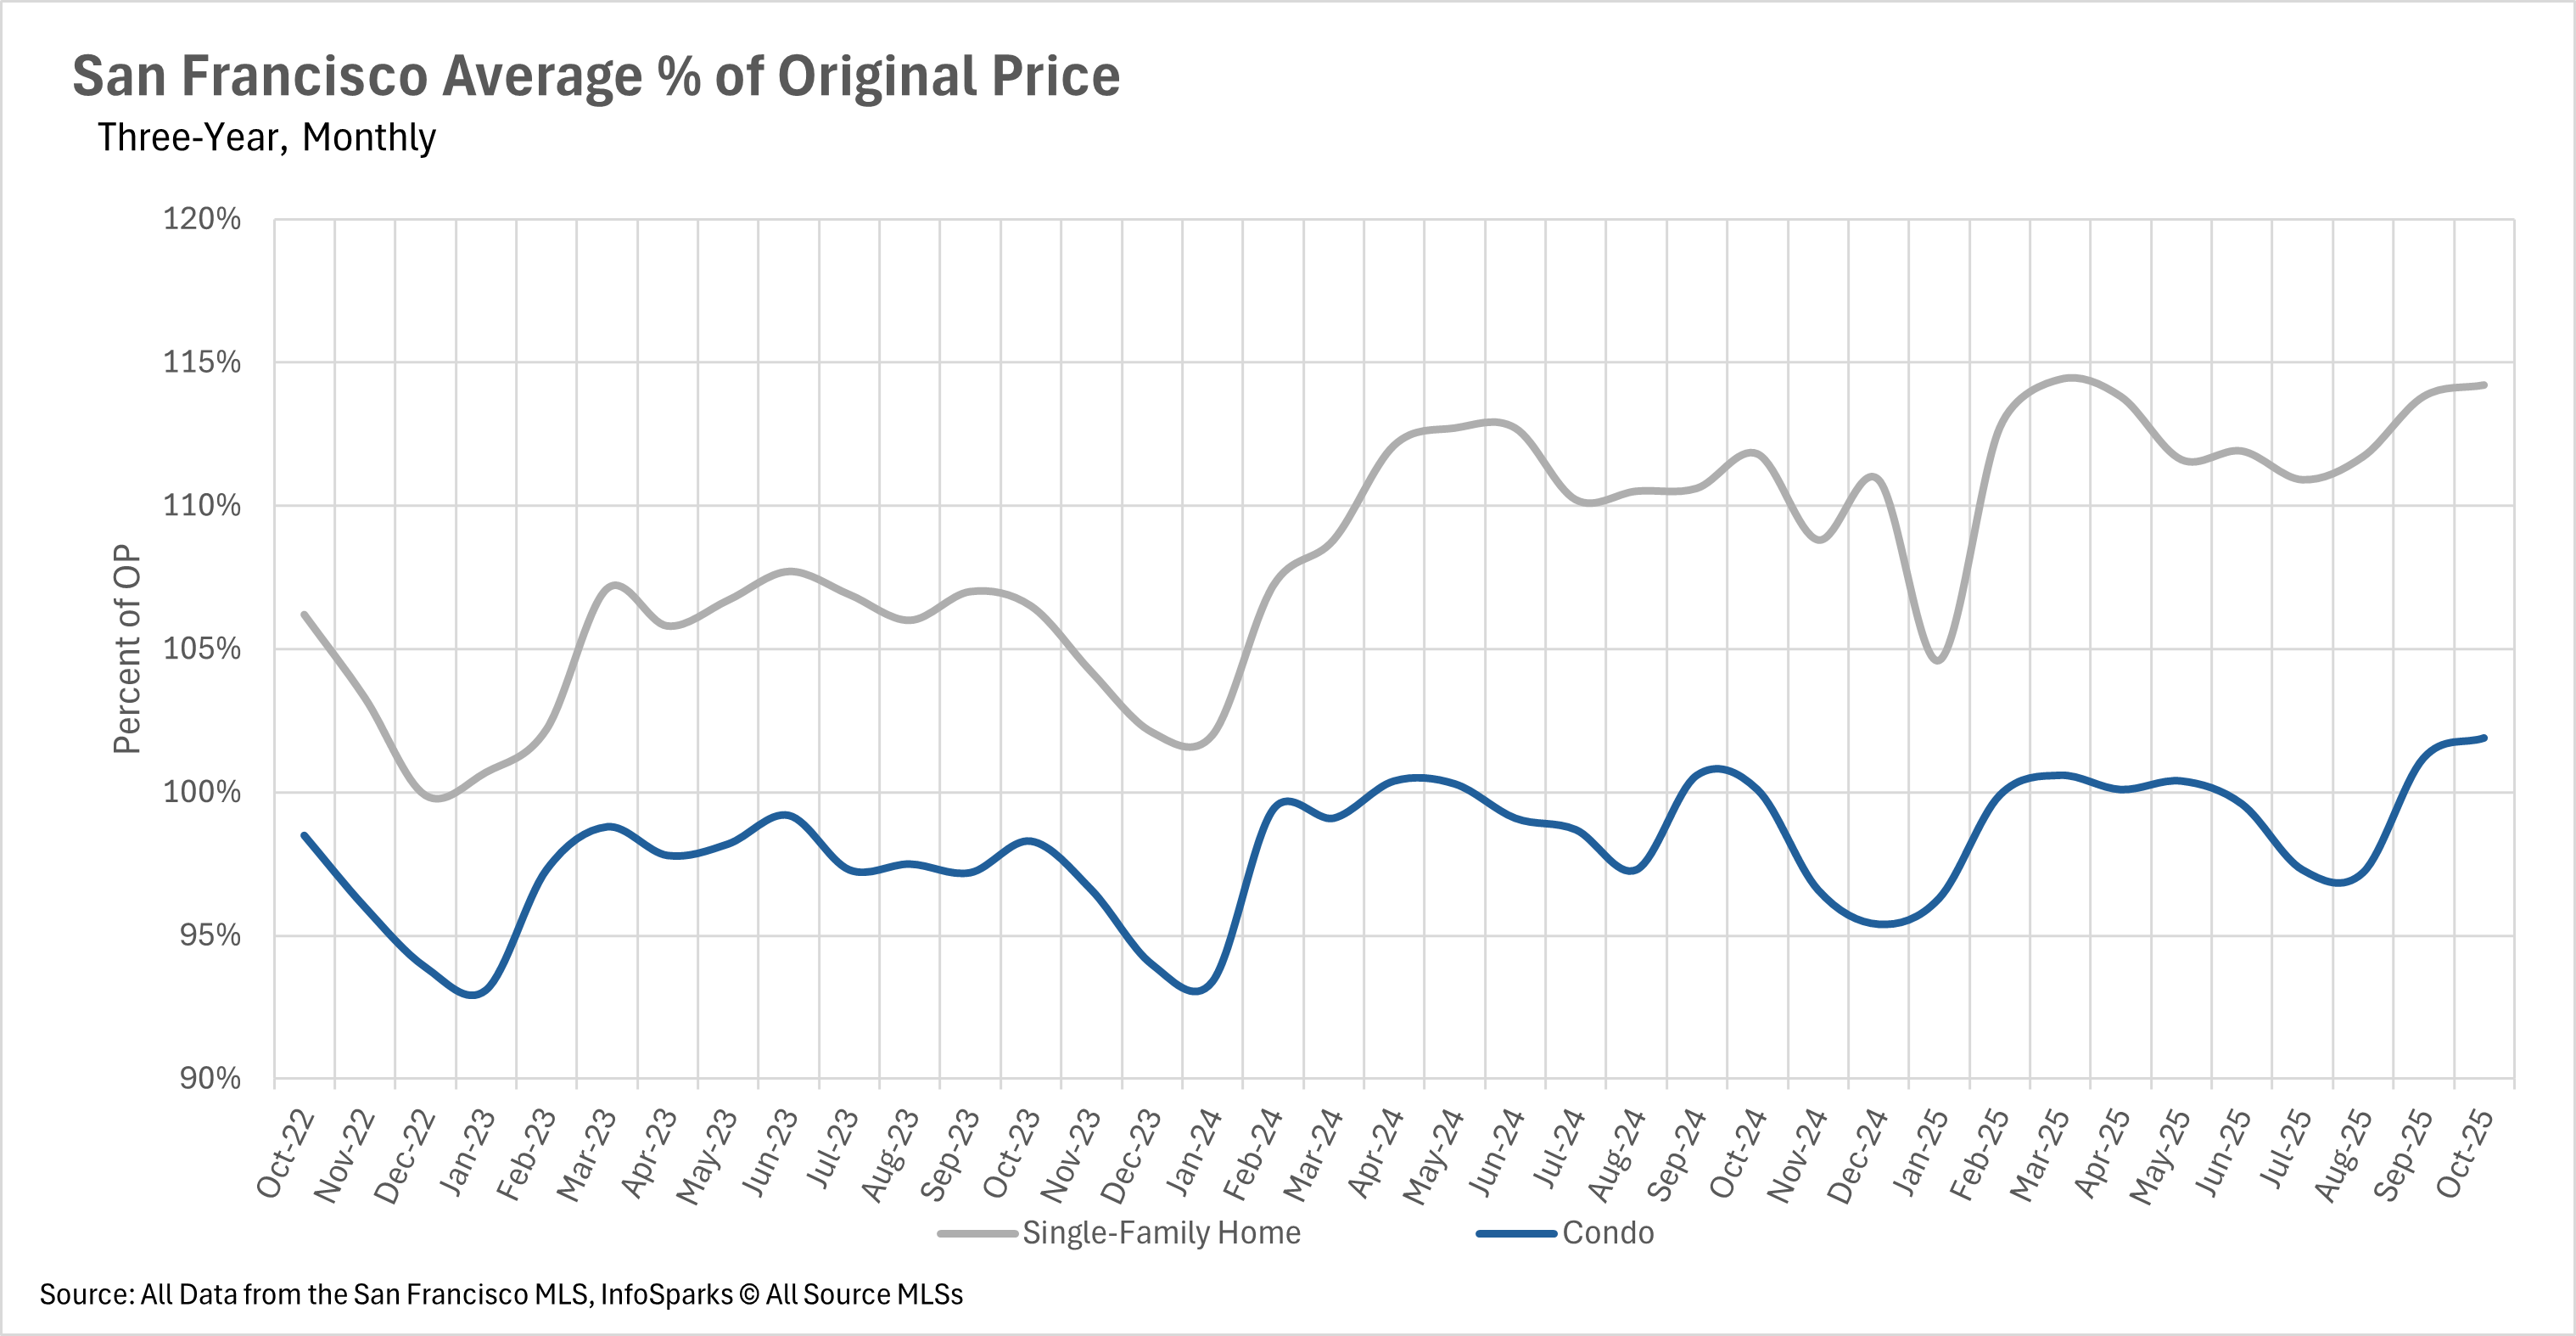
The single-family home market is on fire in San Francisco right now, as the median sale price for a single-family home is reaching the highest level it’s reached in the past two years! This surge in price represents 7.29% year-over-year increase. However, on the flip side, the condo market is not quite as hot, with condos continuing to trade within the band that they typically sell for. With that being said, it’s unlikely for buyers to purchase a home under the asking price, as the average single-family home is selling for 114.2% of the original asking price, and the average condo is selling for 101.9% of the original asking price.
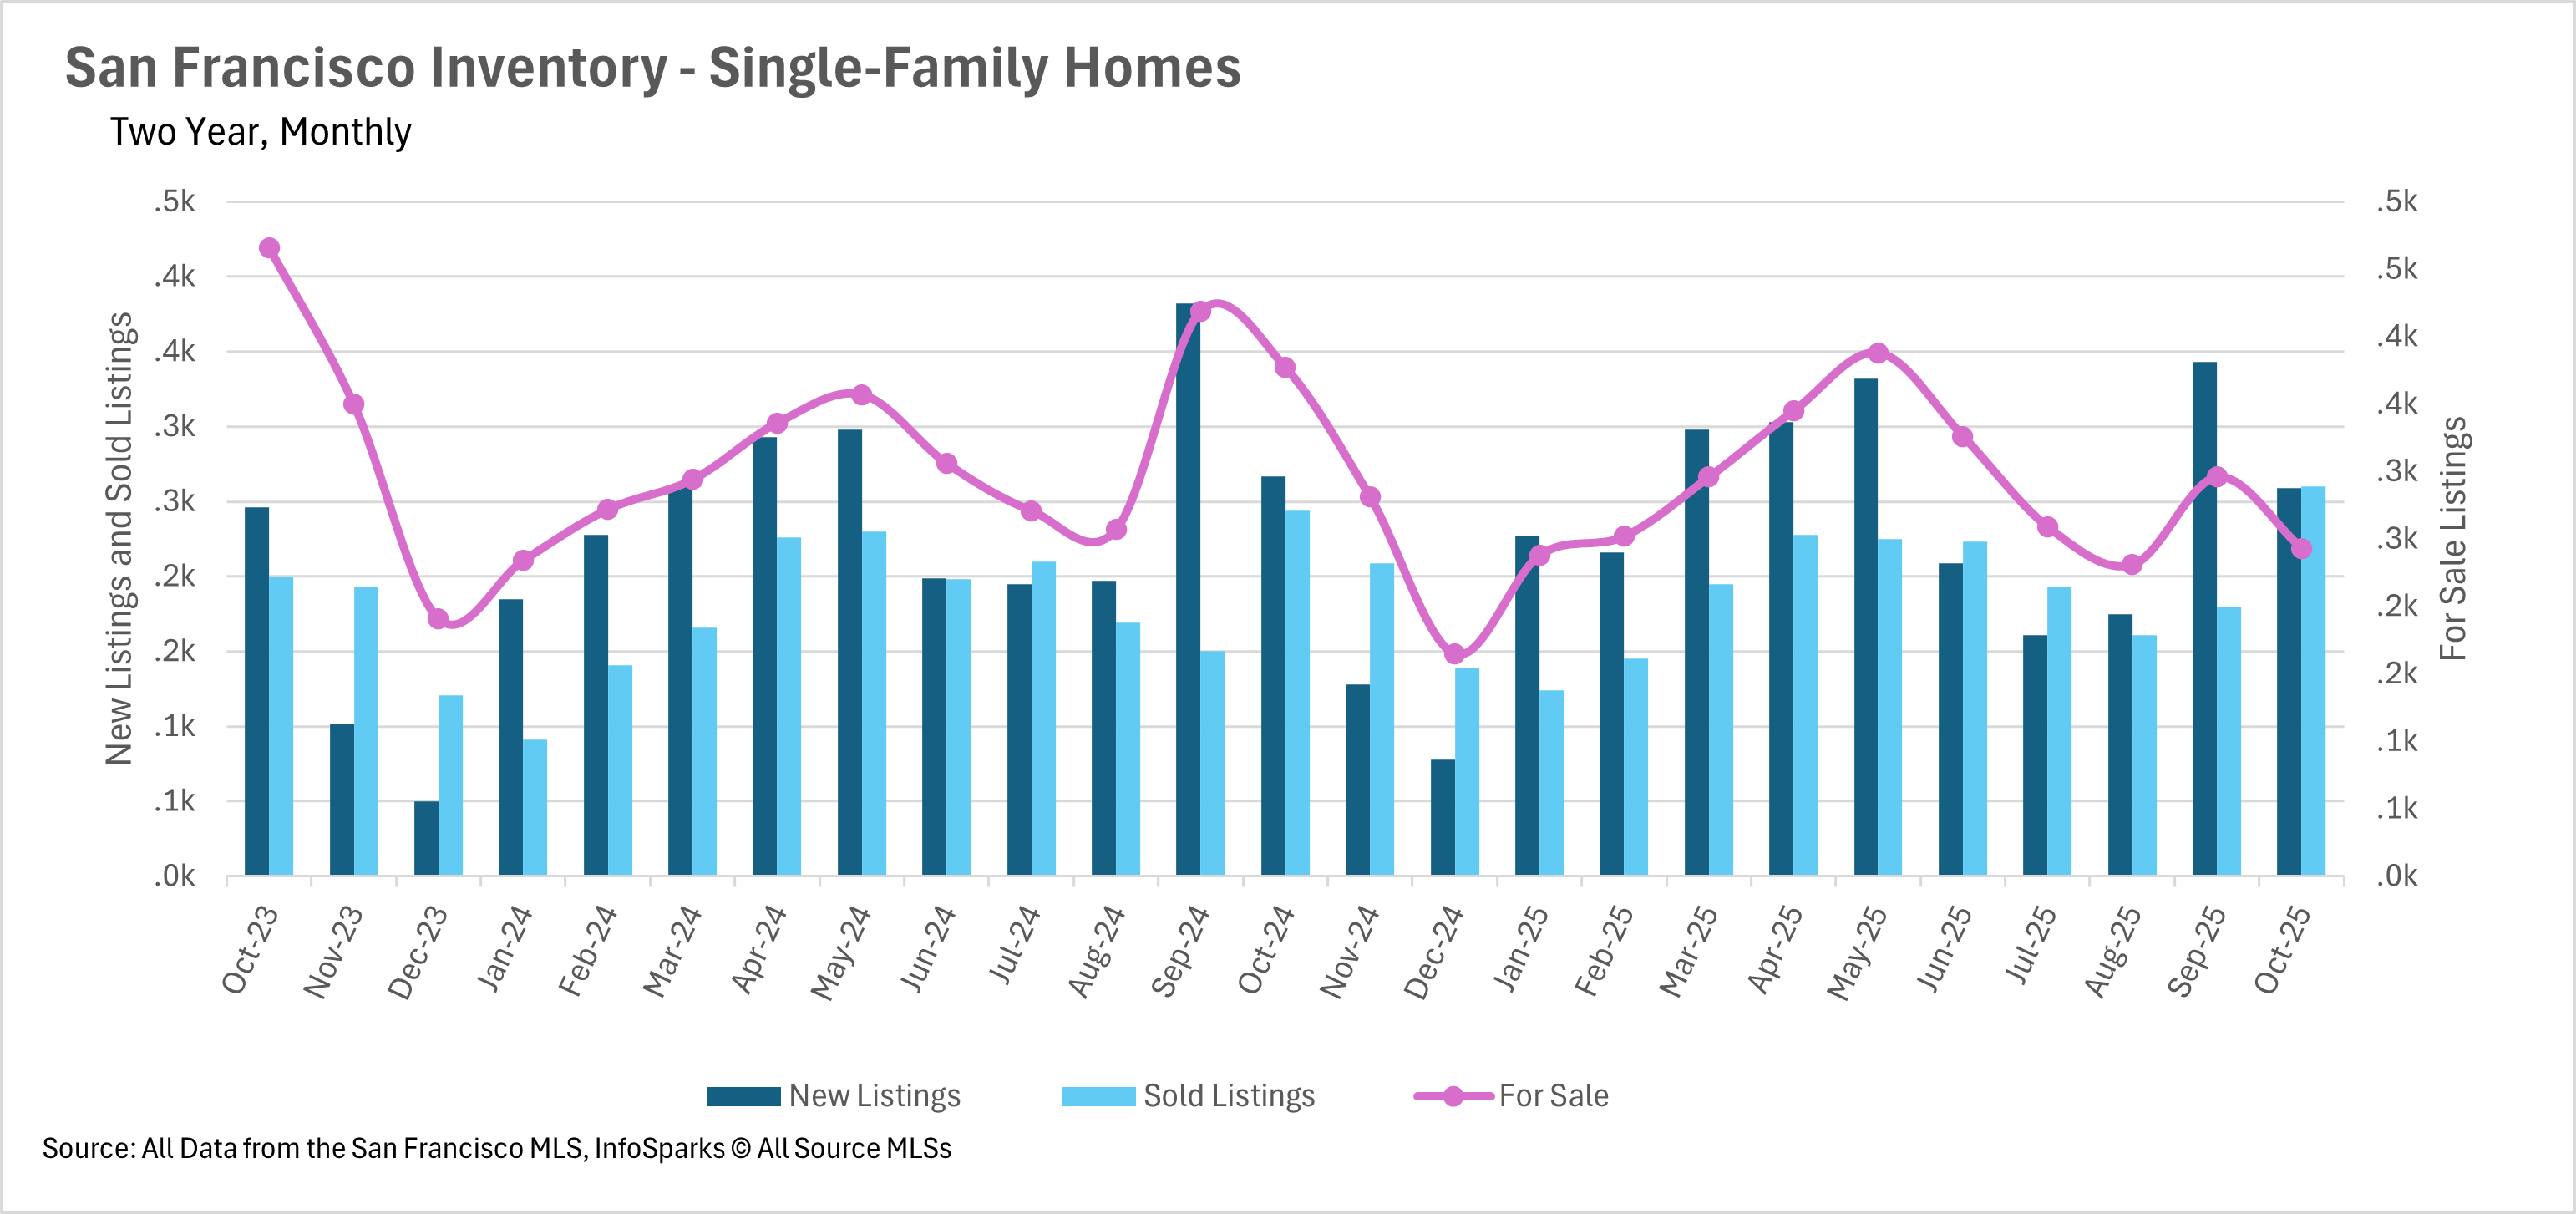
This year, it very briefly seemed like San Francisco would be able to exit the inventory glut that’s plagued the area for the past couple of years. However, that wasn’t the case. Today, we’re looking at inventory levels that are 35.54% lower than they were last year in the single-family home market, and 40.68% lower in the condo market. Unfortunately, it looks like the struggle for inventory will continue into the winter months. It’ll be important to pay attention to this metric over time, as it’s probably the most influential factor driving pricing in the area.
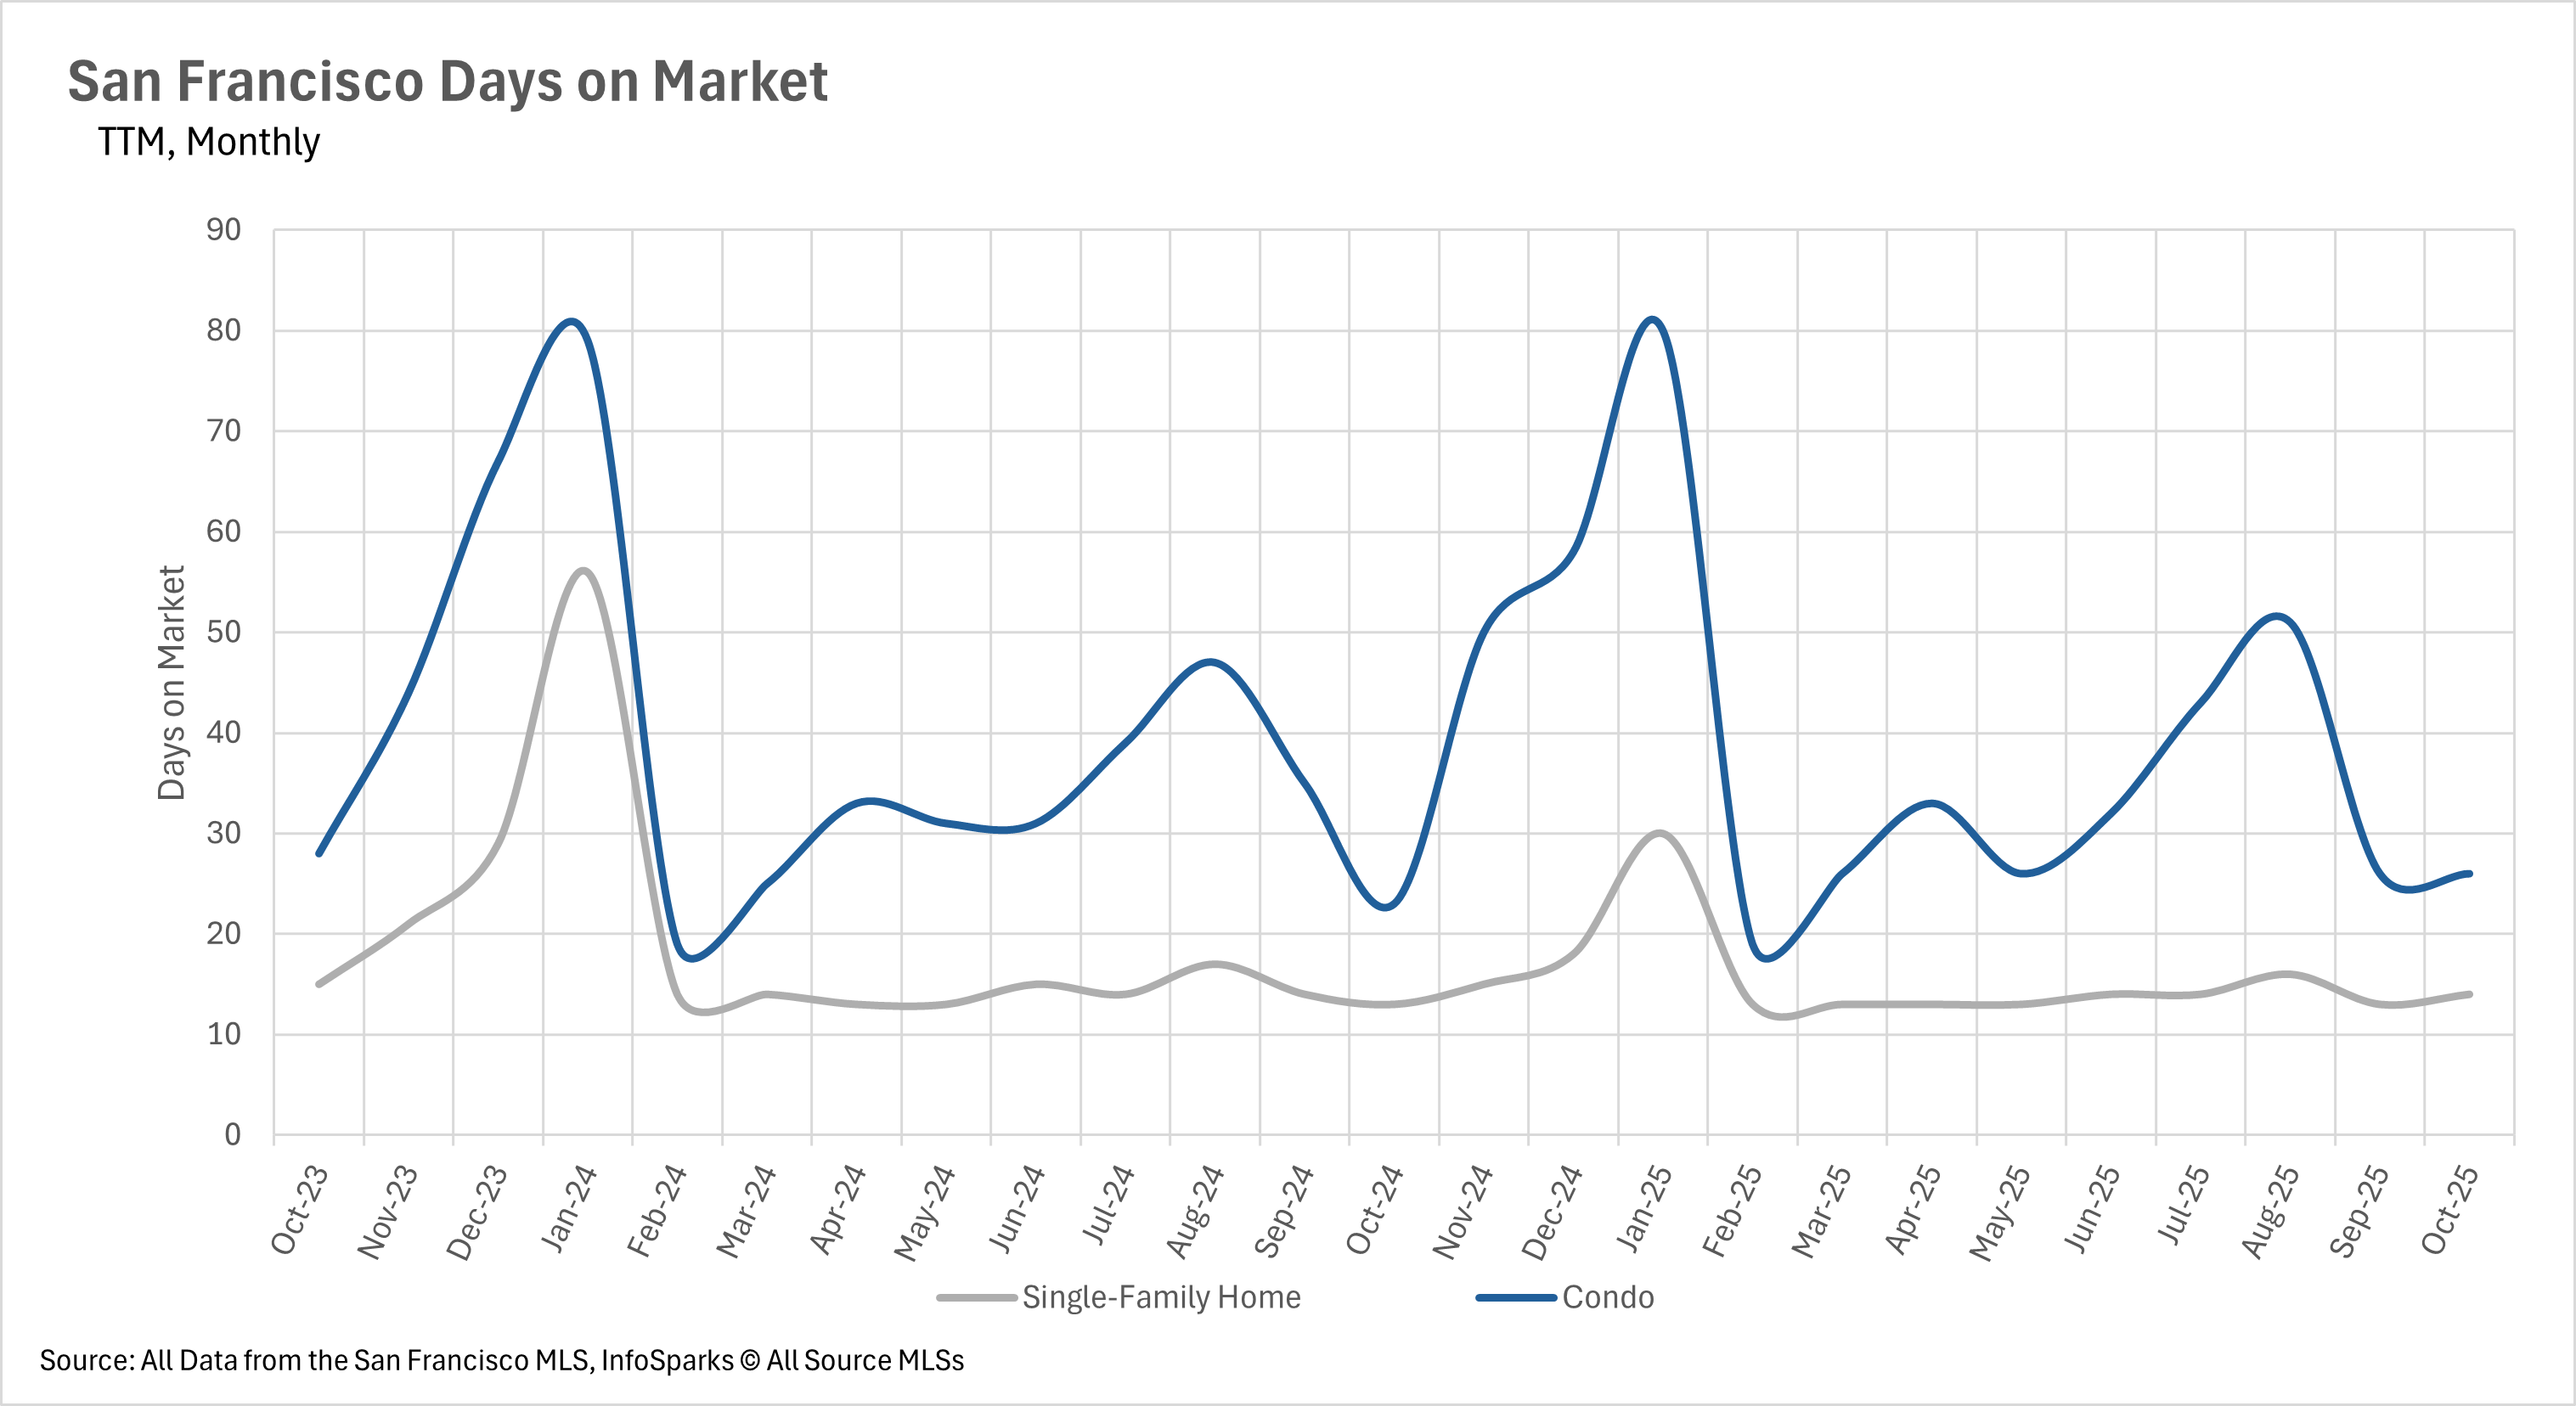
Inventories in San Francisco continue to be bought up at breakneck paces, with the average single-family home listing selling in 14 days and the average condo listing selling in 26 days. These figures represent 7.69% and 13.04% year-over-year increases, respectively. As we see inventory dwindle, the amount of time a listing spends on the market will likely also decrease, as buyers need to move increasingly quickly to close deals on the properties they want!
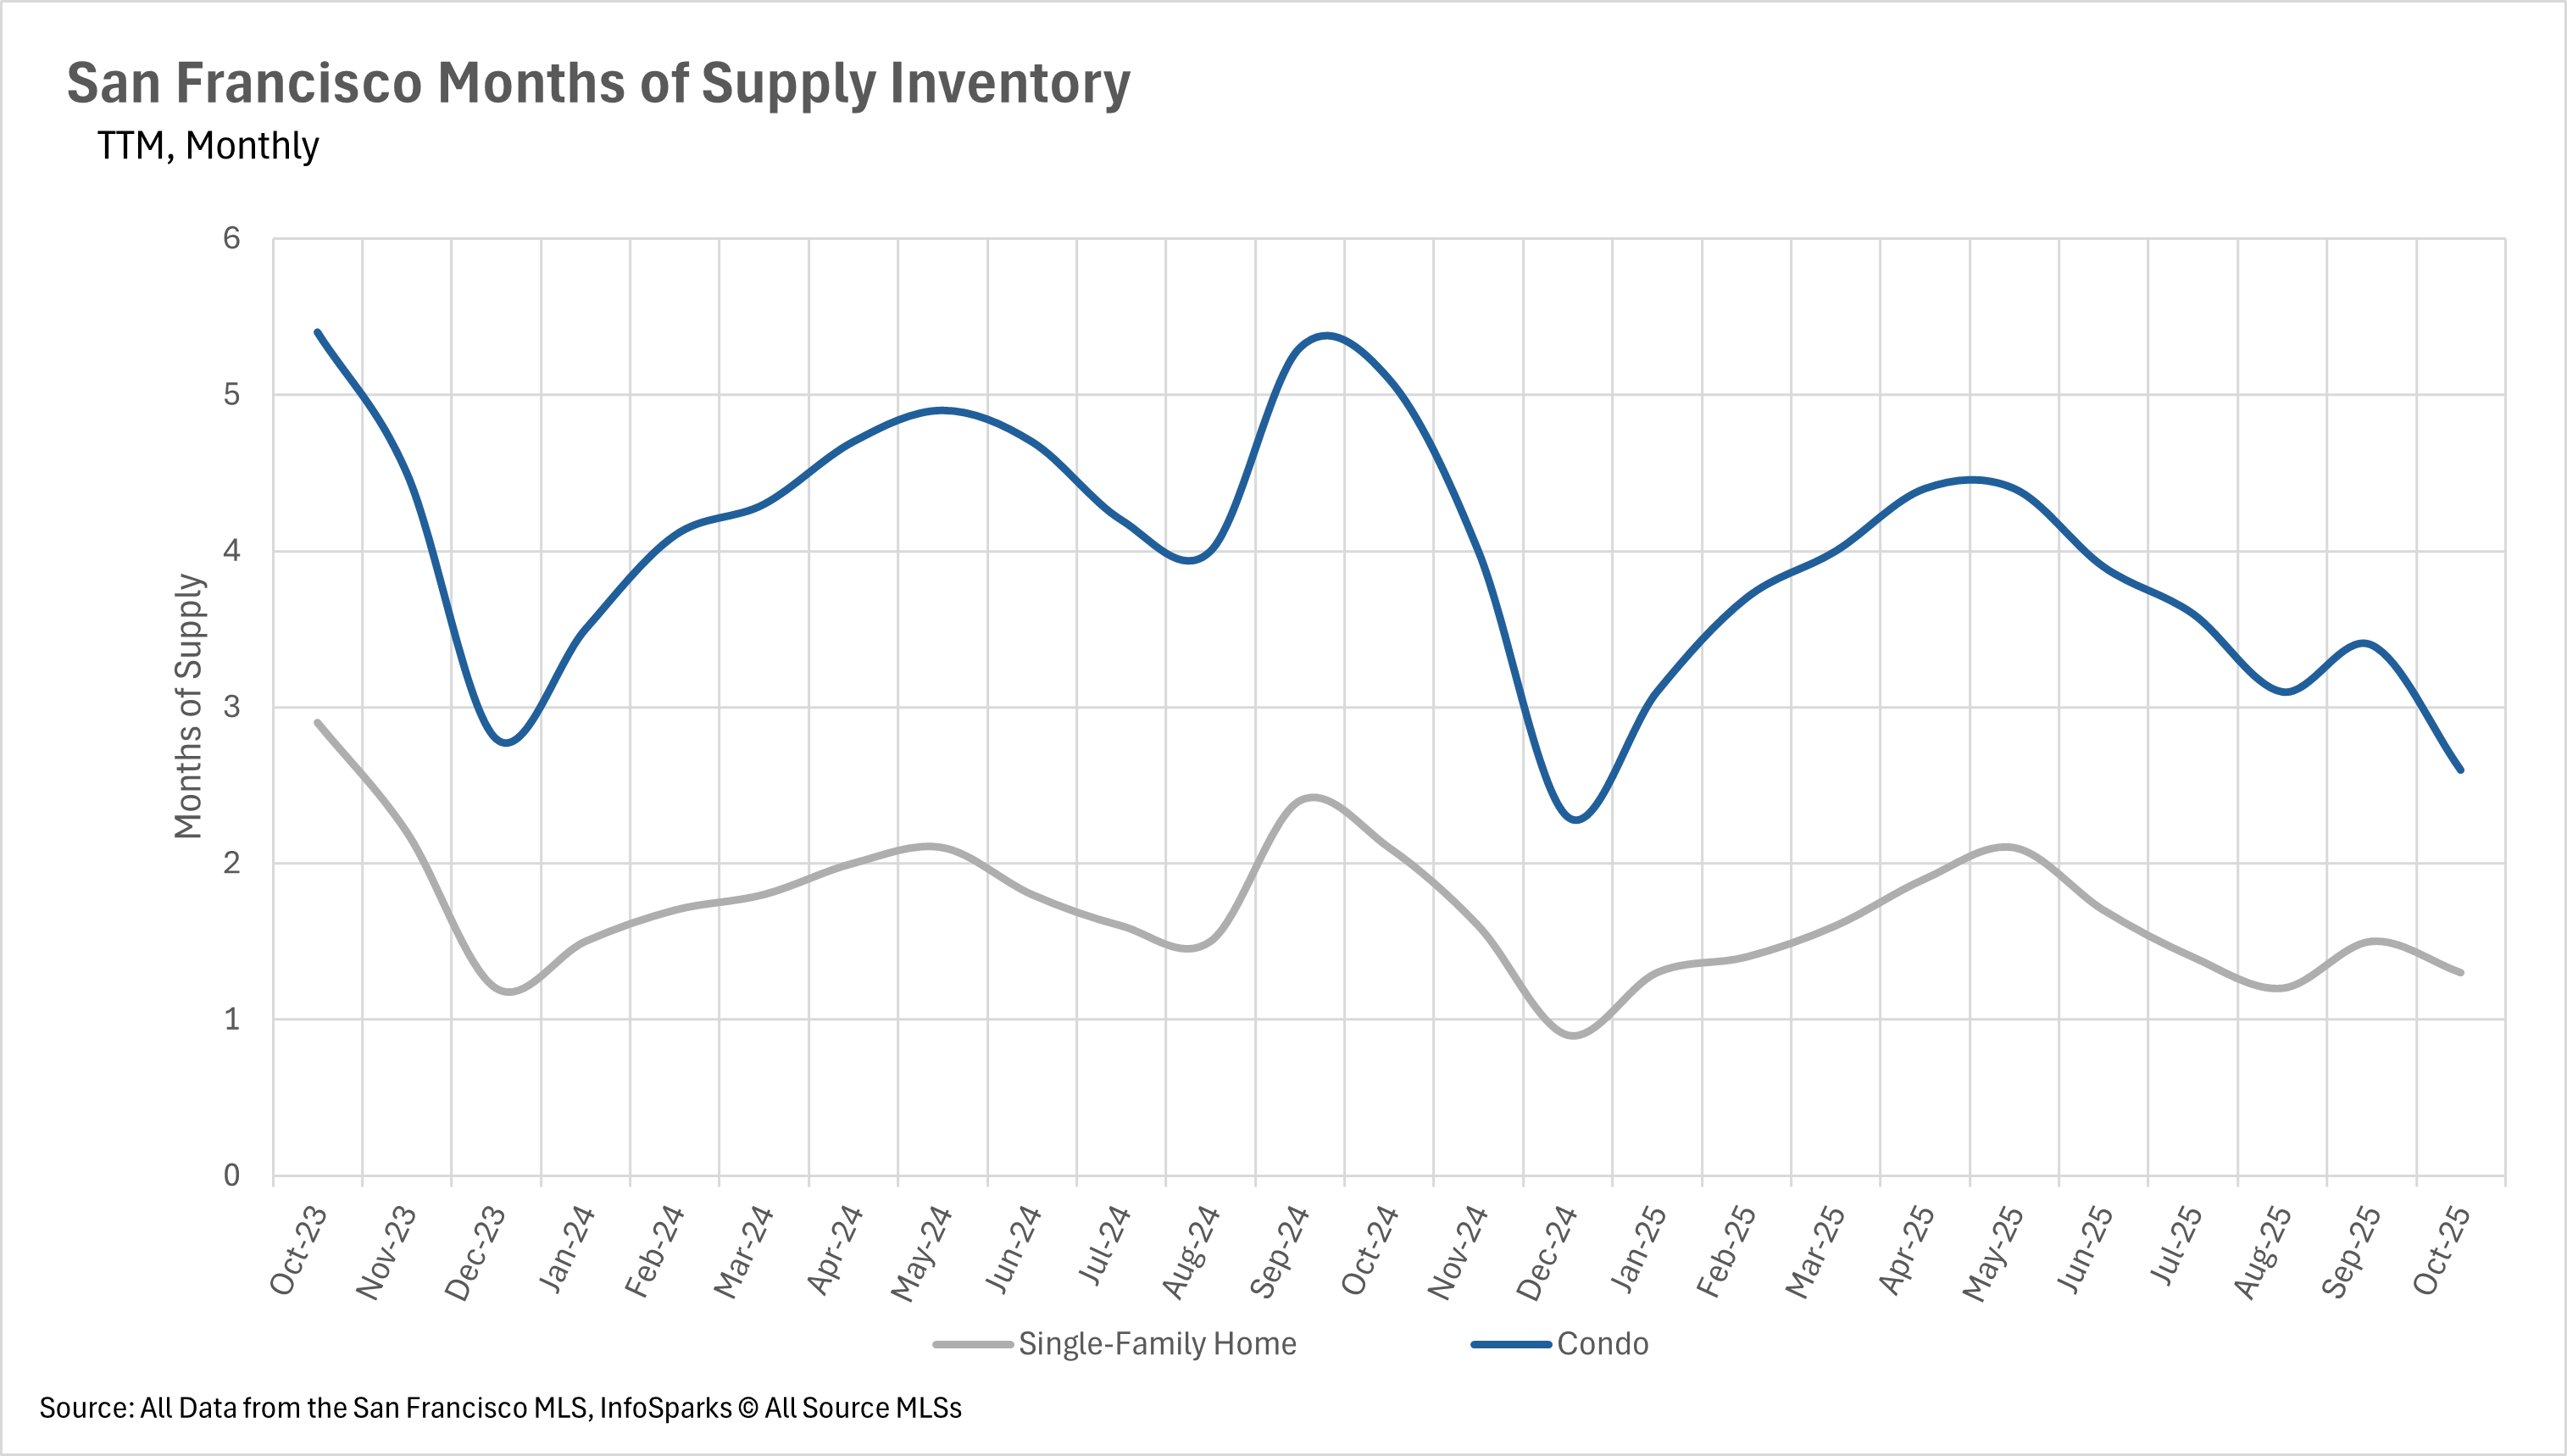
When determining whether a market is a buyers’ market or a sellers’ market, we look to the Months of Supply Inventory (MSI) metric. The state of California has historically averaged around three months of MSI, so any area with at or around three months of MSI is considered a balanced market. Any market that has lower than three months of MSI is considered a sellers’ market, whereas markets with more than three months of MSI are considered buyers’ markets.
Both the single-family home and condo markets are strong sellers markets, with 1.3 and 2.6 months of supply on the market, respectively. These figures represent year-over-year decreases of 38.10% and 49.02%, respectively.
Stay up to date on the latest real estate trends.

July 17, 2026
Explore Life Near the Panhandle at 536 Broderick

July 14, 2026
June 2026 Pacifica housing market data, including median sale price, days on market, price per square foot, and sale-to-list price trends.

July 9, 2026
What Bernal Buyers and Sellers Should Know
July 2, 2026
Discovering the History and Charm of Precita Park in Bernal Heights
You’ve got questions and we can’t wait to answer them.