Local Lowdown San Francisco July Market Update
July 17, 2023

July 17, 2023
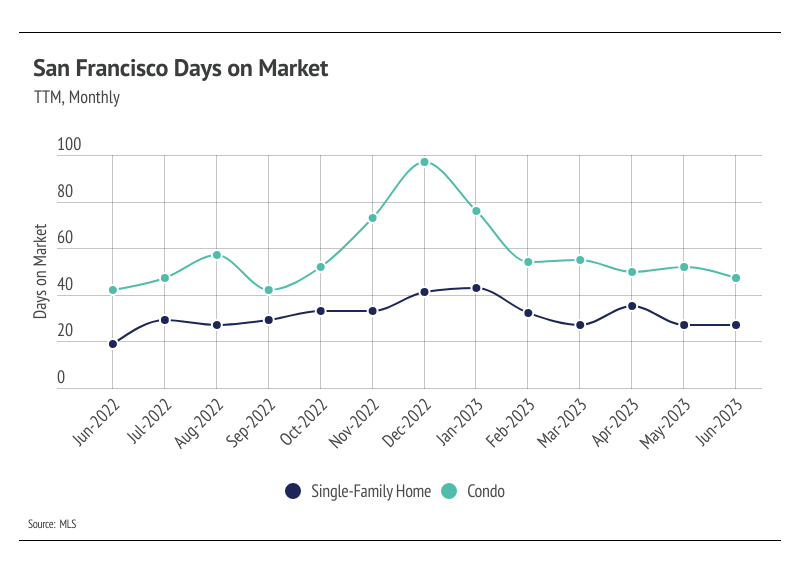
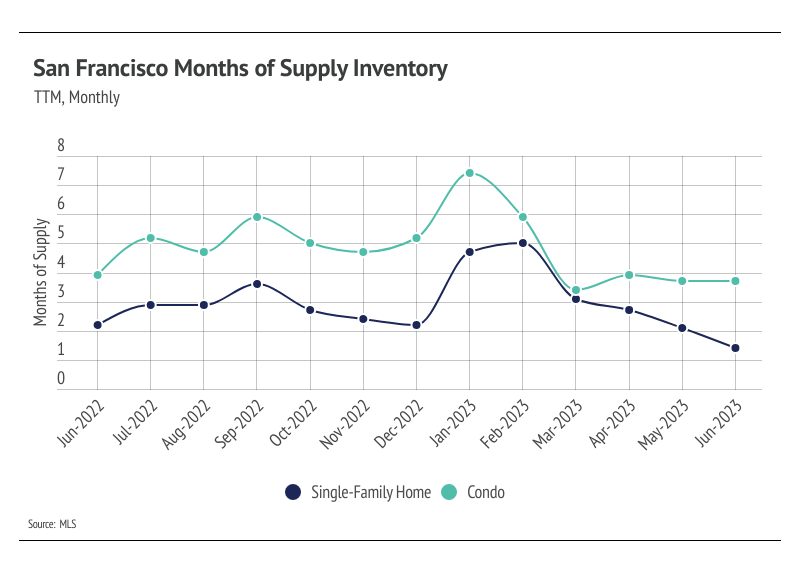
Note: You can find the charts/graphs for the Local Lowdown at the end of this section.
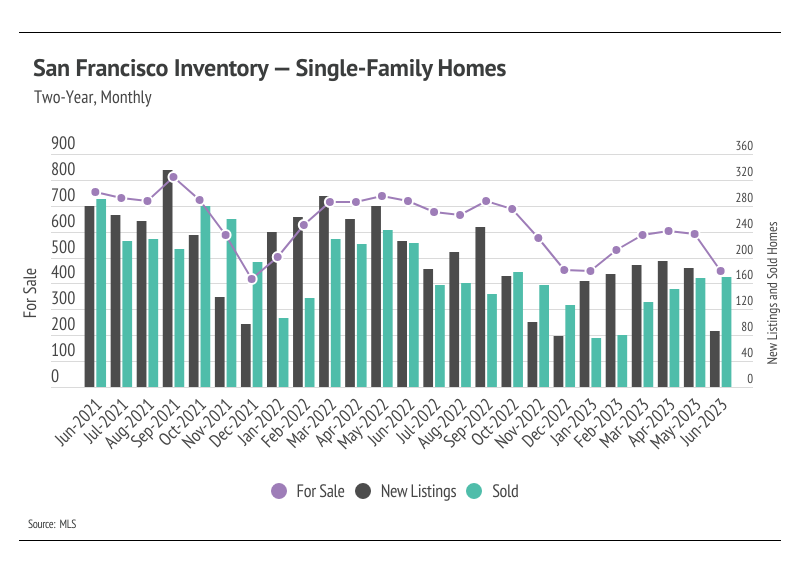
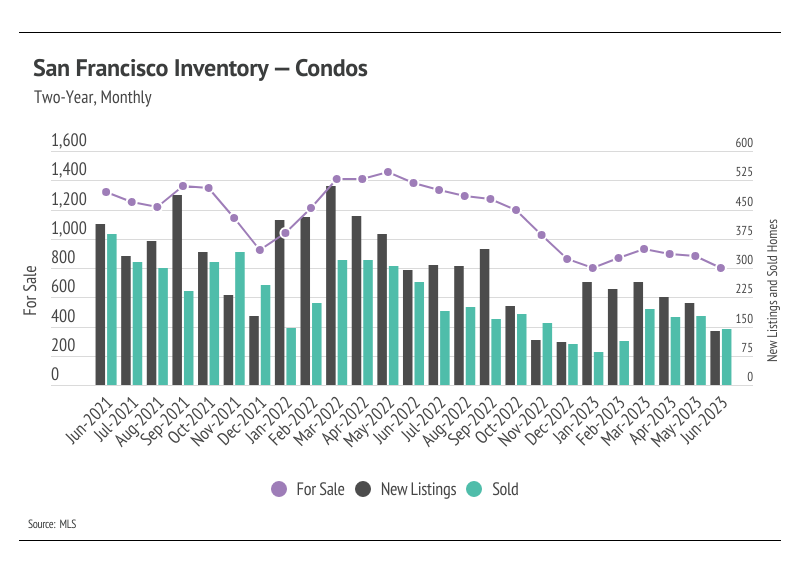
Months of Supply Inventory (MSI) quantifies the supply/demand relationship by measuring how many months it would take for all current homes listed on the market to sell at the current rate of sales. The long-term average MSI is around three months in California, which indicates a balanced market. An MSI lower than three indicates that there are more buyers than sellers on the market (meaning it’s a sellers’ market), while a higher MSI indicates there are more sellers than buyers (meaning it’s a buyers’ market). The San Francisco market tends to favor sellers, at least for single-family homes, which is reflected in its low MSI. However, we’ve seen over the past 12 months that this isn’t always the case. MSI indicated that single-family homes and condos began the year in a buyers’ market. MSI has declined sharply since January for both single-family homes and condos, indicating that the climate has shifted from a buyers’ market to a sellers’ market for single-family homes and a balanced market for condos. The sharp drop in MSI occurred due to the higher proportion of sales relative to active listings and less time on the market.
Stay up to date on the latest real estate trends.

May 21, 2026
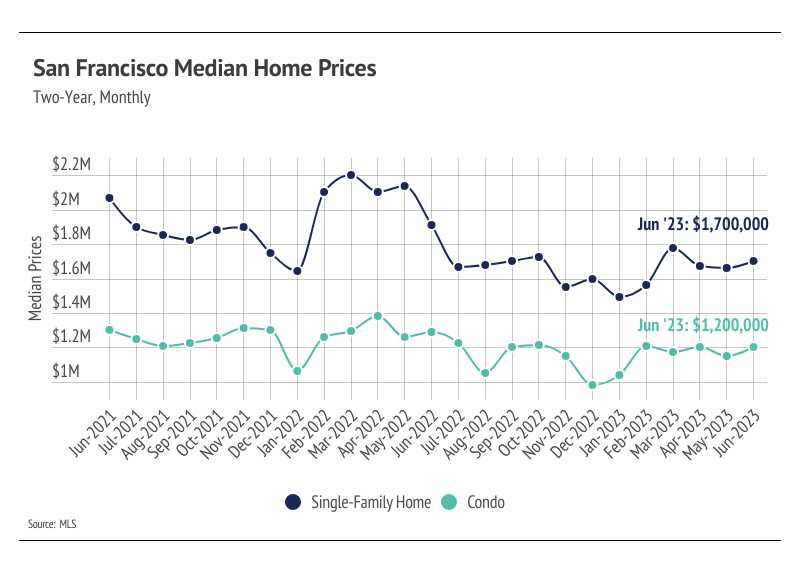
Breaking down home prices, condo trends, inventory levels, and buyer activity across San Francisco.

May 12, 2026
April 2026: Home Sales Jump & Median Single Family Home Prices Hold Steady

May 7, 2026
What buyers — and visitors — actually need to know about the Inner Sunset

May 1, 2026
A practical look at San Francisco ADU rules, permitting, and rental strategy—based on my experience converting a Bayview basement into a steady mid-term rental.
You’ve got questions and we can’t wait to answer them.