Pacifica Real Estate Market Update July 2025
August 2, 2025

August 2, 2025
In July there were 22 home sales in Pacifica. Closed listings range in price from $769,800 to $2,105,000. The closed listings had a median price per square foot of $852.54 and median days on the market of 20.
**To better illustrate market trends, the graphs below represent a rolling 3 months of data. The charts at the bottom are monthly and real-time stats.
| Active | Pending | Closed | Other | Total |
|---|---|---|---|---|
| 15 | 15 | 22 | 10 | 62 |
| Minimum | Average | Median | Maximum | Tot. Val. | |
|---|---|---|---|---|---|
| 2 | 3 | 3 | 6 | ||
| 1 | 2 | 2 | 7 | ||
| 860 | 1,784 | 1,565 | 5,950 | ||
| 0.02 | 0.33 | 0.14 | 9.82 | ||
| 1,000 | 14,248 | 5,881 | 427,771 | ||
| 1904 | 1968 | 1964 | 2025 | ||
| $724,999 | $1,484,538 | $1,293,500 | $4,600,000 | ||
| $518.40 | $869.97 | $820.64 | $1,365.38 | ||
| $116,595.56 | $12,219,060.55 | $9,365,937.72 | $40,728,600.00 | ||
| $769,800 | $1,326,718 | $1,297,500 | $2,105,000 | $29,187,800 | |
| $530.30 | $899.81 | $852.54 | $1,230.77 | ||
| $3,716,596.47 | $10,966,963.75 | $9,229,095.08 | $38,808,536.59 | ||
| 0 | 34 | 20 | 280 | ||
| 0 | 40 | 21 | 280 |
| # of Listings | % of Total | SP % LP | |
|---|---|---|---|
| 19 | 86 | 106.67 | |
| 2 | 9 | 93.30 | |
| 1 | 4 | 90.00 | |
| 0 | 0 | ||
| 0 | 0 | ||
| 22 | 100 | 96.66 |
| # of Listings | % of Total | SP % LP | |
|---|---|---|---|
| 19 | 86.36 | 106.67 | |
| 2 | 9.09 | 93.30 | |
| 1 | 4.55 | 90.00 | |
| 0 | 0.00 | ||
| 0 | 0.00 | ||
| 22 | 100 | 96.66 |
Stay up to date on the latest real estate trends.

April 10, 2026
Key Noe Valley Real Estate Metrics
April 8, 2026
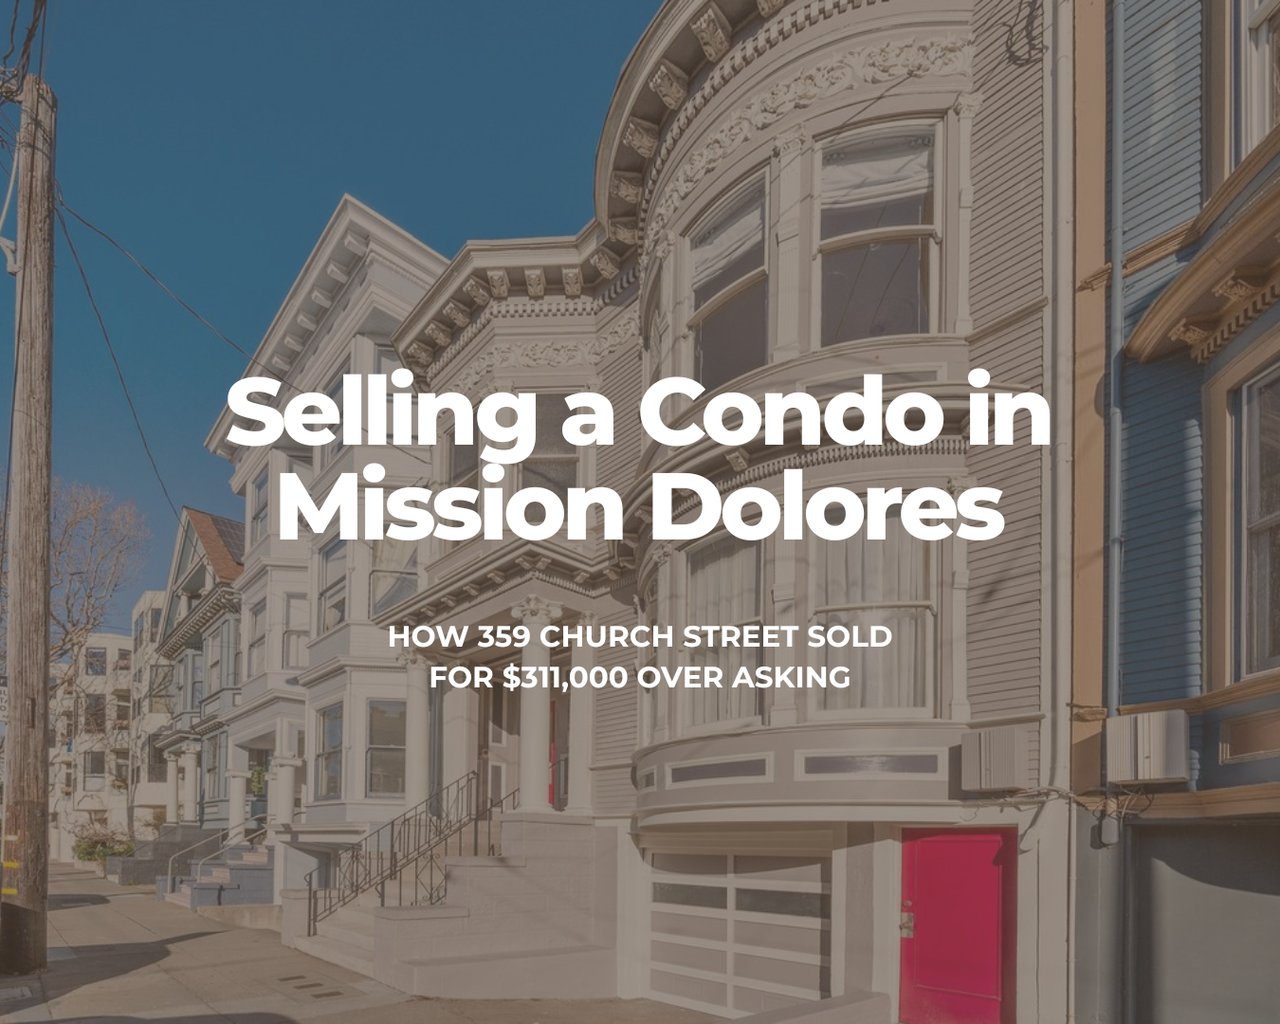
A Mission Dolores condo sale case study showing how thoughtful preparation, staging, and pricing helped 359 Church Street attract 10+ offers and sell for $311,000 over… Read more
April 6, 2026
With 29 sales, a $1.3M median price, and homes selling in just 12 days, Pacifica’s market stays competitive
April 1, 2026
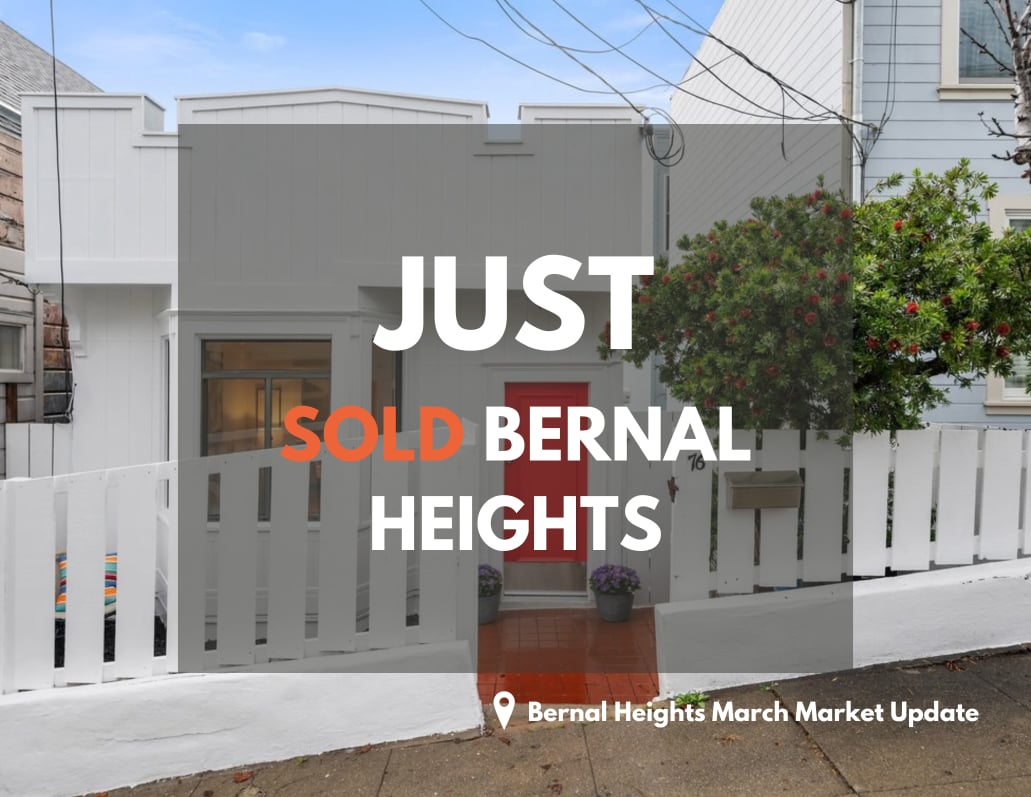
Median Bernal sold price per square foot for SFH: $1,157.14
You’ve got questions and we can’t wait to answer them.