SF Housing Affordability / A Buying and Selling Strategy
October 28, 2019

October 28, 2019

|
|
| ||||
|
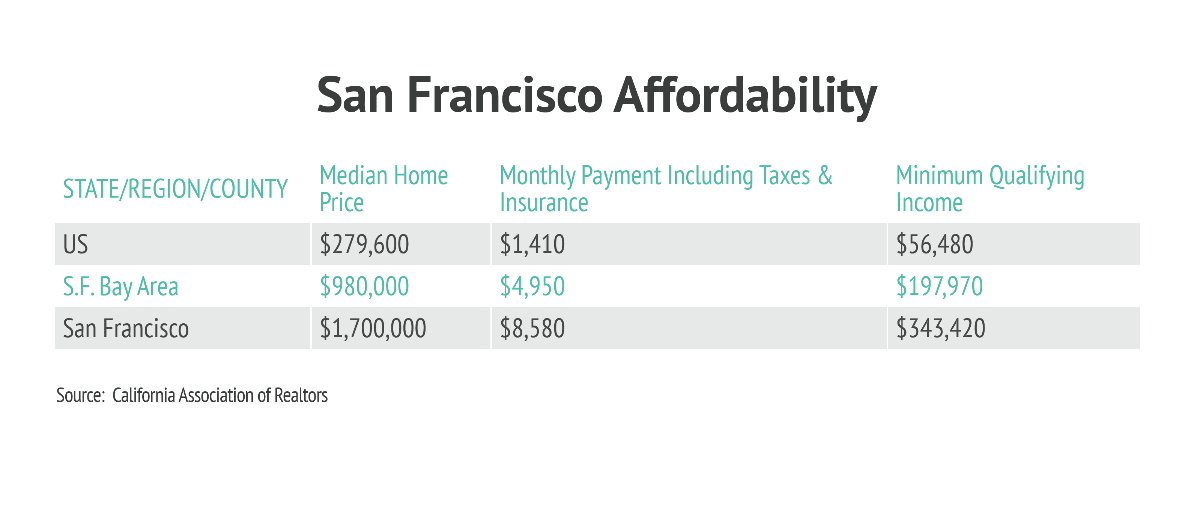
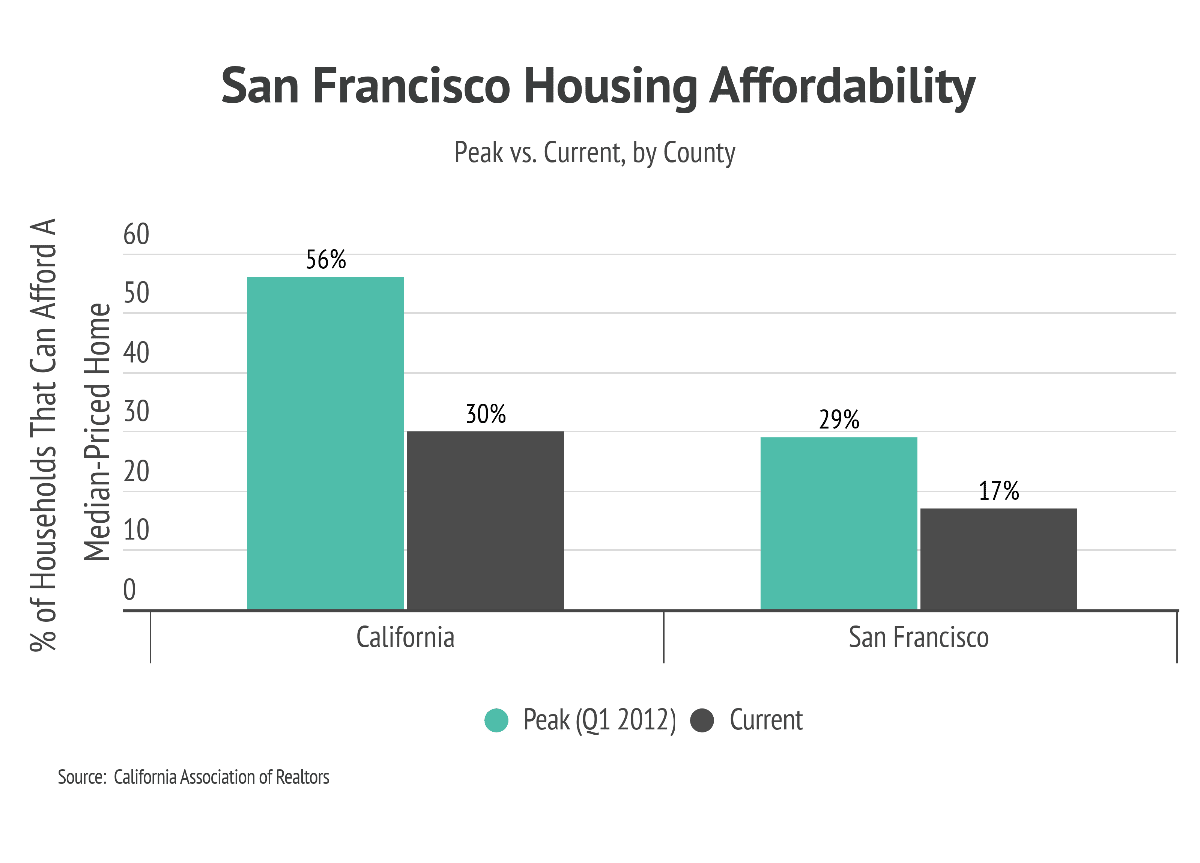
Housing has become increasingly less affordable since home prices began rebounding in 2011. Now, San Francisco residents pay more than six times the national average! The chart below reminds us of just how unaffordable housing is.
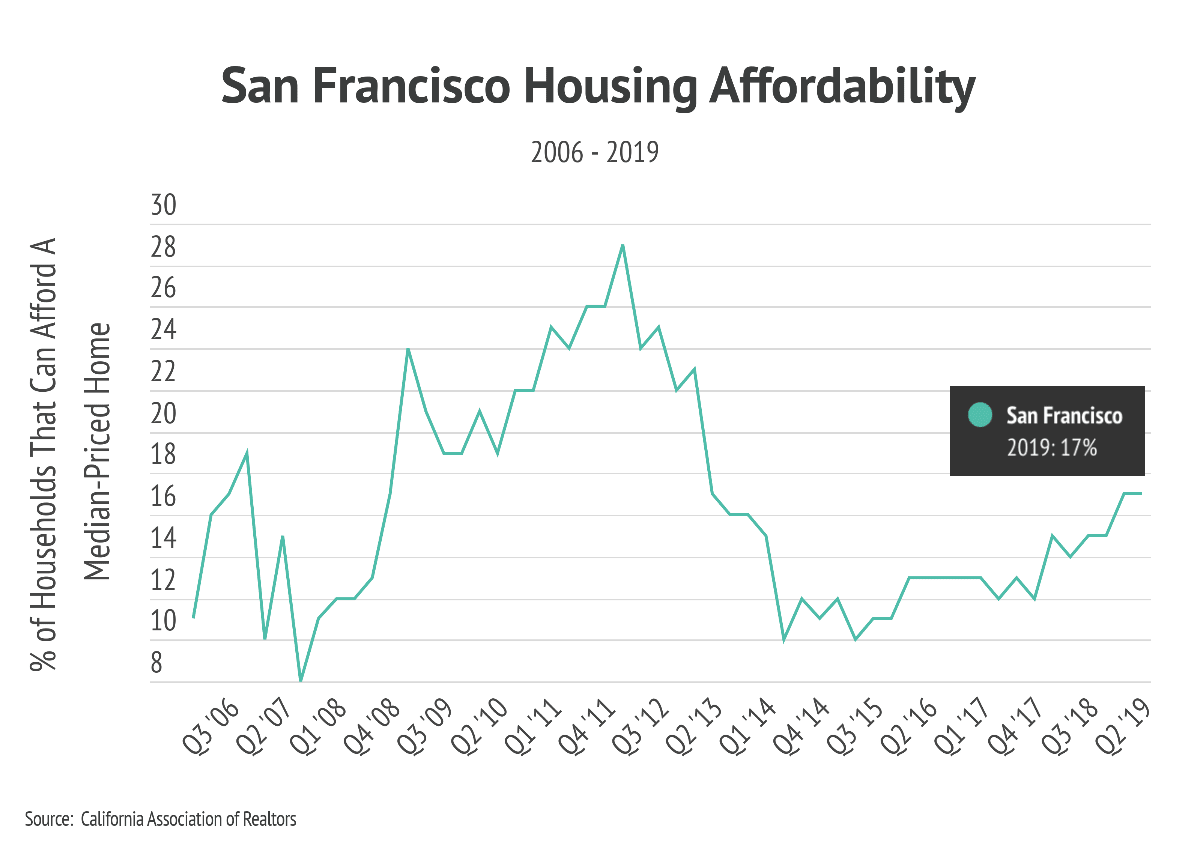
Even when prices bottomed out between 2009-2012, the percentage of residents who could afford to buy never came close to reaching 50%. Today, less than 17% of residents can afford the median-priced home. What might help affordability creep up toward a balanced 50%? Only profound and sweeping structural changes to residential real estate—something we consider unlikely, at least in the near future.
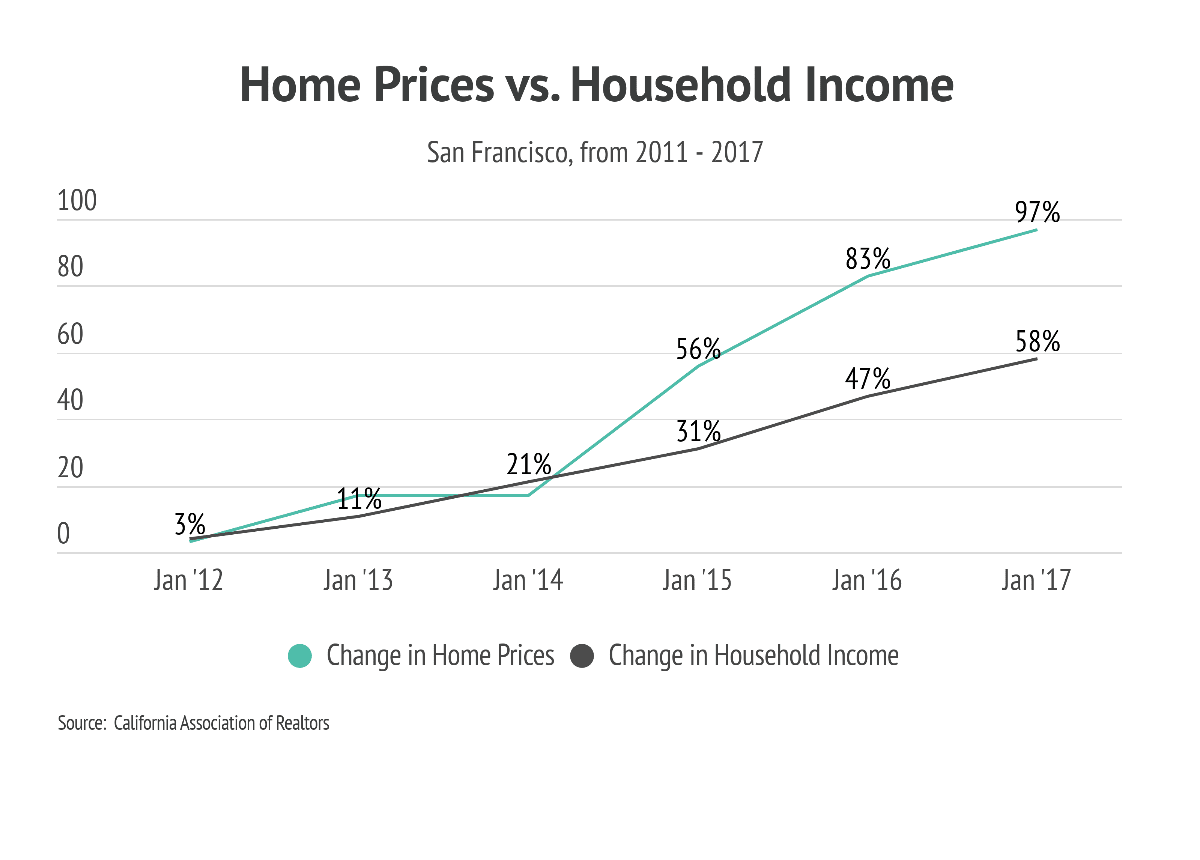
Home Prices vs. Household Income
One reason San Francisco struggles with affordability is that home prices are increasing much faster than incomes. The chart below tracks the growing disparity between home-price appreciation and household income from 2011 until 2017, with housing costs jumping significantly in 2014 relative to income.
The large economic expansion started toward the end of 2012; which, coupled with the high-tech boom, caused a surge in affluence and demand in the area. Foreign investment also contributes to real estate price appreciation, especially on the coasts, although it’s hard to quantify exactly how much appreciation is directly due to those investors. As we can see, income rises in a fairly linear, predictable fashion. As the difference between home prices and income increases, affordability decreases.
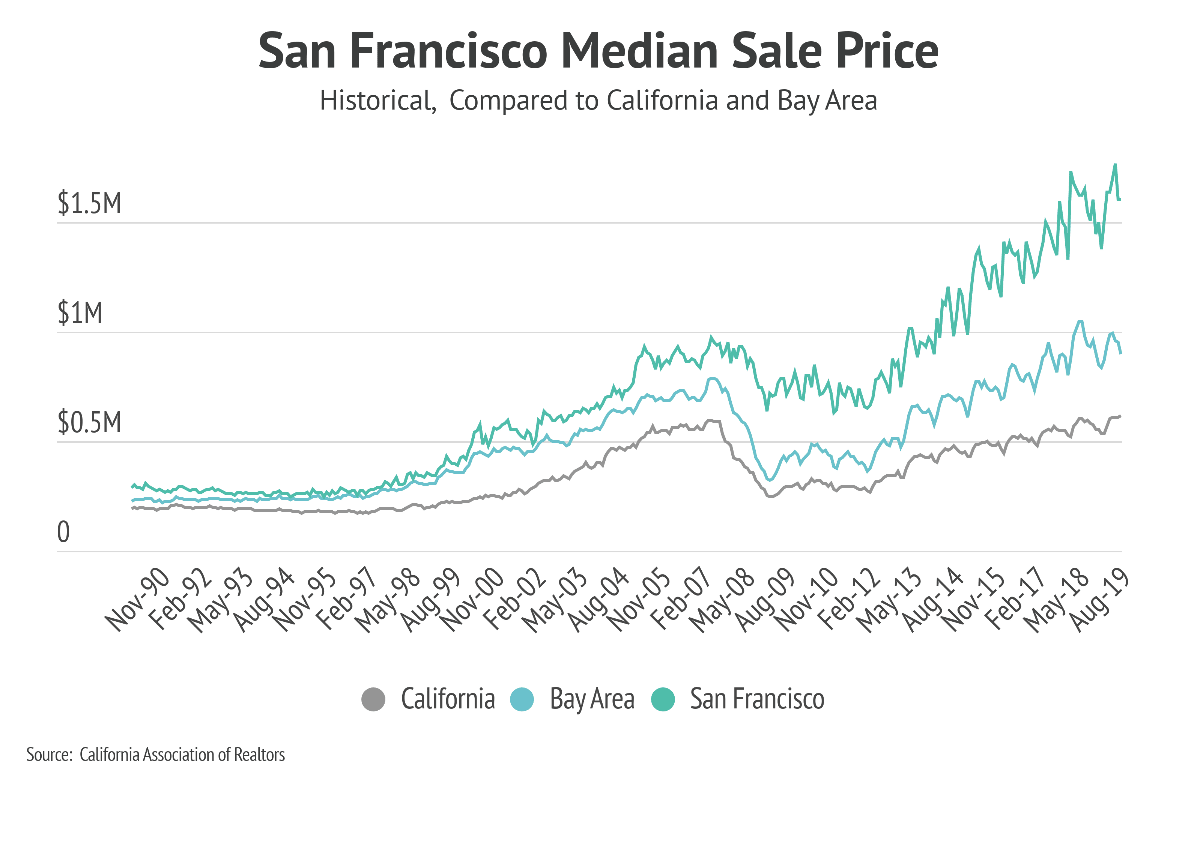
The chart above shows home prices climbing steadily from their recessionary lows to new peaks until interest rates began rising in 2018. Since then, price appreciation has been muted. Yearly comparisons such as these are important because they remove variations due to seasonality.
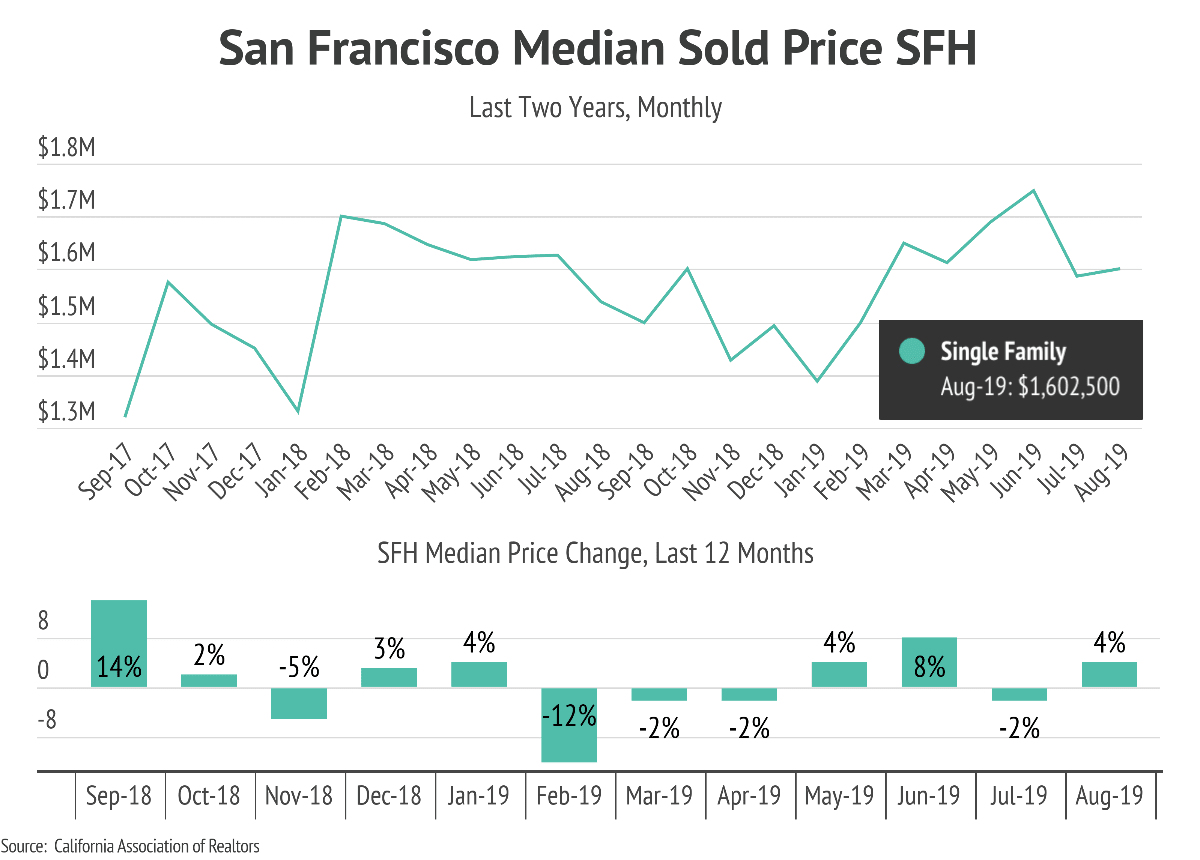
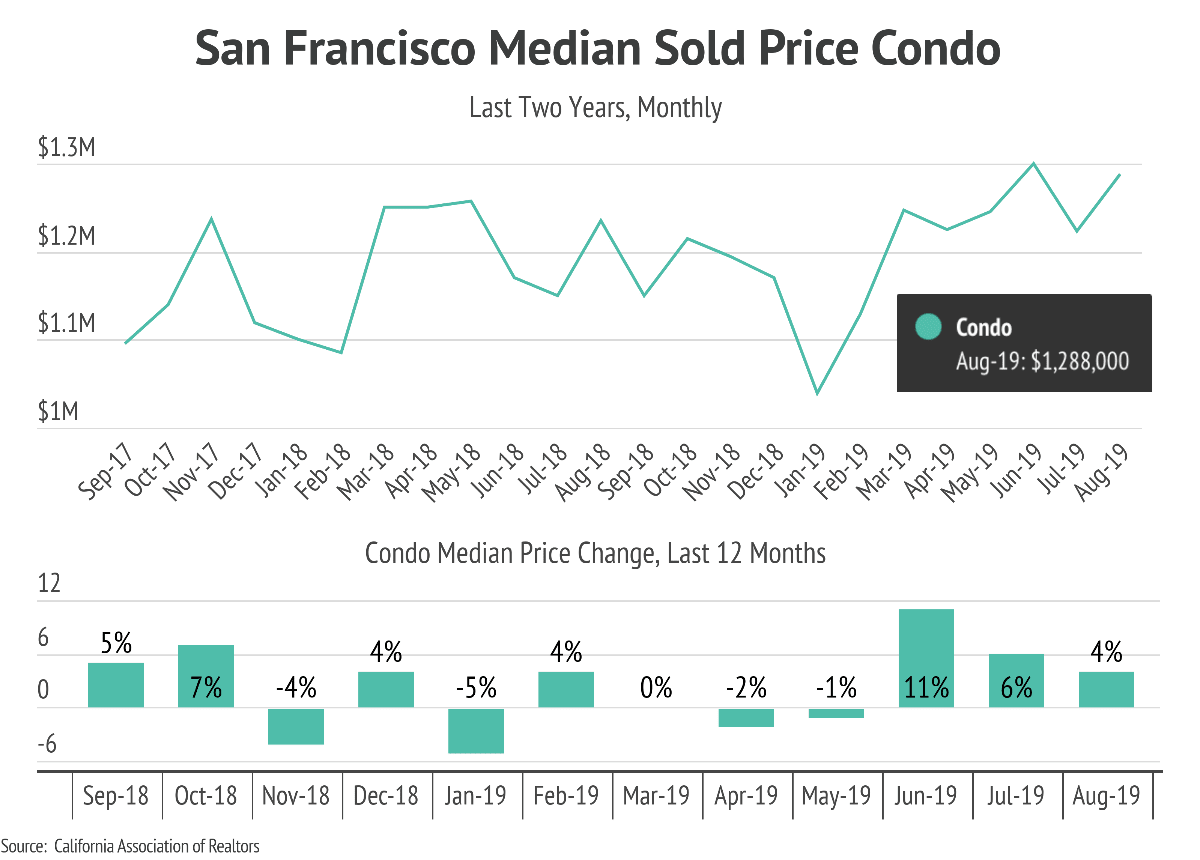
In August of this year, home prices varied little from the previous year. Both single-family homes are up 3%, and condos are up 15% compared to last year. Over the past 12 months (ending August 2019), most prices remain within 10% of the previous year.
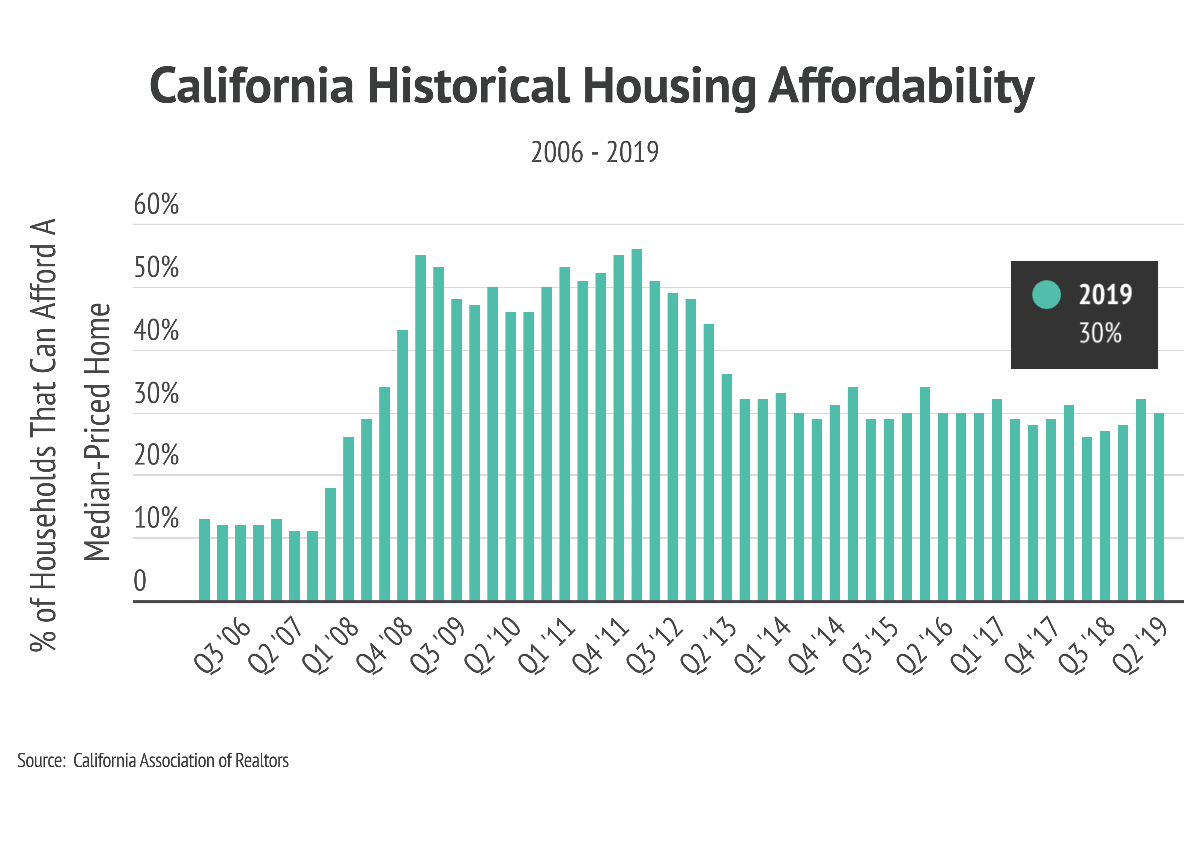
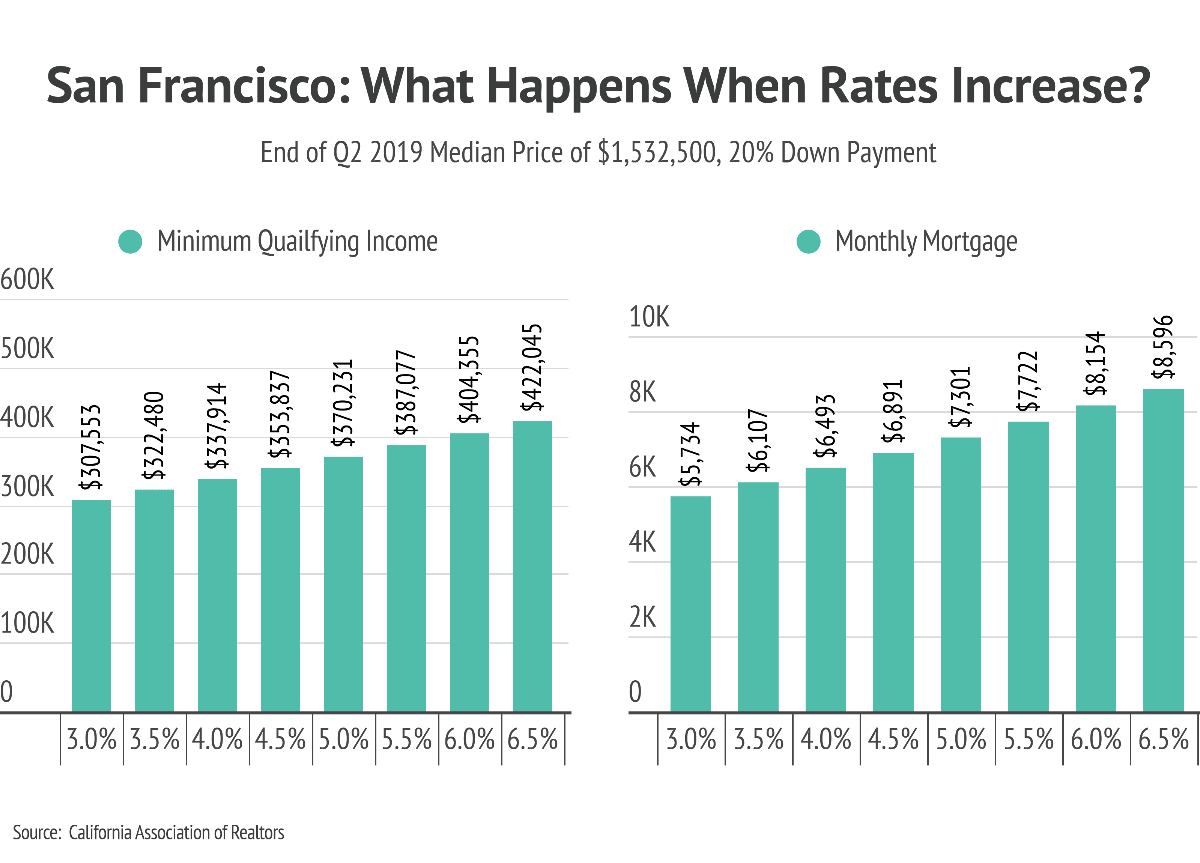
To really understand how unaffordable housing in California has become, let’s compare 2012 to 2019. In the first quarter of 2012, housing affordability in the state peaked when 56% of households could afford a median-priced home. At the end of the Q2 2019, 17% of San Francisco households could afford to buy a home. Both the median monthly payment and median minimum qualifying income have doubled over the last seven years.
Interest Rates and the Broader Market
One small sign of relief for both buyers and sellers is that affordability rose this quarter compared to last because interest rates are near their all-time lows, which helps offset price increases seen during that same period.
The question is, how will an increase in interest rates affect housing affordability?
From the charts below, we can see that interest rates have a dramatic effect on minimum qualifying income and monthly mortgage payments. For example, each half-point interest rate increase costs potential homeowners an average of $350 in monthly payments.
As a result, sky-high prices push many households to overextend their budgets in order to own a home.
The deputy chief economist for the California Association of Realtors (CAR), Jordan Levine, says:
“The bottom line of this housing forecast is we don’t really see a big improvement in housing affordability. Low [mortgage rates] do help a little bit . . . We’re much less pessimistic than we were nine months ago when rates were higher.”
Now, let’s look at last month’s key housing indicators for both single-family homes and condos to see what’s happening beyond affordability in the broader market.
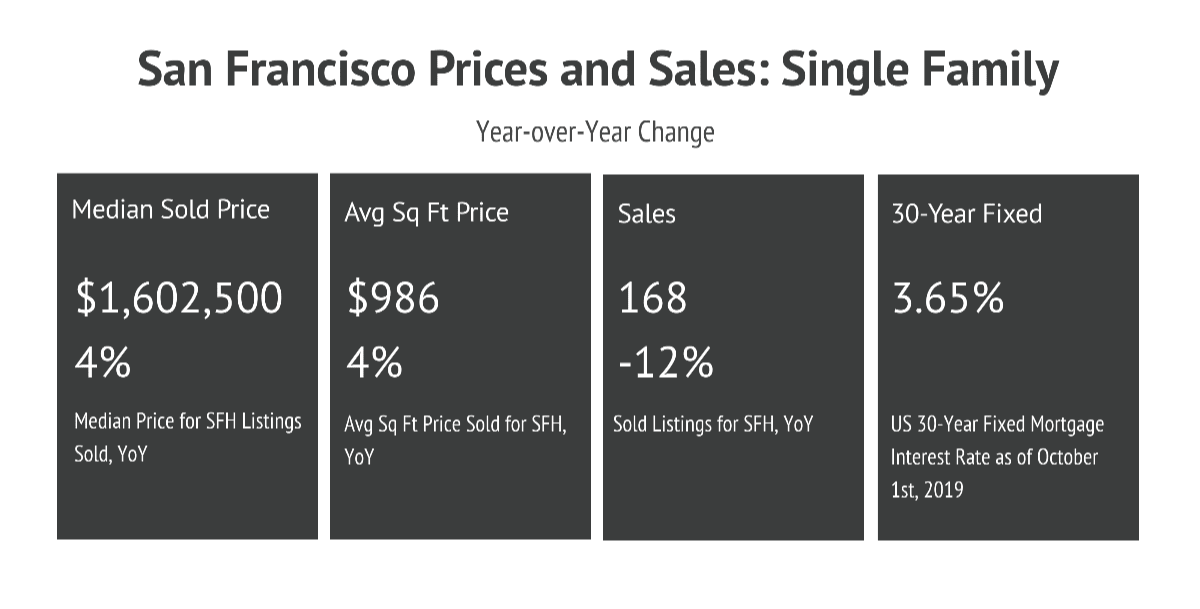
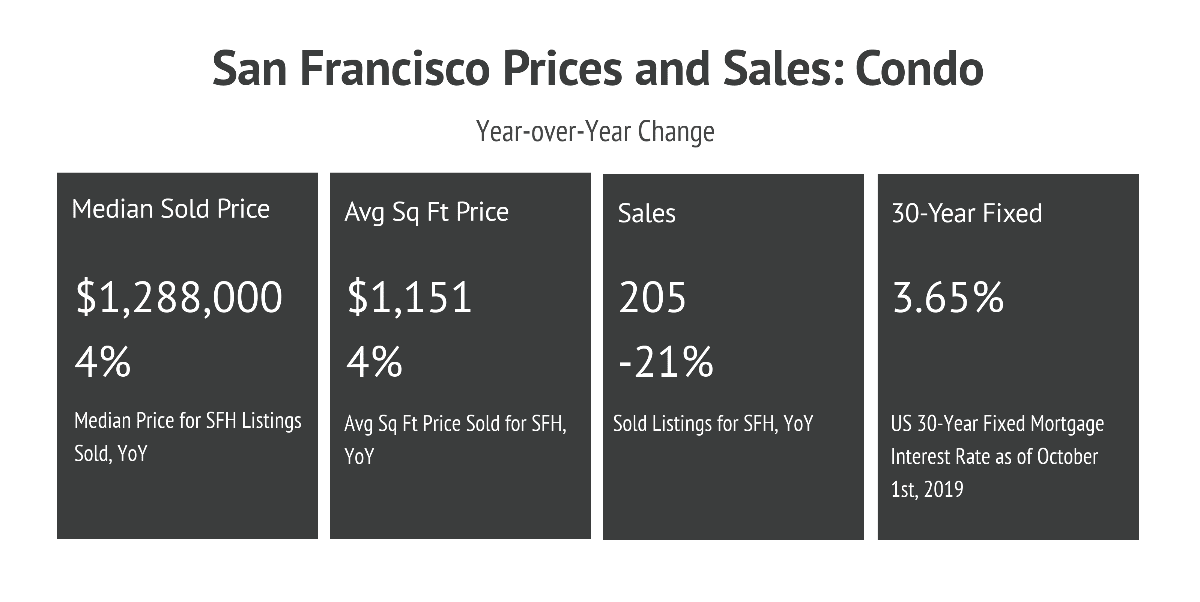
As you can see, prices and sales have been stable. Home prices will vary depending on the size of homes sold, but the price-per-square-foot indicates that prices are almost unchanged from last year. Sales remain relatively consistent, as well.
Sales for both single-family homes and condos are down from last year. As we’ve discussed in previous newsletters, one reason for this is low inventory. The chart below shows us the inventory data for both single-family homes and condos in San Francisco.
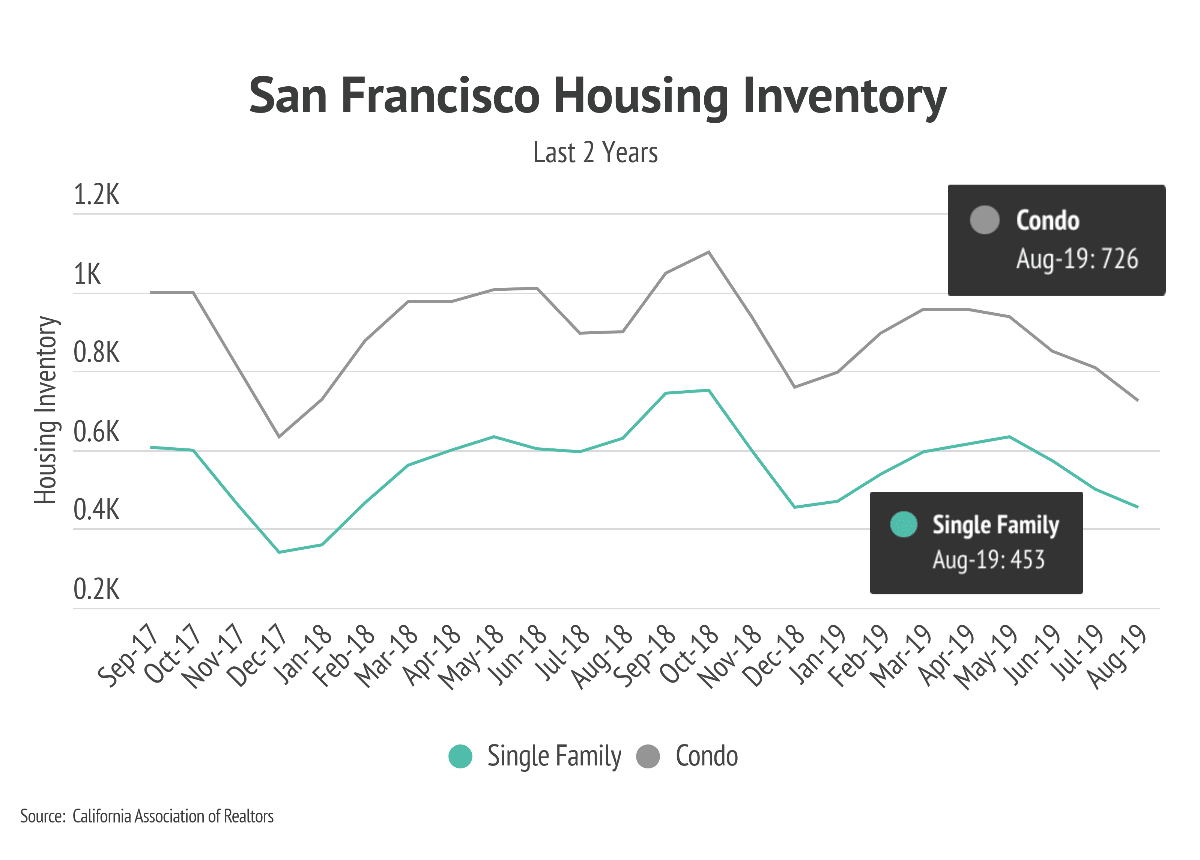
Inventory is down 18% for single-family homes and flat for condos compared to last year. For a market that already had tight inventory last year, a significant drop means there is very little choice for buyers.
September saw a slight one-month uptick in inventory for single-family homes, but the shift didn’t come close to what is needed to offset demand. Condos had a noticeable one-month increase in inventory, which brought the year-over-year inventory in line with historical norms for the month of September.
Affordability and Strategic Positioning for Buyers and Sellers
Let’s go back to the key question we’re asking this month: How does affordability (or, in this case, the lack of it) affect potential buyers and sellers?
First, it is important to remember that home prices and mortgage rates have an inverse relationship, so home prices rise when interest rates fall. Conversely, home prices decline when interest rates rise. Total cost, or affordability, often remains consistent.
If interest rates generally have a minimal impact on affordability, what else might be at play? Economic factors, specifically those that influence supply and demand, can affect affordability. One such economic indicator is unemployment, which now hovers near an all-time low.
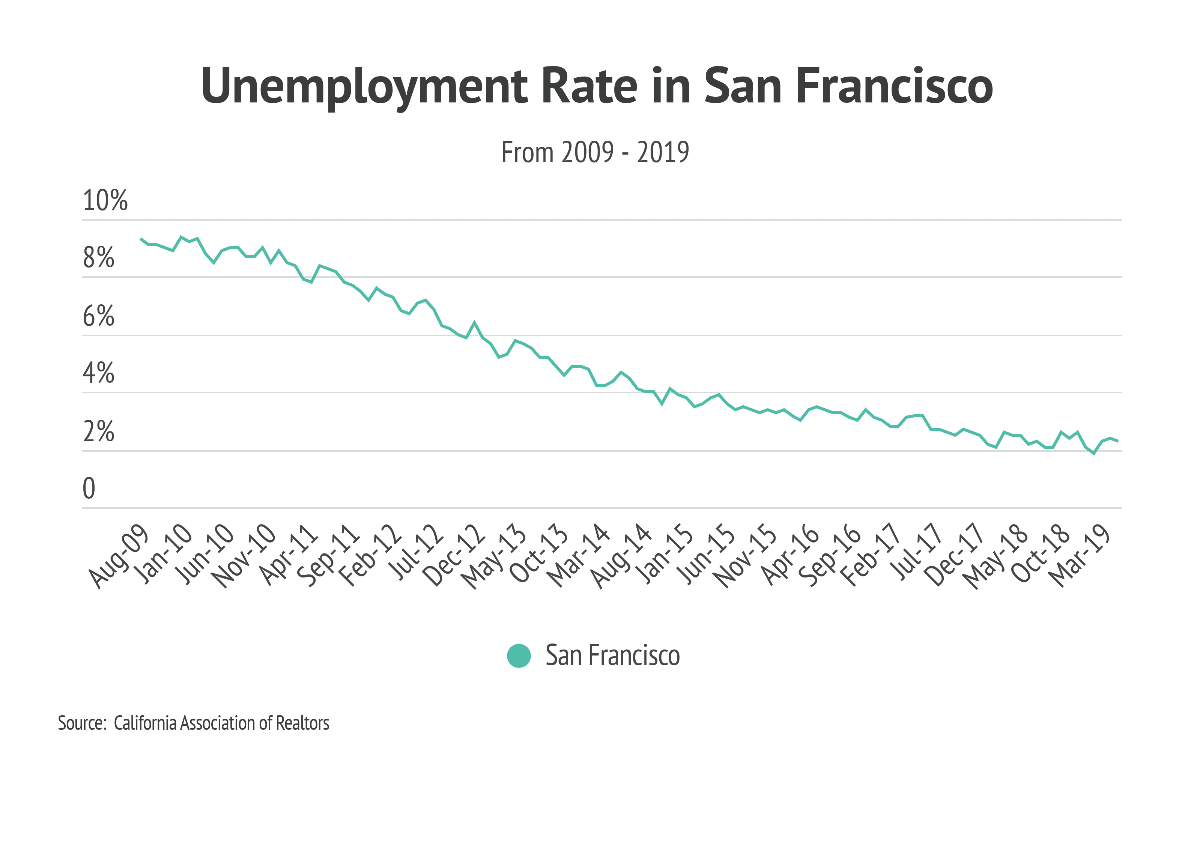
Another economic factor is new home builds, which have fallen short of demand in California for years. A final factor is household income, which has grown at a slower rate than housing prices. Any significant change to these economic factors will have an impact on affordability.
On September 26th, the California Association of Realtors shared this forecast:
“The median home price in California likely will increase by 2.5% to $607,900 in 2020, slowing from a projected 4.1% annual gain in 2019. Sales of existing single-family homes probably will gain 0.8% in 2020 to reach 393,500, following a 3.1% drop this year from 2018’s level.”
Many economists agree that there are plenty of indications the economy will be stable for the foreseeable future. For this reason, our key takeaway for this month is that even though California’s housing market faces an ongoing affordability crisis, waiting for ideal housing-market circumstances or greater affordability may not be a sound plan for potential home buyers. For homeowners thinking of selling, the current market conditions make it an excellent time to list.
A Winning Buying and Selling Strategy
To develop a winning buying and selling strategy, we can analyze four key indicators from September: the percentage of homes sold over list price, the percentage of recorded list price, the month’s supply, and the number of days on the market. With this information, we can identify whether a housing market is favorable to buyers or sellers.

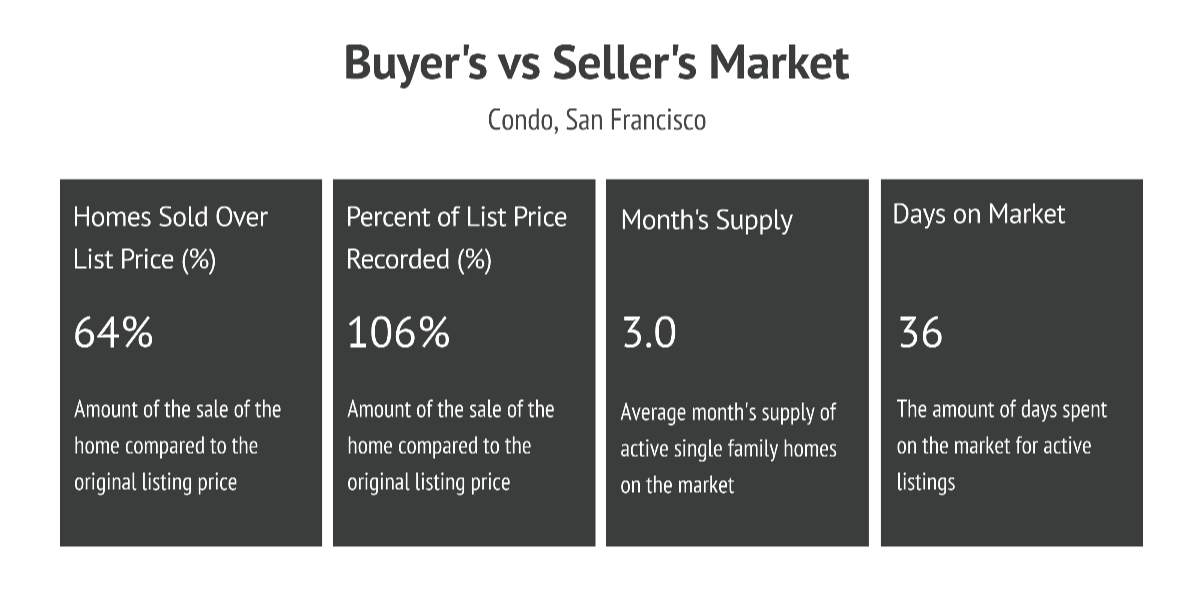
According to the numbers above, the housing market favors sellers.
First, most dwellings sold above list price. On average, single-family homes and condos sold above their list prices by 12% and 5%, respectively. Both parties should expect to negotiate offers above the original listing price.
The supply index for the month is at 1.7 and 2.8 for single-family homes and condos, which means there are 1.7 and 2.8 months of listings on the market given current sales velocity. Most analysts consider a balanced market to be around six months, so the current supply levels are very low.
With this in mind, buyers should be aware they may not find the perfect home because the market doesn’t offer much choice. Instead, they may need to imagine how a potential home will look after giving it some TLC.
With days on market of just 21 days for single-family homes and 29 days for condos, buyers will have to make decisions quickly, especially if they are not paying in cash.
Key Takeaways
Understanding the complexities of housing affordability is critical for both buyers and sellers. An experienced agent can provide key insights and guidance for navigating this important aspect of the market. We’re dedicated to helping our clients reach their real estate goals. We encourage you to contact us with questions about the current market or to request a professional evaluation of your home or condo.
Stay up to date on the latest real estate trends.

June 17, 2026
A current buyer’s guide to private listings, Coming Soon homes, Zillow Preview, agent networks, and pre-market opportunities.

June 11, 2026
Discover the cafés, tea shops, parks, and neighborhood amenities that make Dogpatch one of San Francisco's most vibrant places to live.

June 5, 2026
What San Francisco Homebuyers Need to Know Before Making an Offer

June 3, 2026
Are Home Prices Still Rising in Bernal Heights?
You’ve got questions and we can’t wait to answer them.