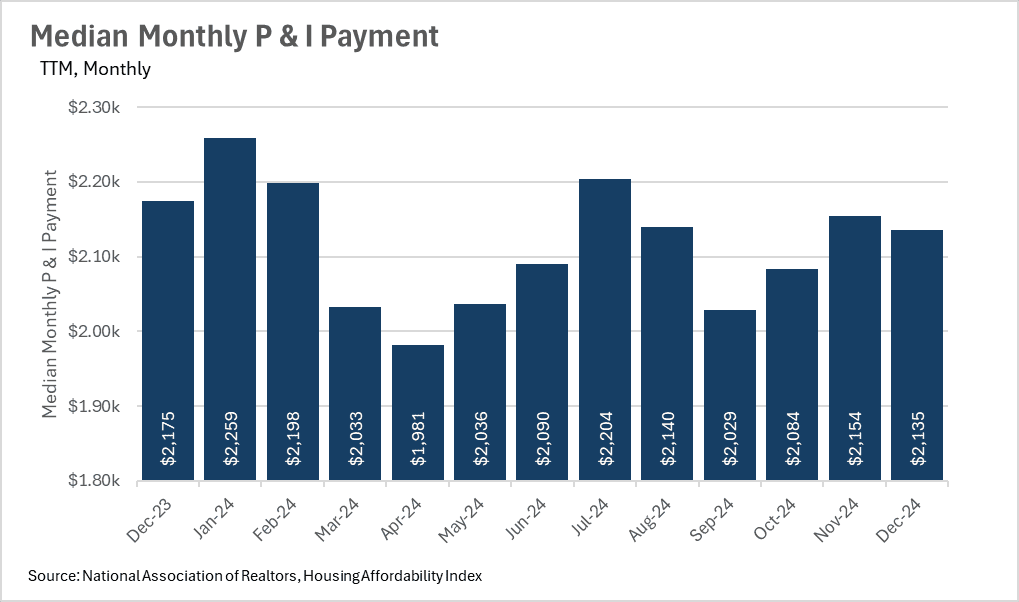
The Big Story: Median monthly P&I payment decreasing by 1.84%.
February 20, 2025

February 20, 2025
Quick Take:
Note: You can find the charts & graphs for the Big Story at the end of the following section.
*National Association of REALTORS® data is released two months behind, so we estimate the most recent month’s data when possible and appropriate.
CLICK HERE TO JUMP TO SAN FRANCISCO DATA
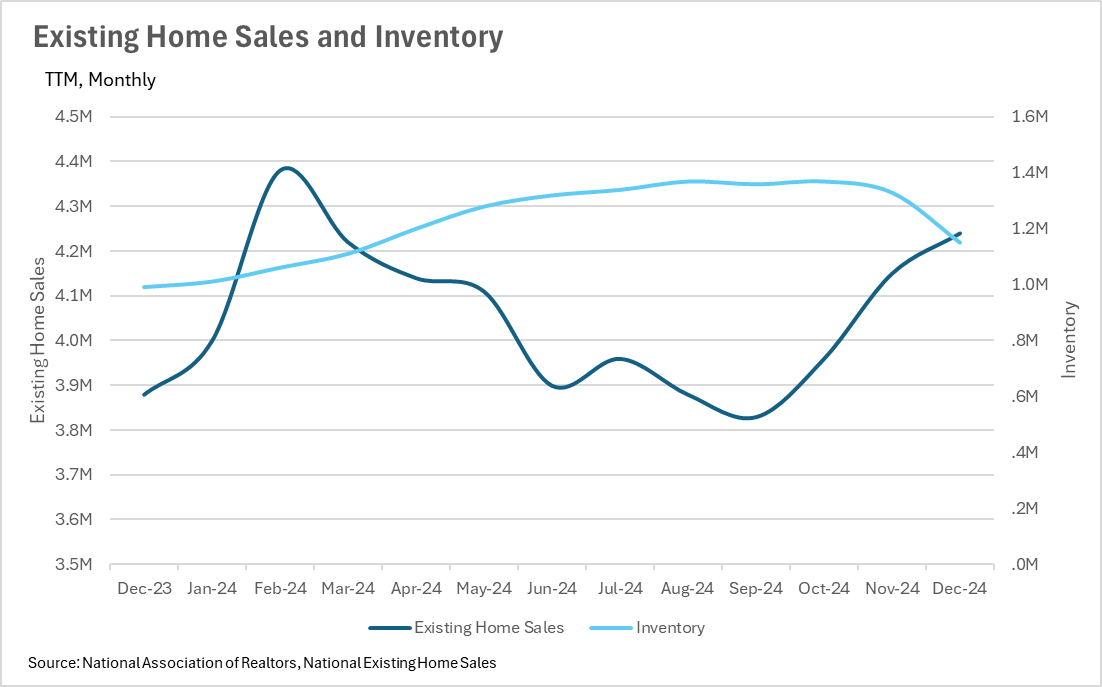
As we all know, inventory levels have been an issue Post-COVID, across the entire country, with many areas not having nearly enough inventory to support buying demand. This, in turn, helped to push up the values of homes nationwide.
It’s important to note though, that we’re beginning to see inventory growth outstrip existing home sale growth, as in December, inventory grew by 16.16% on a year-over-year basis, whereas existing home sales grew by 9.28% year-over-year.
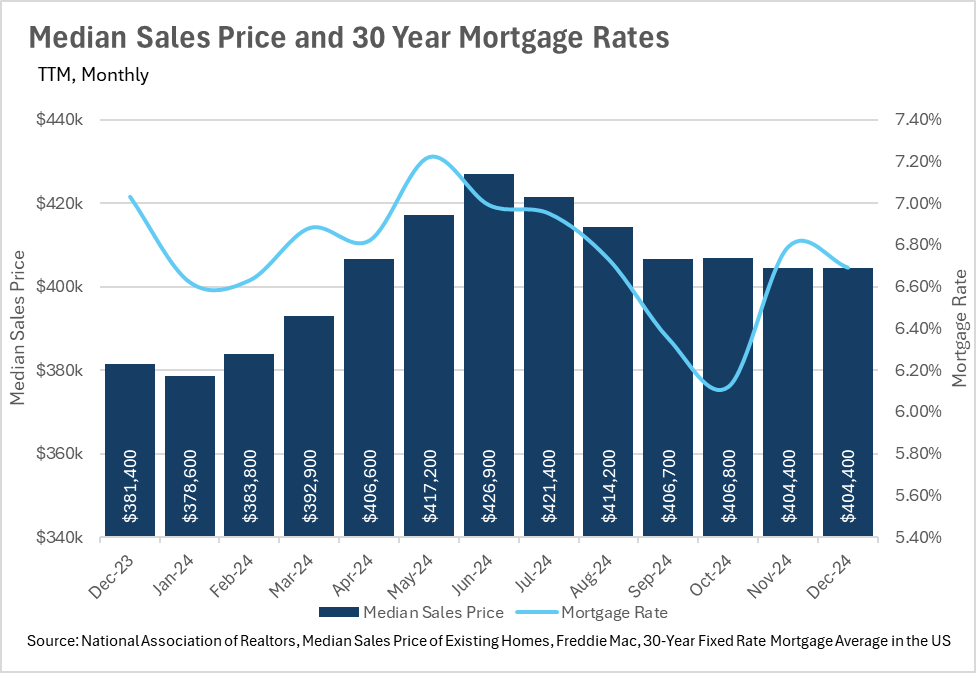
Many buyers still have the mortgage rates that they saw in 2021 and 2022 at the top of their mind, making it difficult for them to justify locking in a mortgage in the 6%-7% ranges that we’ve been seeing over the past couple of years. Despite many buyers sitting on the sidelines, and waiting for lower rates, we’re still seeing the median sale price of homes increase.
In both the months of November and December, the median sale price of a home in the United States was $404,400. This represents an increase in value of 6.03%, when compared to the December 2023 median sale price of $381,400. This is slightly concerning, given that the growth in median sales price continues to outstrip the growth in inflation, with December’s year-over-year CPI figures coming in at 2.9%.
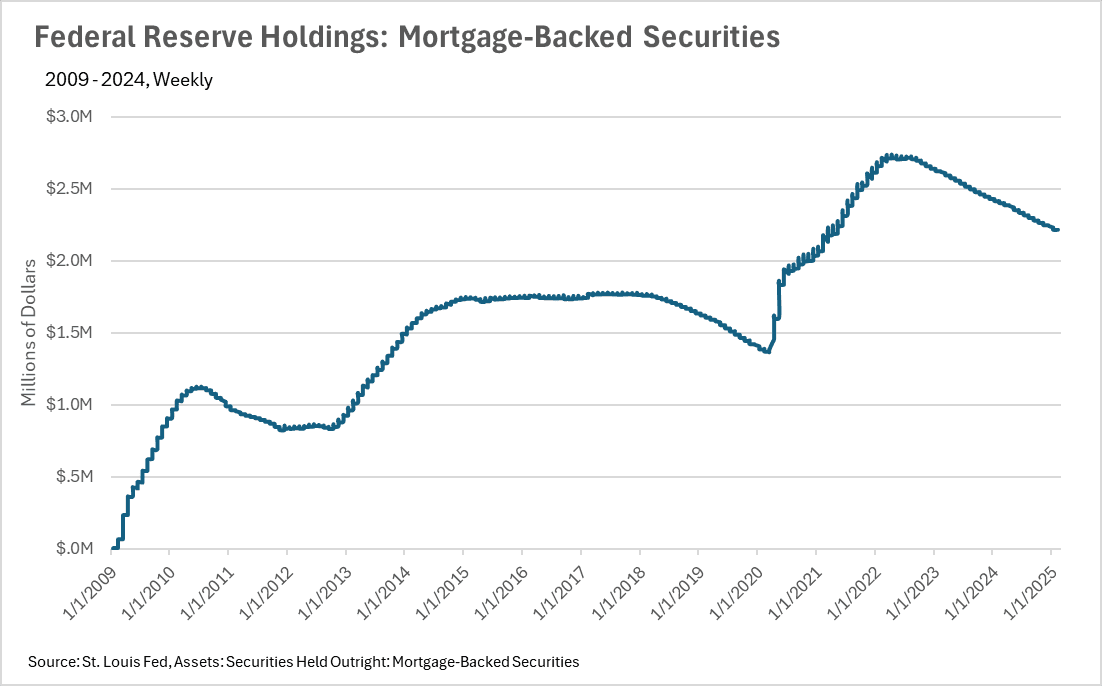
As many of us know, in addition to the Federal Funds Rate, the Fed also has control over its own balance sheet. Throughout the COVID crisis, the Fed ramped up its purchase of mortgage backed securities at a rate we haven’t seen since the Great Financial Crisis. However, the Fed has since been unwinding its holdings of MBS’s at a steady rate, since late 2022, which it continues to this day.
Although it’s great to know what’s happening at a national level, real estate is an incredibly localized industry. There are areas throughout the country that are doing considerably better or worse than the nation at large. To ensure you’re informed on the happenings at both a national level and a local level, we’ve included our local lowdown below. In our local lowdown, you’ll find the in-depth coverage you need to stay in tune with your area. As always, we’ll be monitoring the housing market and the economy from both a macro and micro level, and report back to ensure you’ve got the data you need to make the best decisions possible!
Note: You can find the charts/graphs for the Local Lowdown at the end of this section.
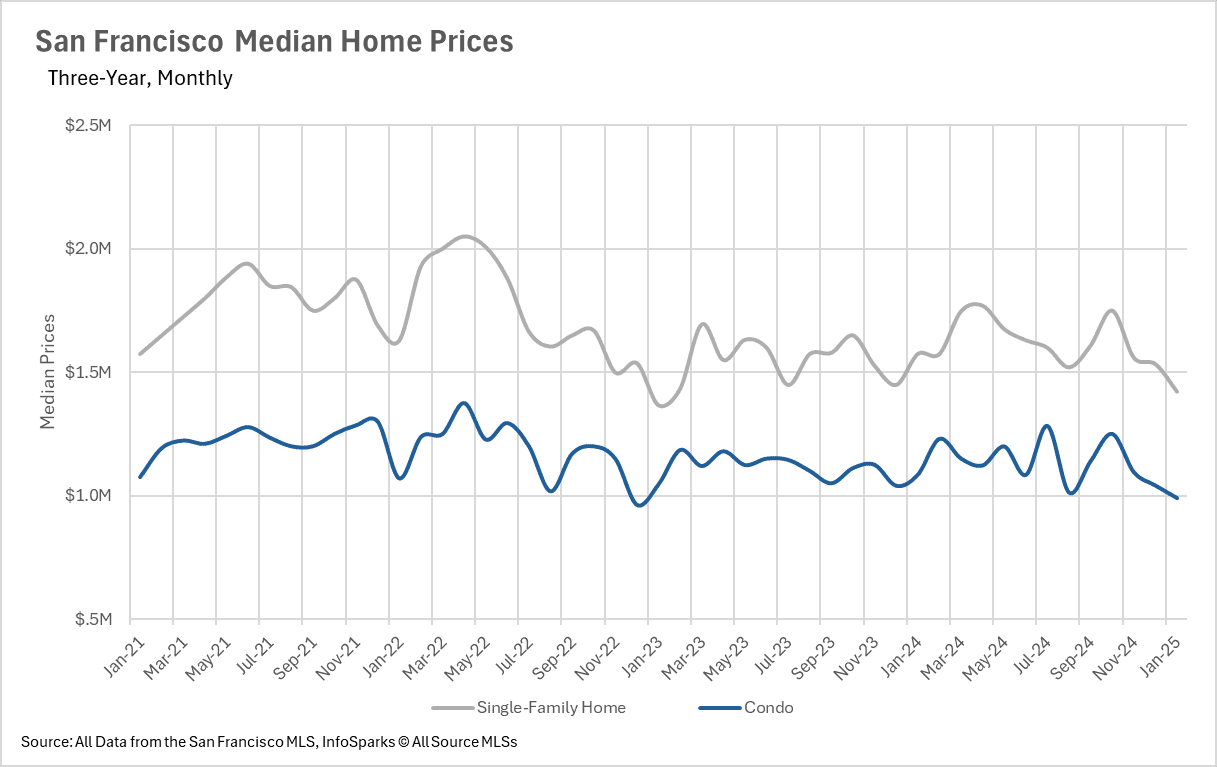
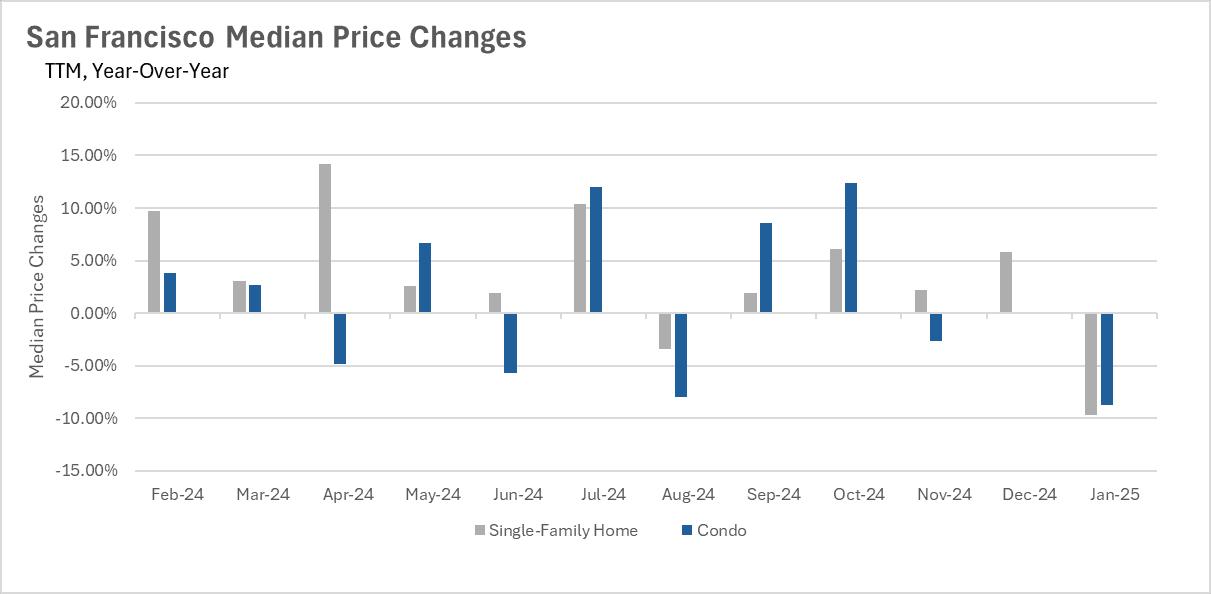
While median sale prices were holding steady throughout the fourth quarter, despite rising interest rates, we saw a considerable fall in the month of January. The median single-family home sale price fell by 9.68% to $1,422,500. Whereas the median condo sale price fell 8.76%, to $990,000. Despite relative strength post-rate cuts in the San Francisco market, prices are starting to tick back down to reflect the increased costs of borrowing.
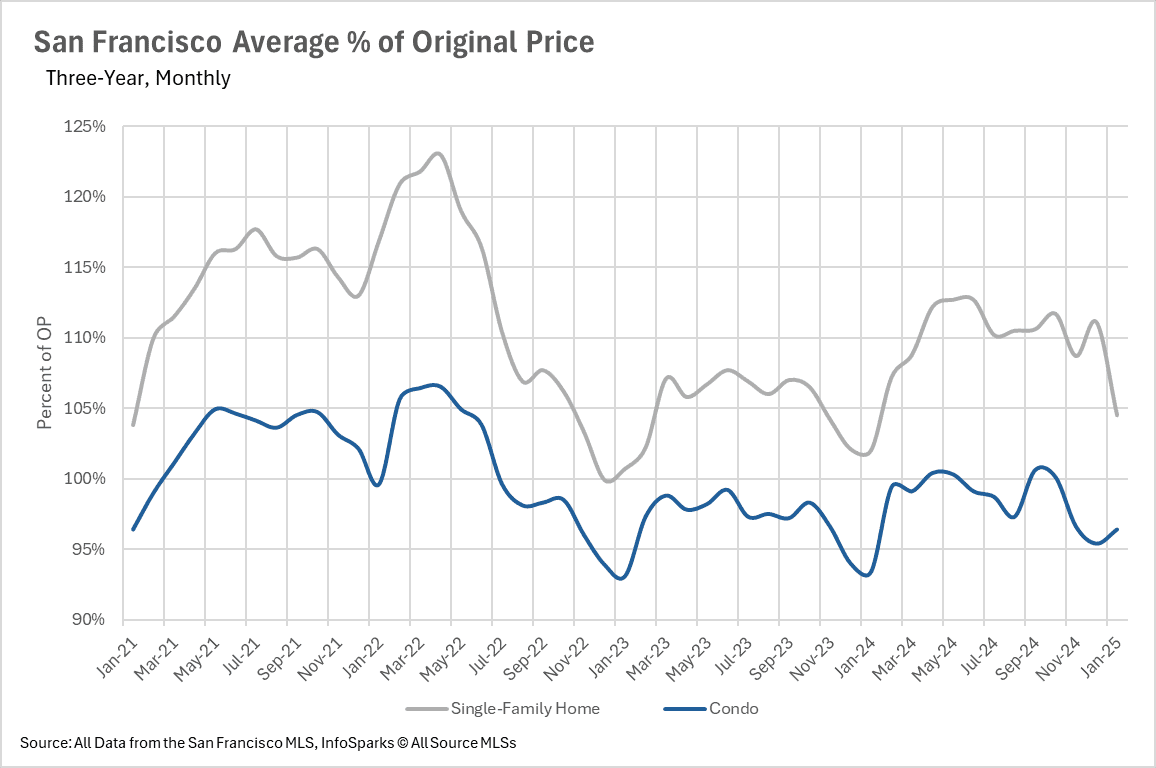
There’s a rather interesting phenomenon happening in San Francisco. If we were to tell you that the median sale price for homes dropped by nearly 10% on a year-over-year basis, you might assume that homes are selling for less than asking. However, that’s not the case in San Francisco. While the median condo is selling for slightly less than asking and fetching roughly 96% of its original price, the median single-family home is still fetching 105% of its original asking price. Despite the fact that prices fell a bit in January, by no means is the San Francisco market weak!
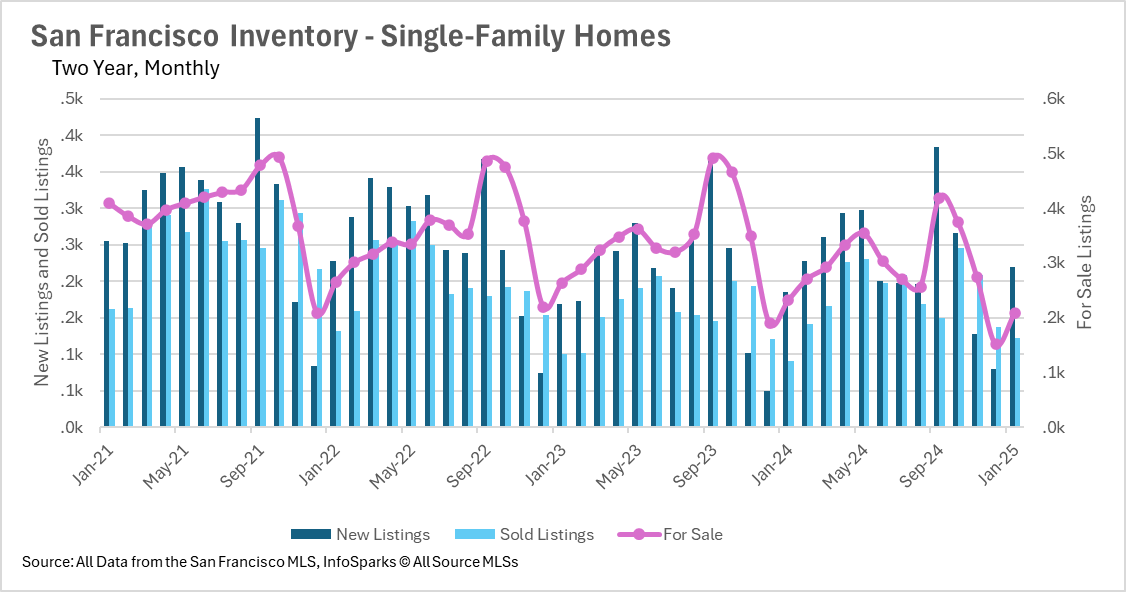
When determining whether a market is a buyers’ market or a sellers’ market, we look to the Months of Supply Inventory (MSI) metric. The state of California has historically averaged around three months of MSI, so any area with at or around three months of MSI is considered a balanced market. Any market that has lower than three months of MSI is considered a sellers’ market, whereas markets with more than three months of MSI are considered buyers’ markets.
With just 1.1 months worth of single-family homes and 2.8 months worth of condos available for sale at this point in time, the entire San Francisco market has become a sellers’ market. The slow trickle of supply that we’re seeing simply can’t keep up with the overwhelming demand we’re seeing in the market, making it tough to strike a deal!
Stay up to date on the latest real estate trends.

June 11, 2026
Discover the cafés, tea shops, parks, and neighborhood amenities that make Dogpatch one of San Francisco's most vibrant places to live.

June 5, 2026
What San Francisco Homebuyers Need to Know Before Making an Offer

June 3, 2026
Are Home Prices Still Rising in Bernal Heights?

June 1, 2026
Are Home Prices Rising in Pacifica? How Fast Are Homes Selling? Here's What the Data Shows.
You’ve got questions and we can’t wait to answer them.