Pacifica Real Estate Market Update November 2024
December 2, 2024

December 2, 2024
In November there were 18 home sales in Pacifica. Closed listings range in price from $695,000 to $1,660,000. The closed listings had a median price per square foot of $764.57 and median days on the market of 27.
**To better illustrate market trends, the graphs below represent a rolling 3 months of data. The charts at the bottom are monthly and real-time stats.
| Active | Pending | Closed | Other | Total |
|---|---|---|---|---|
| 5 | 12 | 18 | 10 | 45 |
| Minimum | Average | Median | Maximum | Tot. Val. | |
|---|---|---|---|---|---|
| 2 | 3 | 3 | 5 | ||
| 1 | 2 | 2 | 4 | ||
| 840 | 1,534 | 1,430 | 2,829 | ||
| 0.01 | 0.41 | 0.13 | 9.03 | ||
| 647 | 18,014 | 5,497 | 393,182 | ||
| 1940 | 1968 | 1965 | 2007 | ||
| $695,000 | $1,258,542 | $1,250,000 | $1,900,000 | ||
| $450.23 | $852.97 | $811.06 | $1,345.19 | ||
| $695,000 | $1,165,167 | $1,175,001 | $1,660,000 | $20,973,001 | |
| $579.71 | $850.29 | $764.57 | $1,411.54 | ||
| 1 | 34 | 27 | 169 | ||
| 1 | 38 | 27 | 169 |
| # of Listings | % of Total | SP % LP | |
|---|---|---|---|
| 10 | 55 | 104.22 | |
| 6 | 33 | 98.68 | |
| 1 | 5 | 100.00 | |
| 1 | 5 | 100.17 | |
| 0 | 0 | ||
| 18 | 100 | 100.77 |
| # of Listings | % of Total | SP % LP | |
|---|---|---|---|
| 9 | 50.00 | 105.31 | |
| 6 | 33.33 | 98.68 | |
| 1 | 5.56 | 100.00 | |
| 1 | 5.56 | 100.17 | |
| 1 | 5.56 | 96.25 | |
| 18 | 100 | 100.08 |
Stay up to date on the latest real estate trends.
July 2, 2026
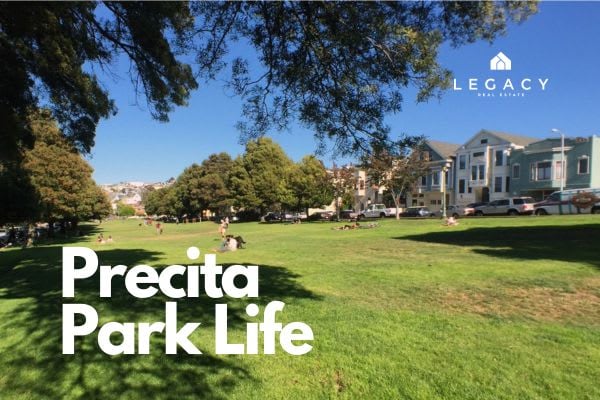
Discovering the History and Charm of Precita Park in Bernal Heights

July 1, 2026
Balboa Park, Cayuga Playground, Sunnyside Playground, and the everyday outdoor spaces that make Mission Terrace feel connected, active, and livable.
June 24, 2026
Download our Free Guide

June 24, 2026
Home Prices Surge Past $2.2 Million as Inventory Remains Critically Low
You’ve got questions and we can’t wait to answer them.