September 2025 Housing Market Update
September 23, 2025

September 23, 2025
The Big Story
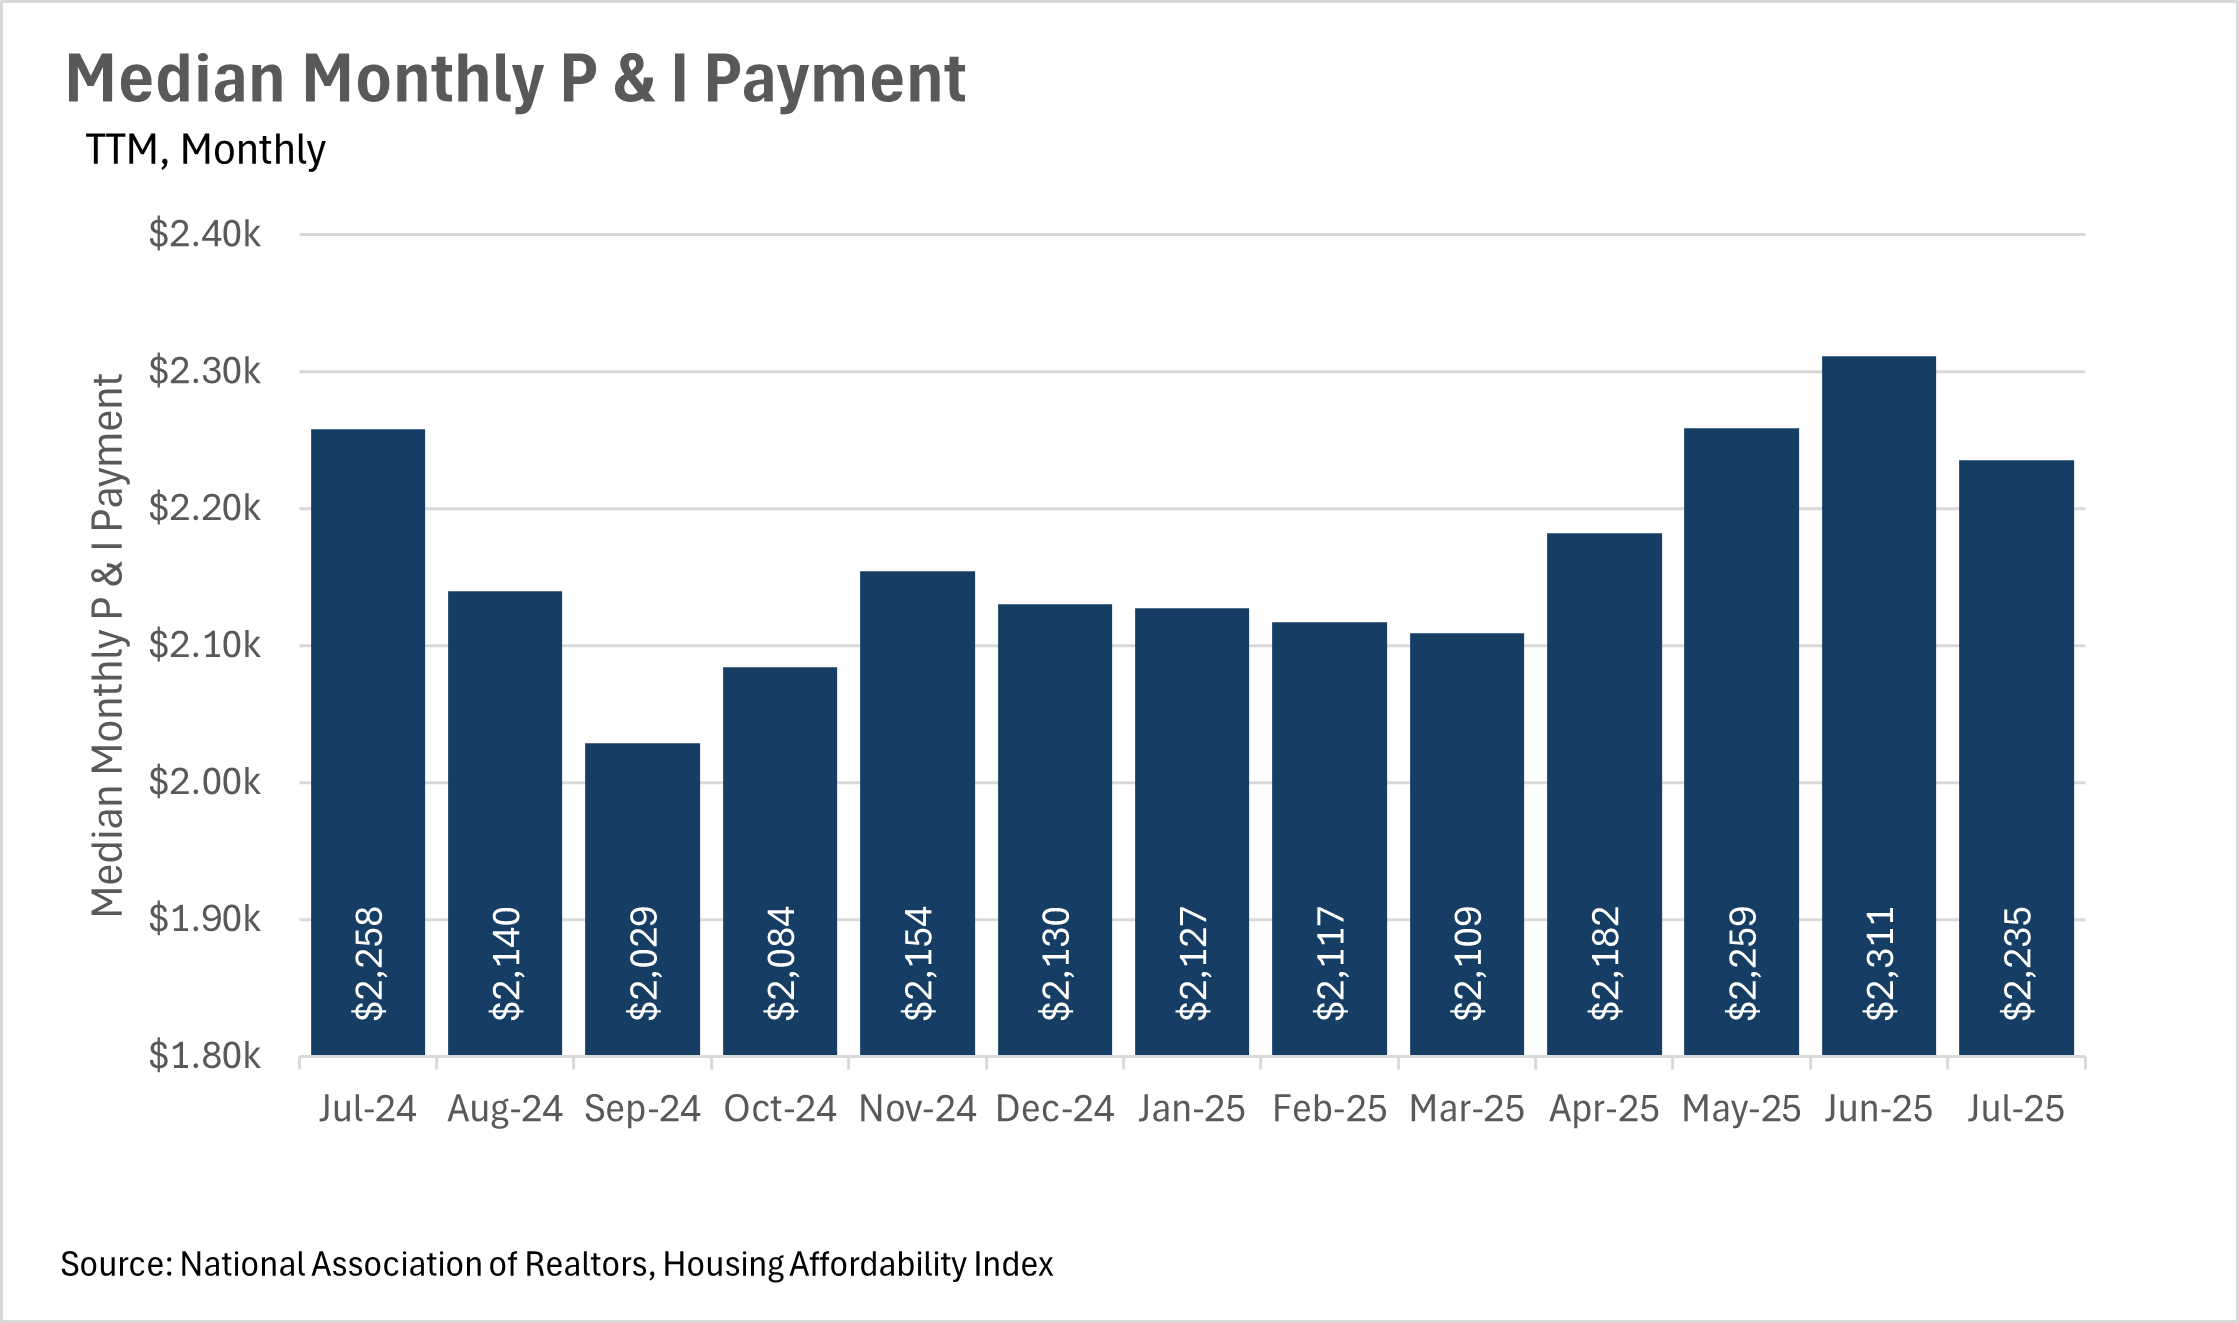
At $2,235 per month in principal and interest payments for the median homeowner, housing costs are near the highest points we’ve seen in the last year. As we all know, this is driven primarily by the fact that interest rates have remained high for quite some time, and home prices have not fallen by much over the past few years. However, existing homeowners might be able to save some money in the coming years/months, as Federal Reserve Chairman Jerome Powell mentioned in his speech at Jackson Hole that the Fed is keen on cutting rates in the near term. This, of course, would translate into lower P&I payments for new and existing homeowners alike.
As we mentioned in the previous section, the Fed Chairman mentioned in a speech at Jackson Hole that we’re likely to see cuts to the federal funds rate in the not-so-distant future, which would, of course, be great for the largely stagnant housing market that we’ve been in recent months/years. For prospective buyers, now might be a great time to lock in a great home at a relatively low price. If real estate values perform the same way as the last time we saw substantial decreases to mortgage rates, now might be an opportune time to lock in a home before values surge, then refinance once rates have bottomed out!
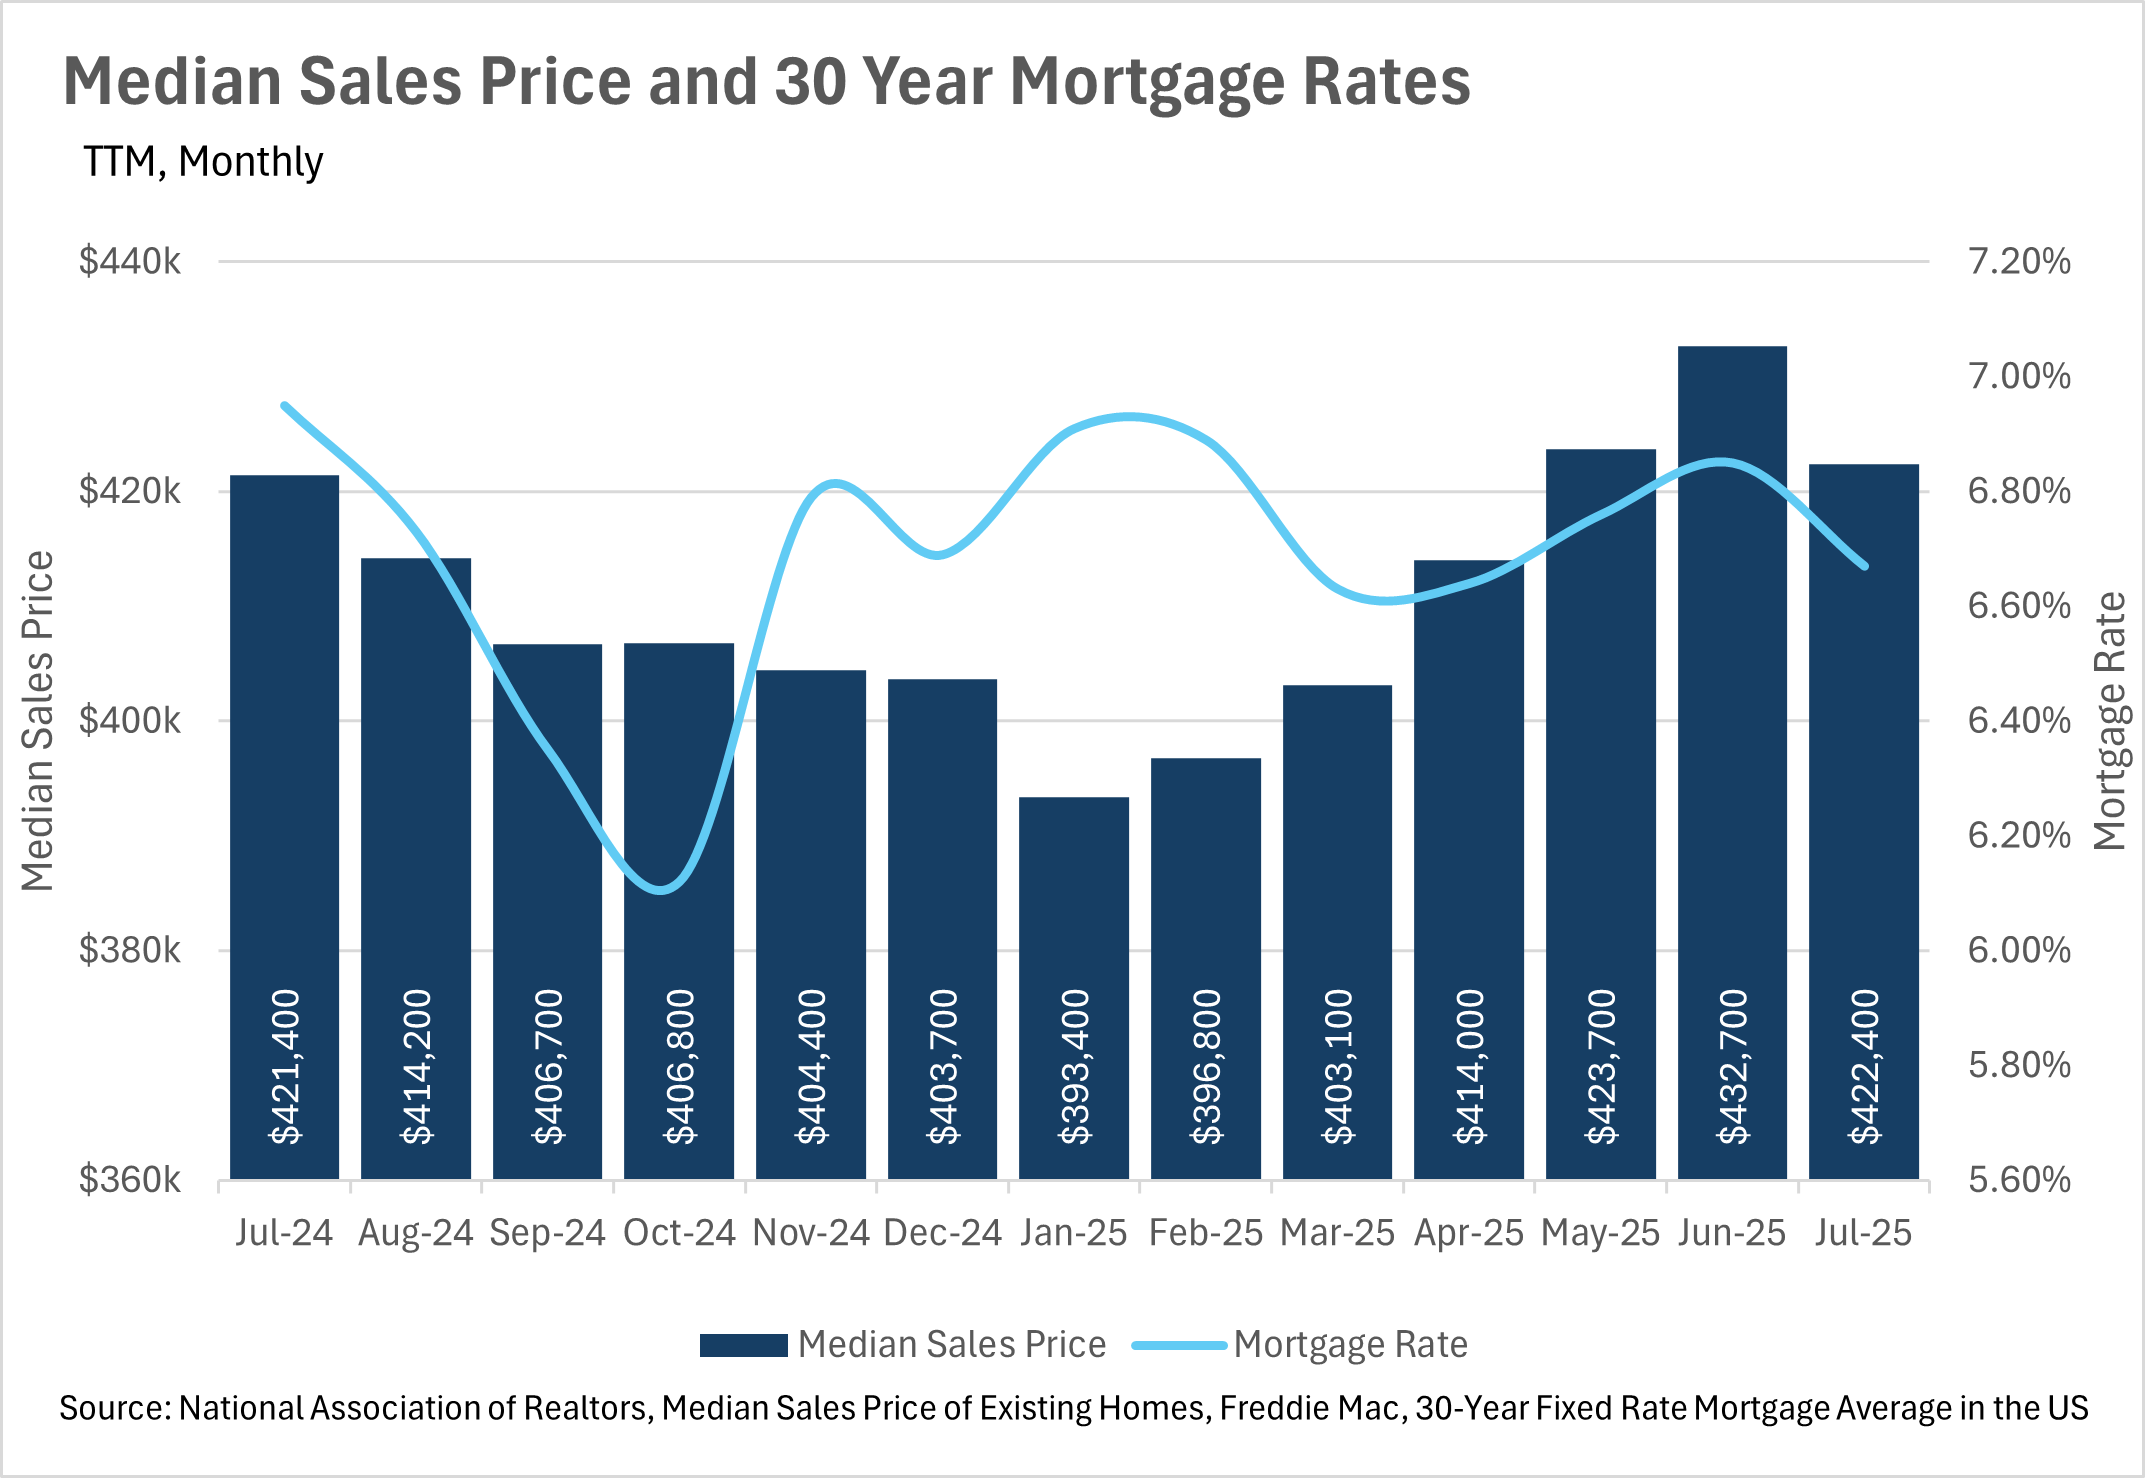
Although mortgage rates were in the mid to high-6% range throughout July and August, they’ve started to come down since the Fed Chairman’s speech. At the time of writing this newsletter, the average mortgage rate was 6.35%, according to Freddie Mac. Although this likely represents the market pricing in the rate cut before it even happens, if the Fed is entering a rate-cutting cycle, then there will be more rate cuts to come. If you want to keep an eye on where mortgage rates are going, then it’s particularly important to pay attention to any commentary out of the Fed, as well as economic data that’s published surrounding employment and inflation, as the mandate of the Fed is to control inflation and promote healthy employment.
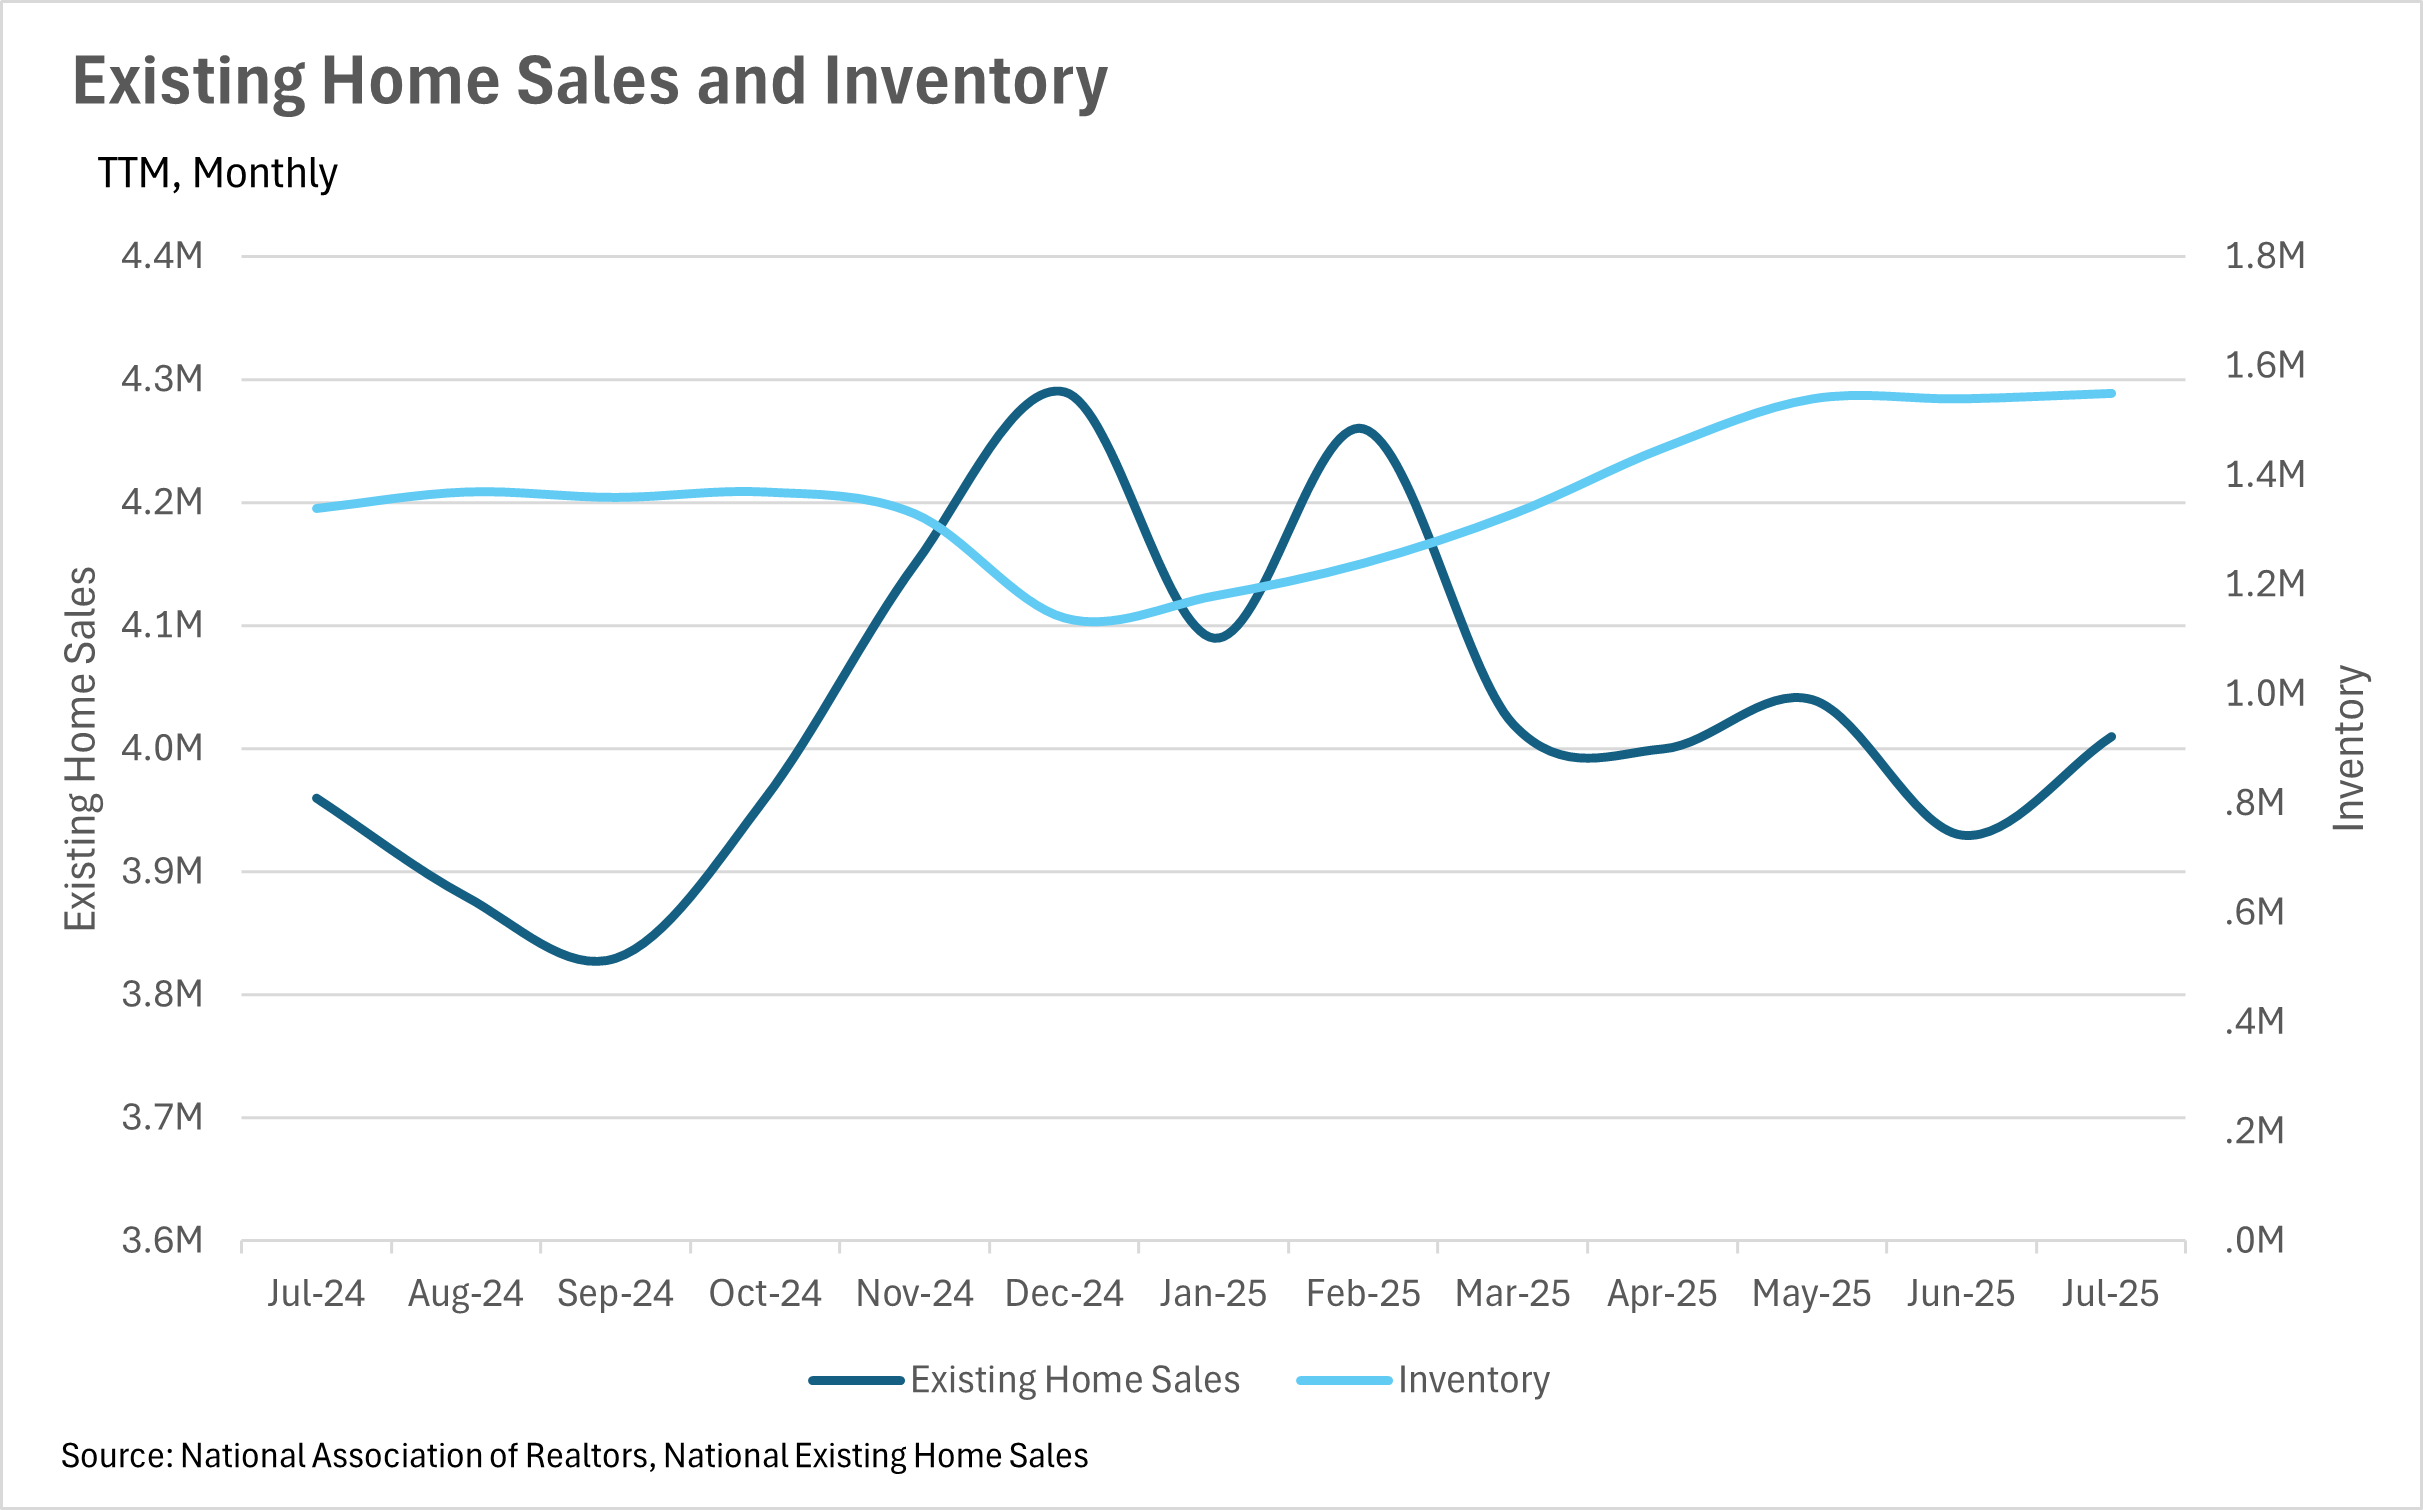
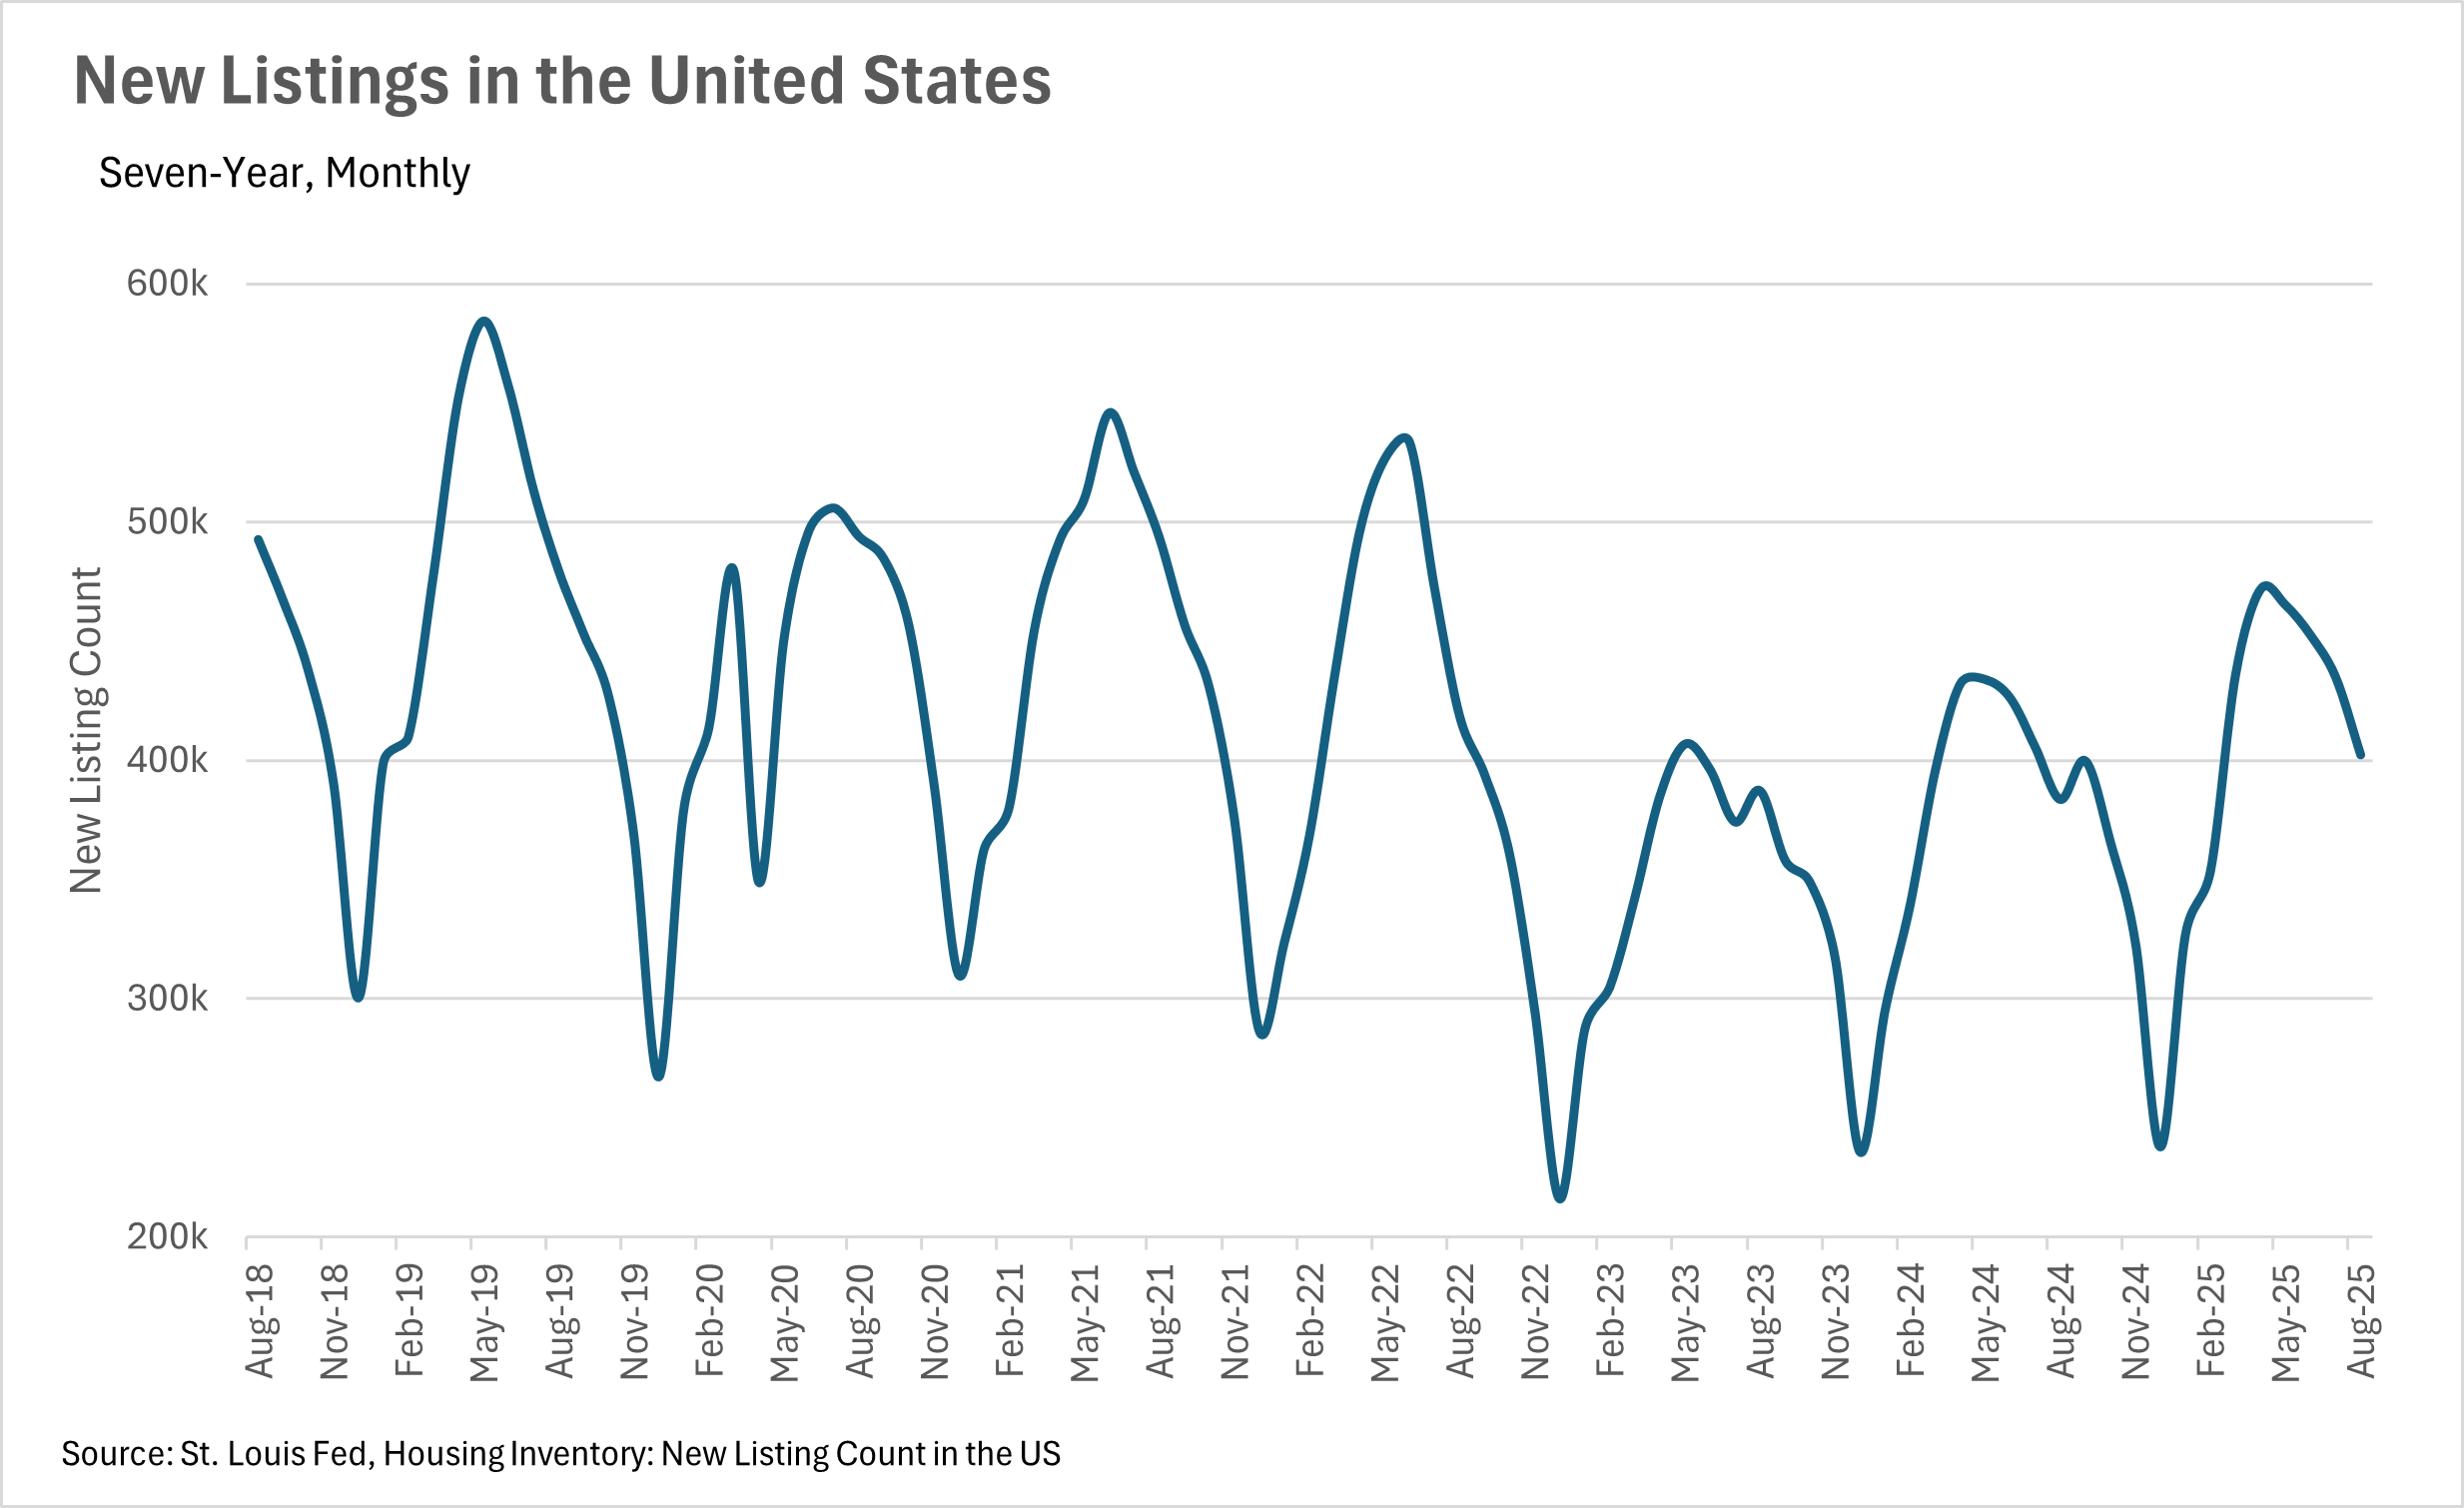
Over the course of the past few months, we’ve seen inventories remain at an elevated level on a year-over-year basis. However, with the recent drop in interest rates and the prospect of lower interest rates in the near-term future, we might see some of the built-up inventory begin to move, as housing becomes more affordable. Over the coming months, it’ll be important to pay attention to inventory levels, as they’re often leading indicators of price movements over time!
It’s important to note, though, that all of this is just what we’re seeing at a national level. To learn more about your local market, be sure to check out the Local Lowdown below:
Note: You can find the charts/graphs for the Local Lowdown at the end of this section.
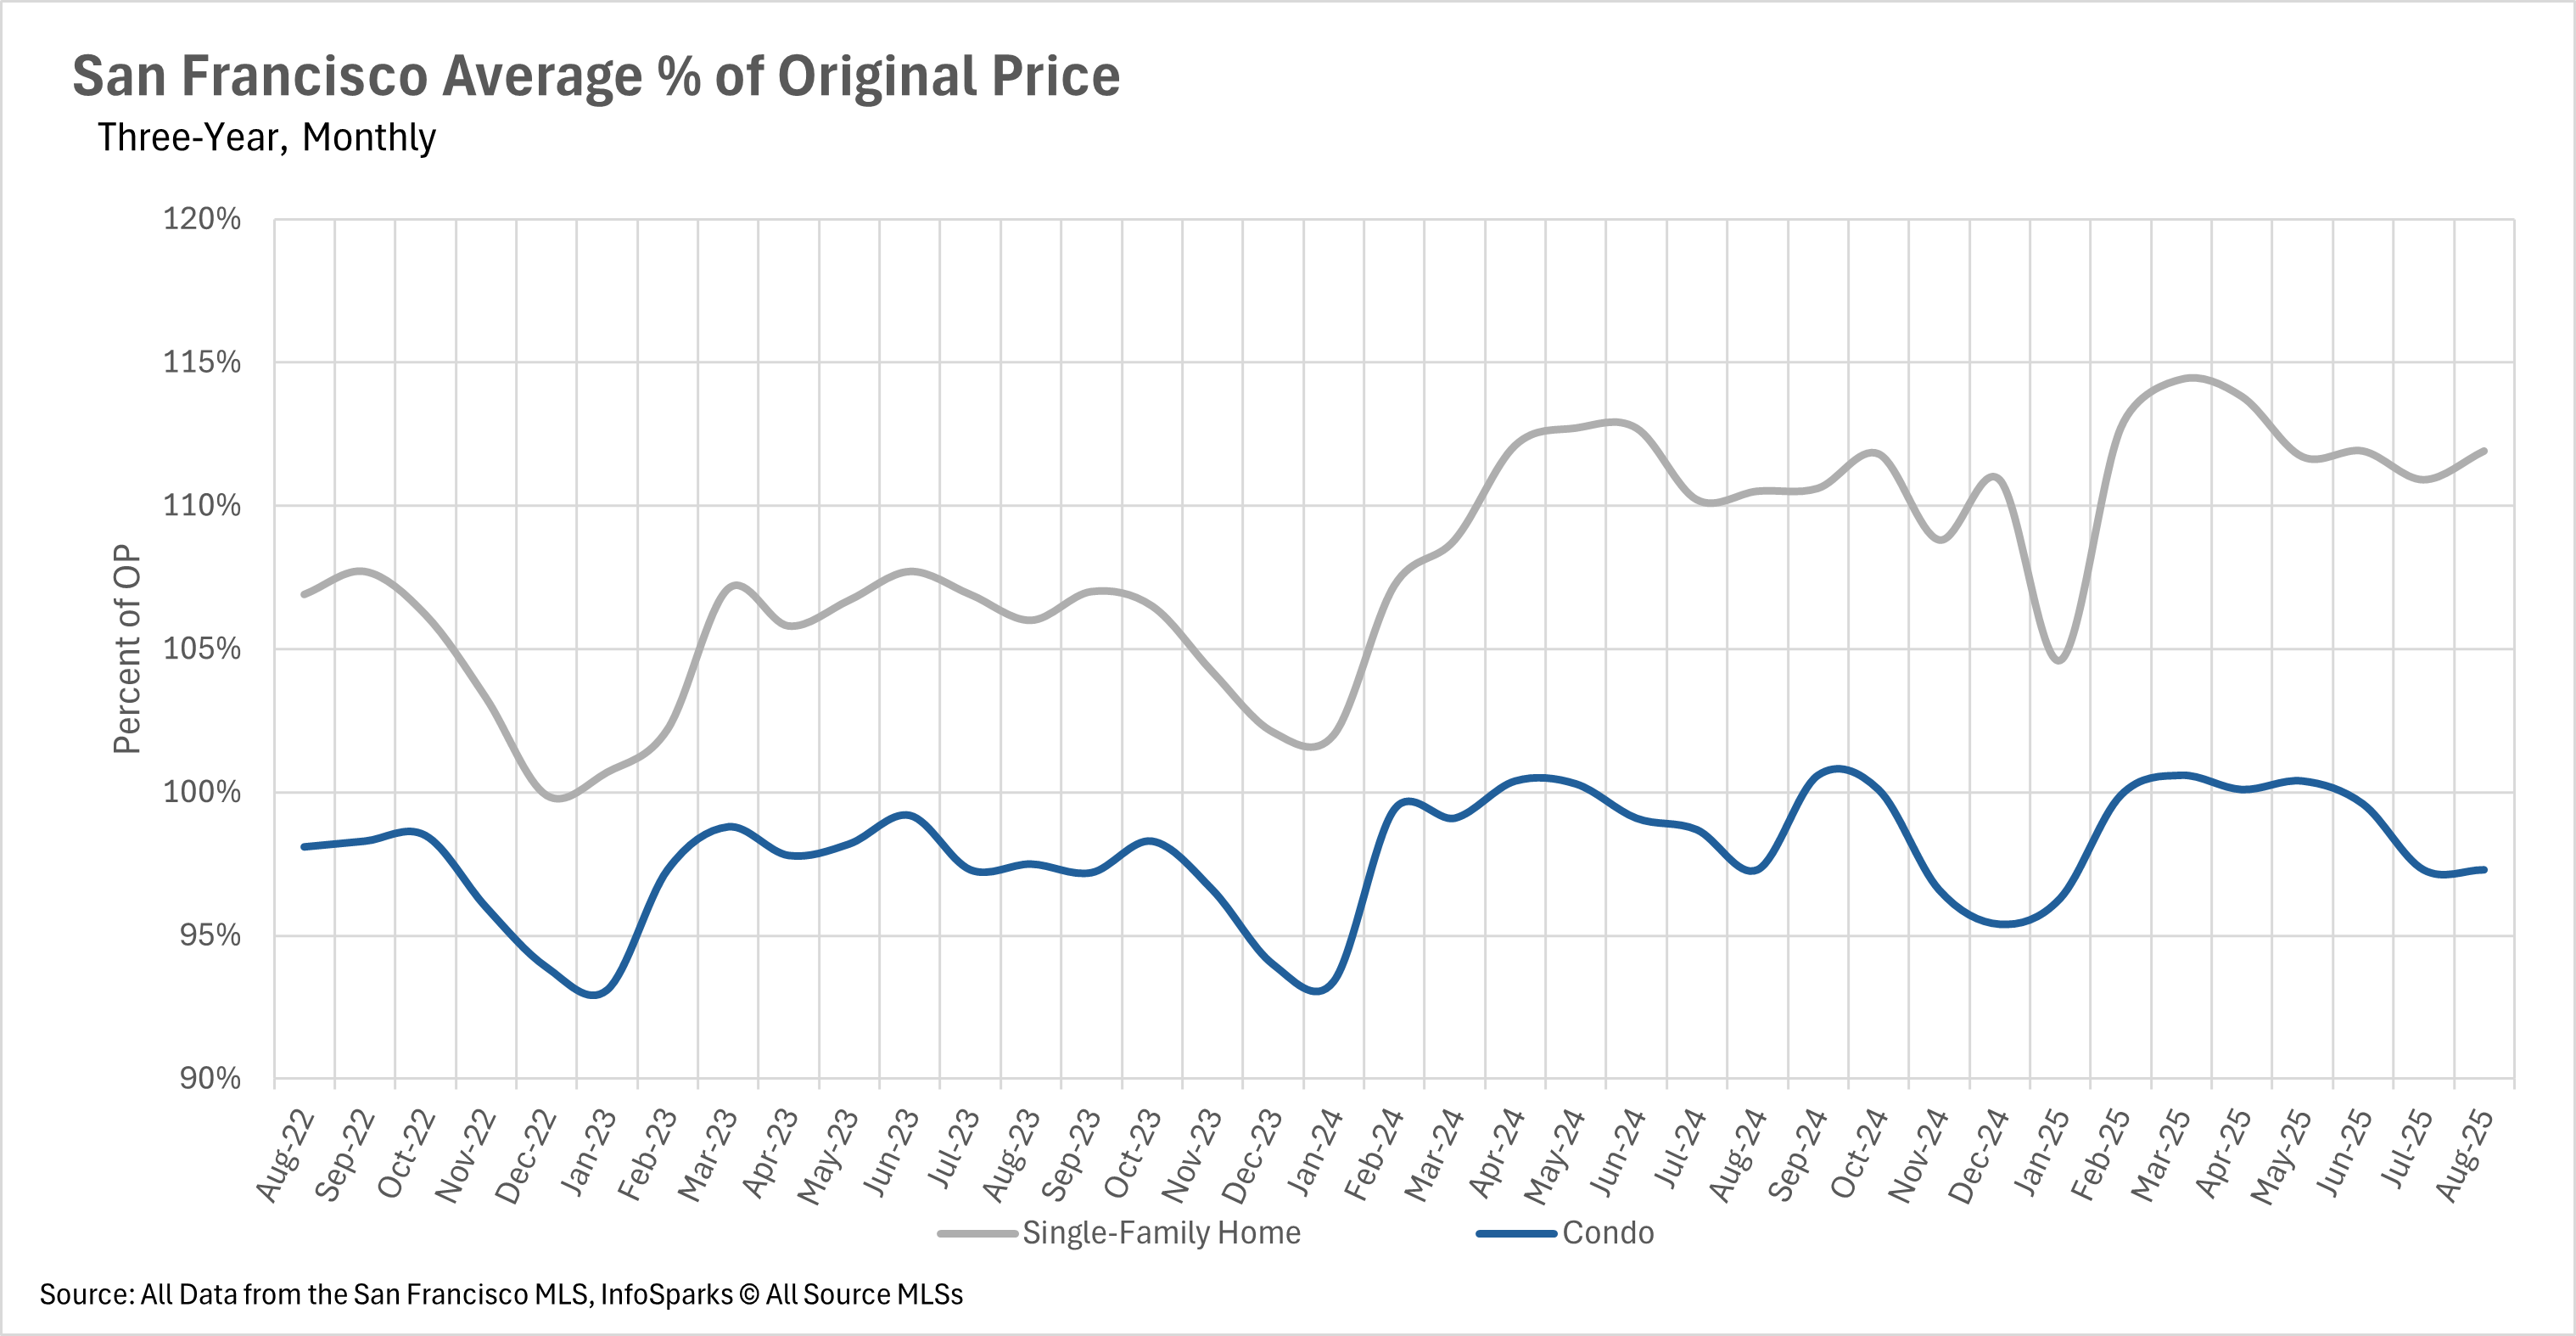
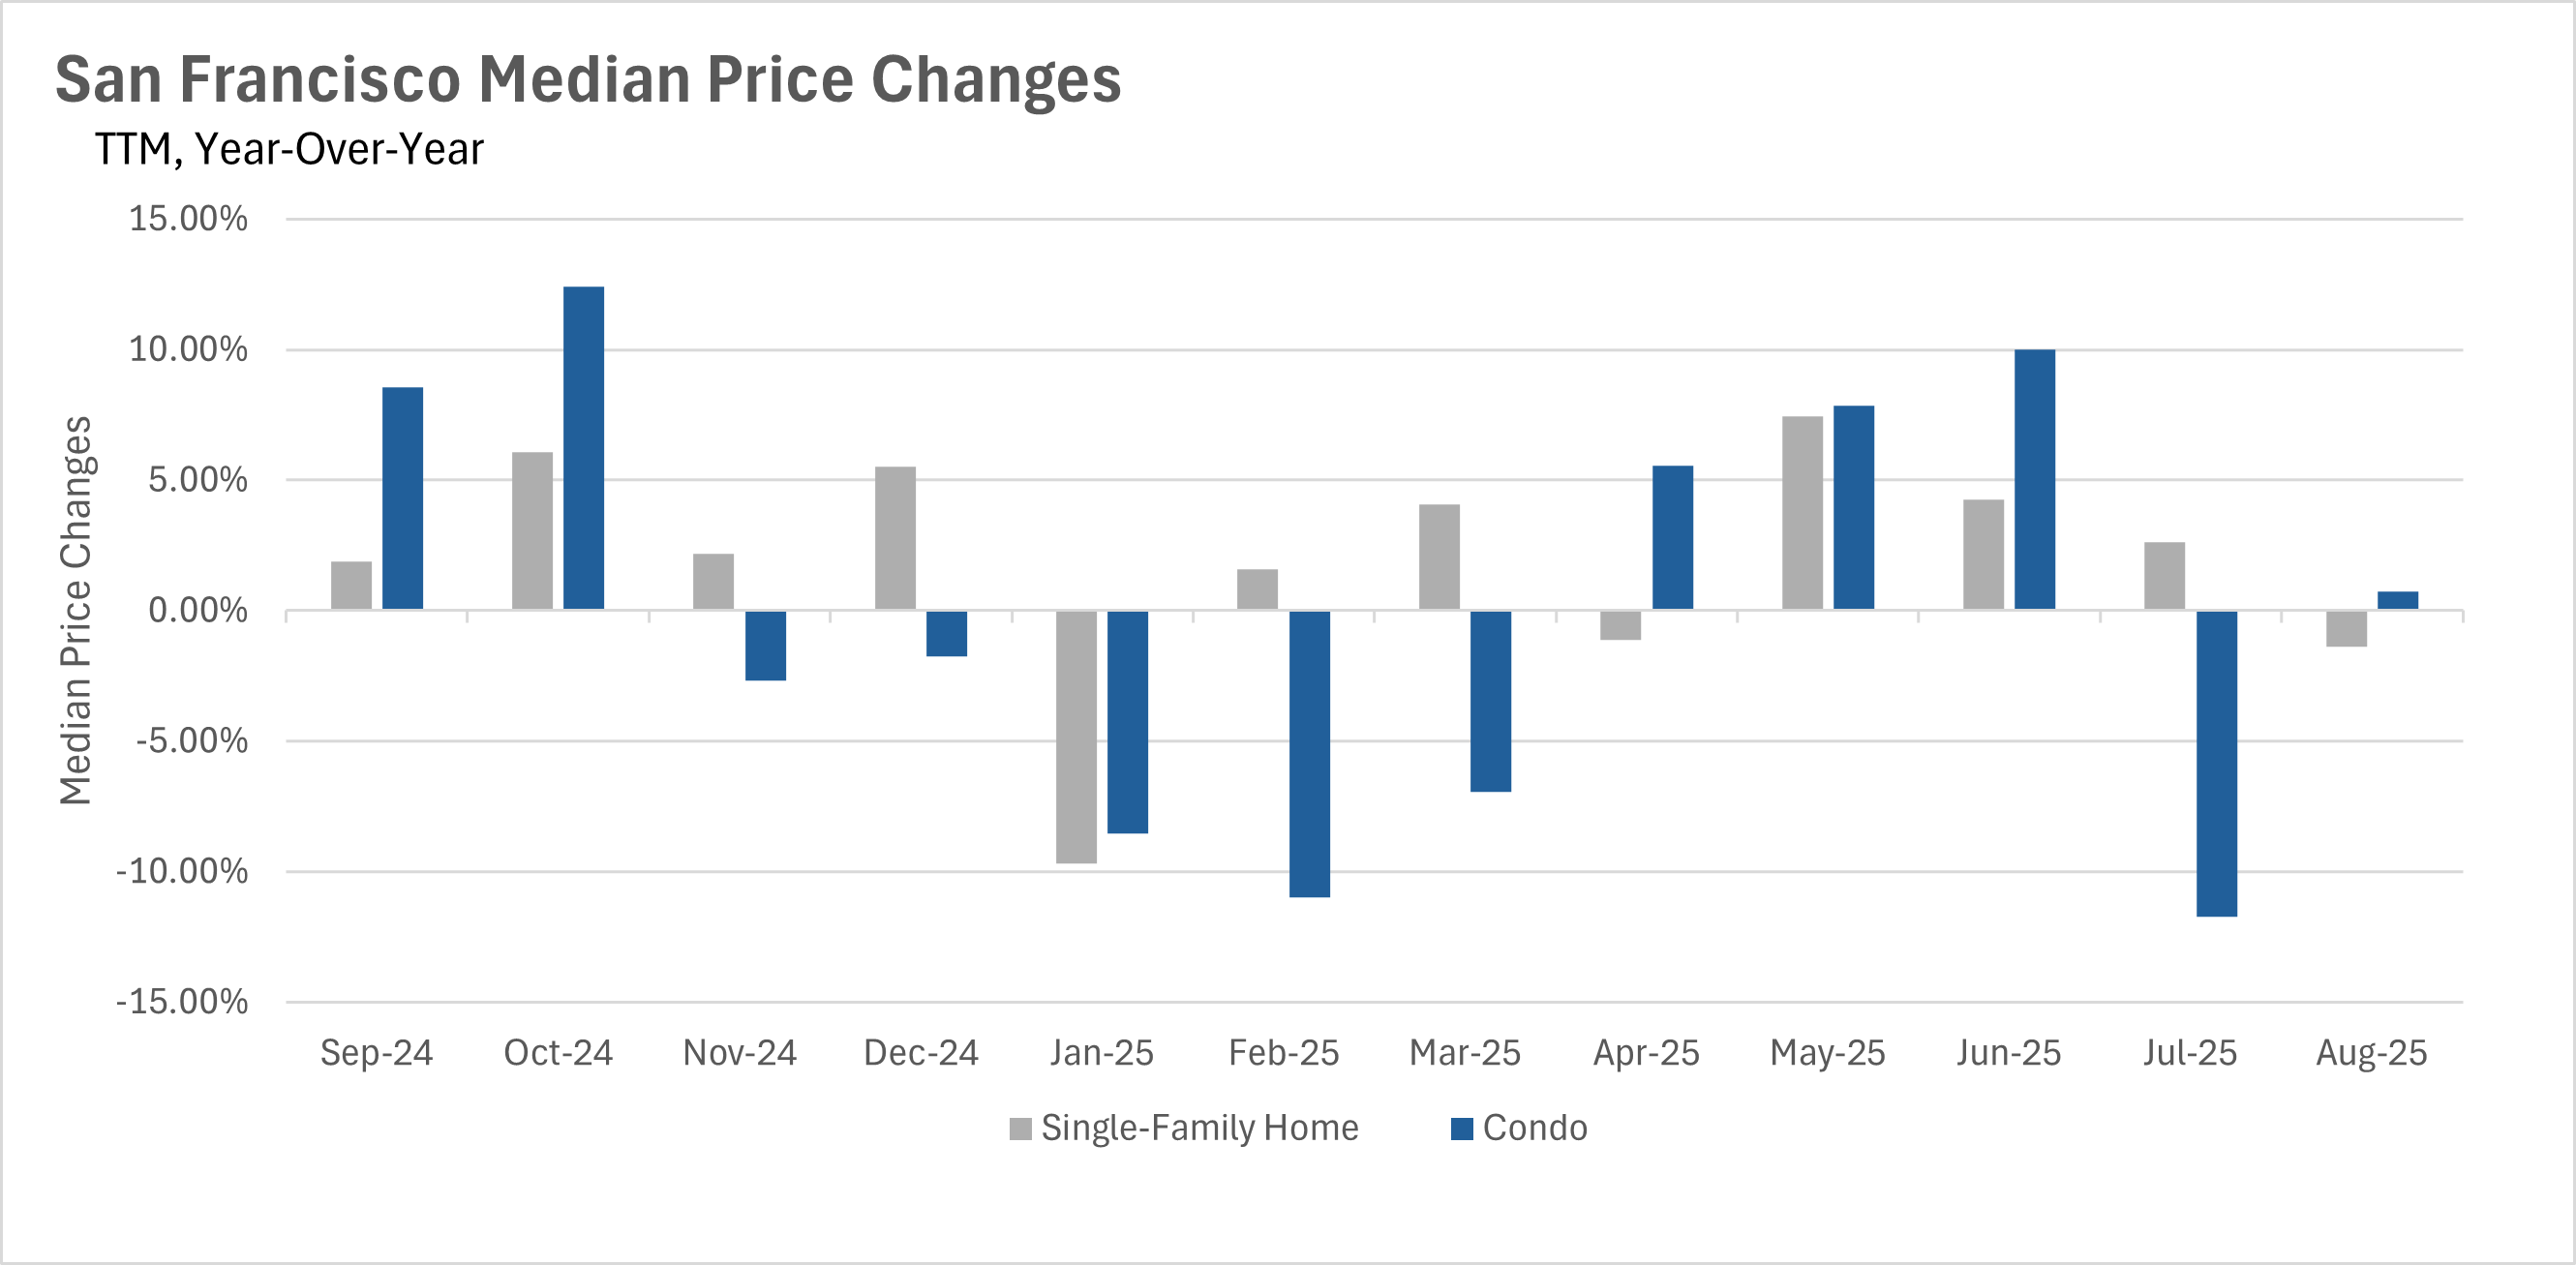
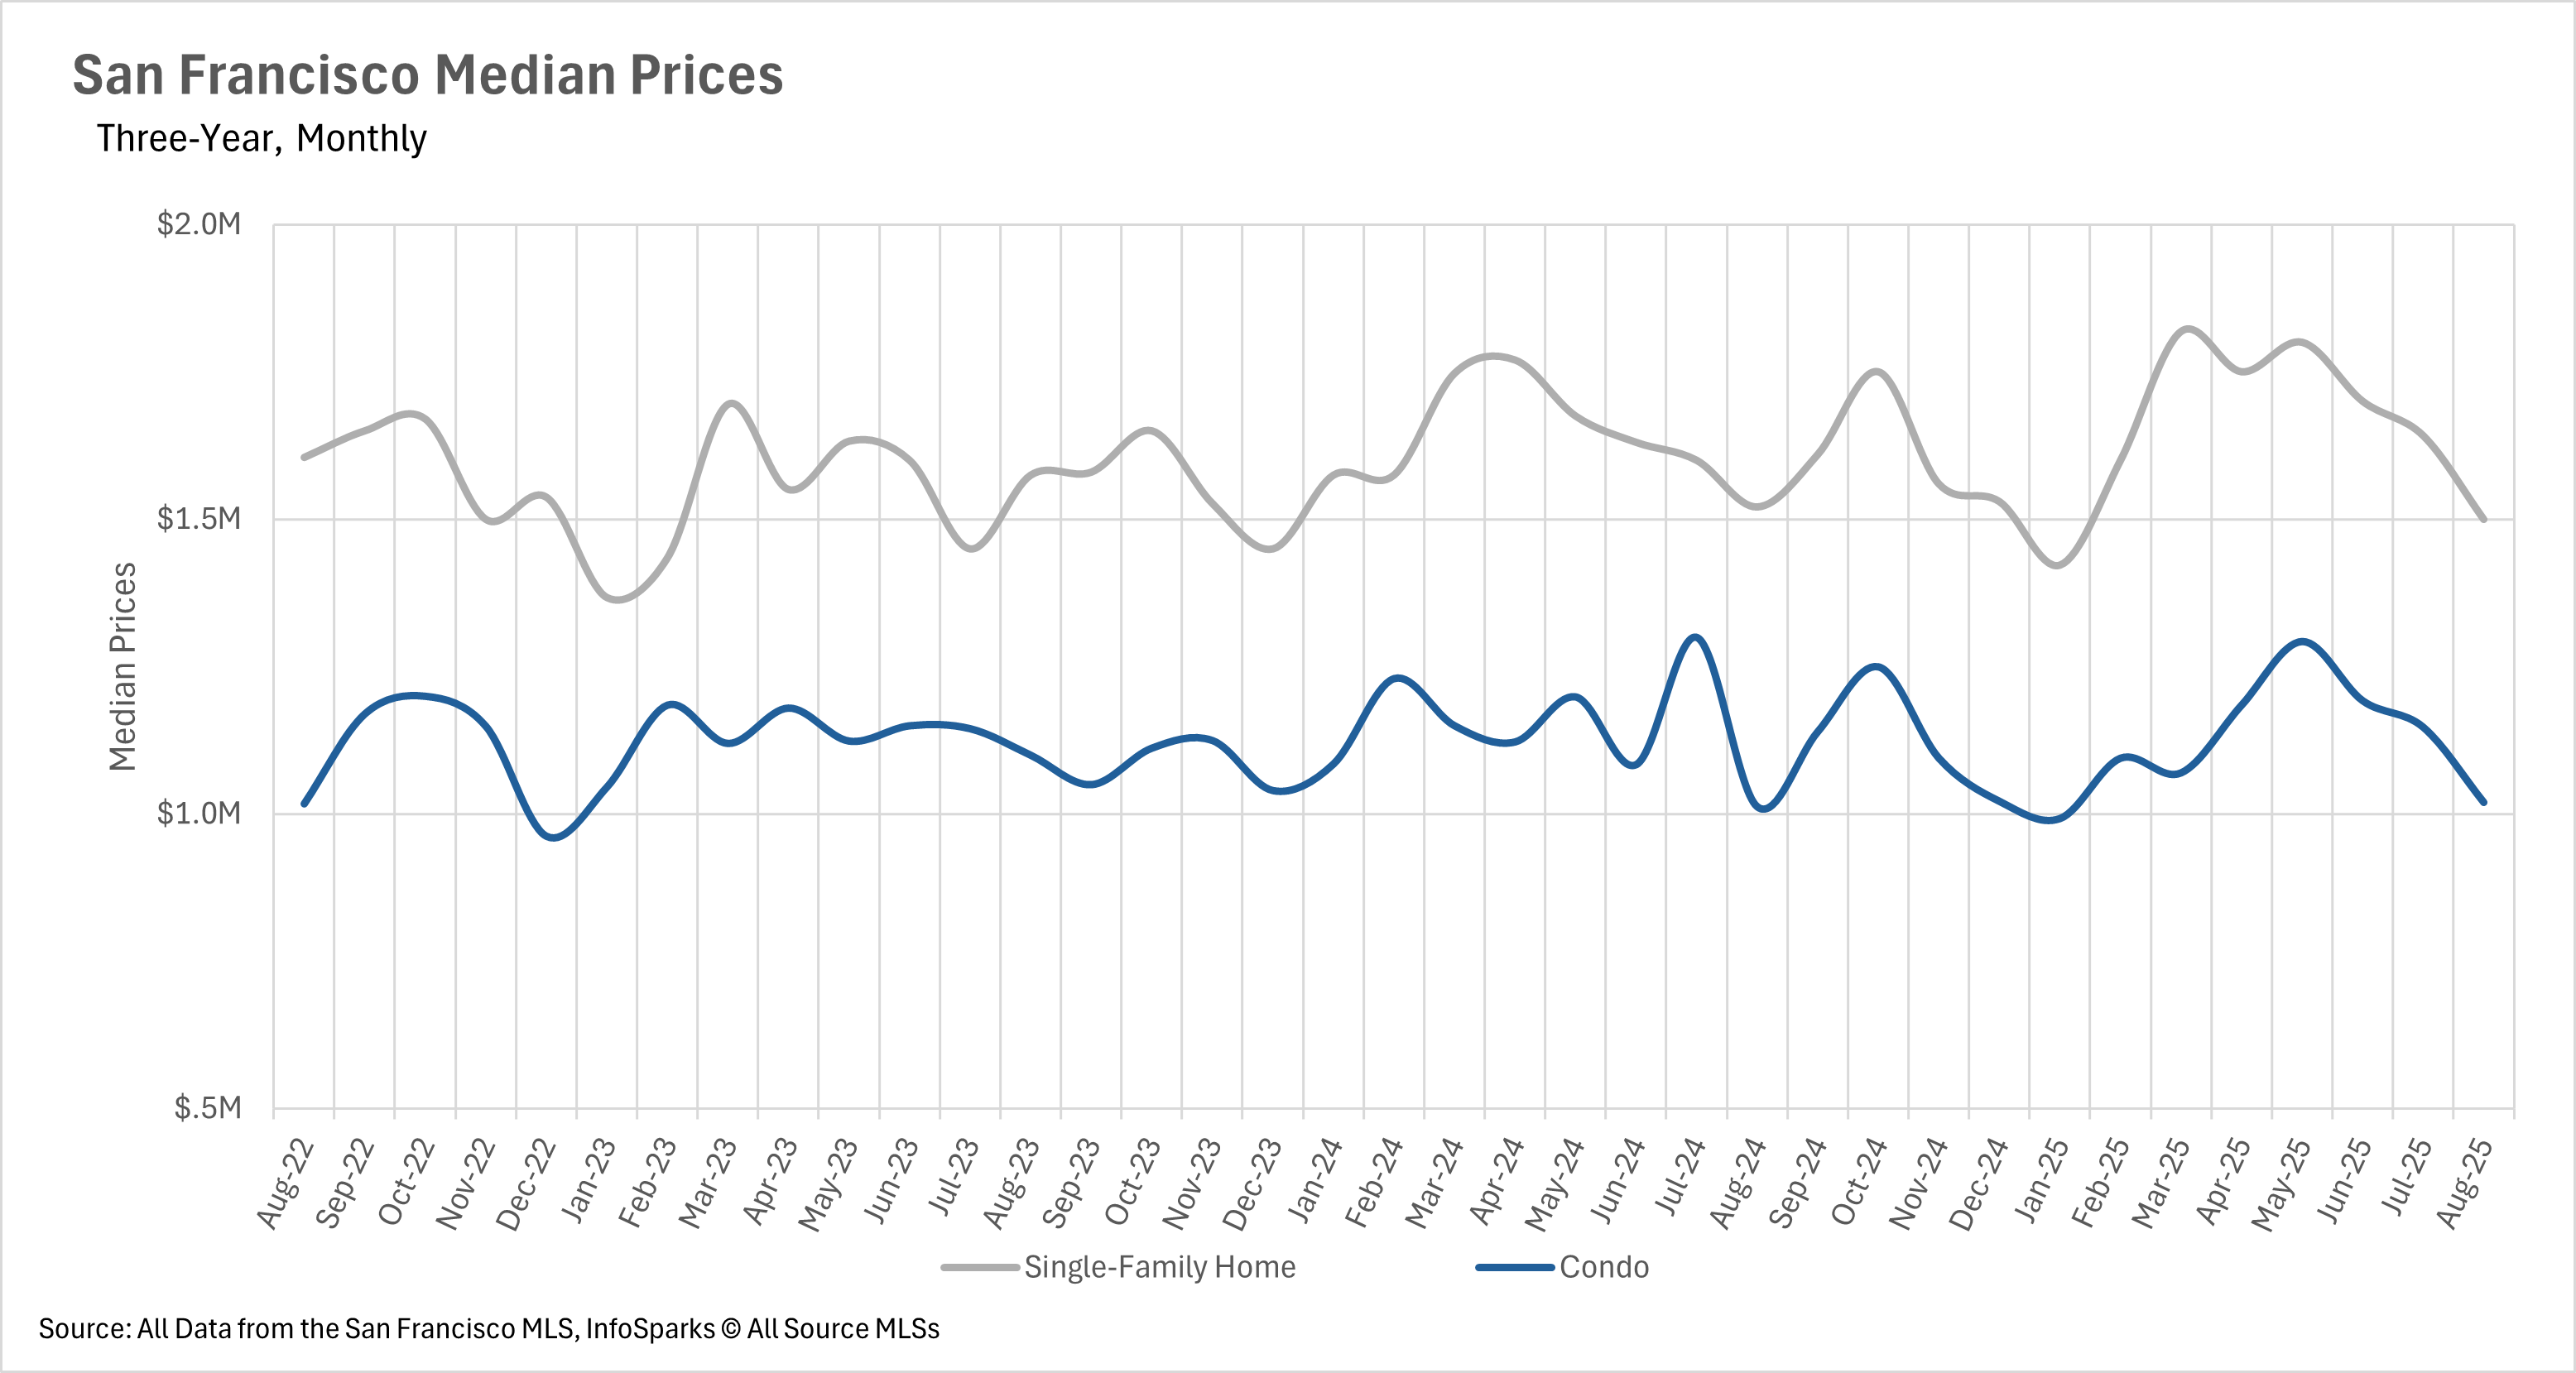
The San Francisco market has traditionally been a fairly volatile market. However, in August, the volatility was muted. The median sale price for a single-family home decreased by 1.38% on a year-over-year basis, while the median sale price for a condo increased by 0.74%. This is a relatively strange phenomenon, as year-over-year swings of 2- 3%+ have become quite normal in San Francisco recently. It is worth noting, though, that the average single-family home is still selling for 111.9% of the original listing price, while the average condo sells for 97.3% of its original listing price.
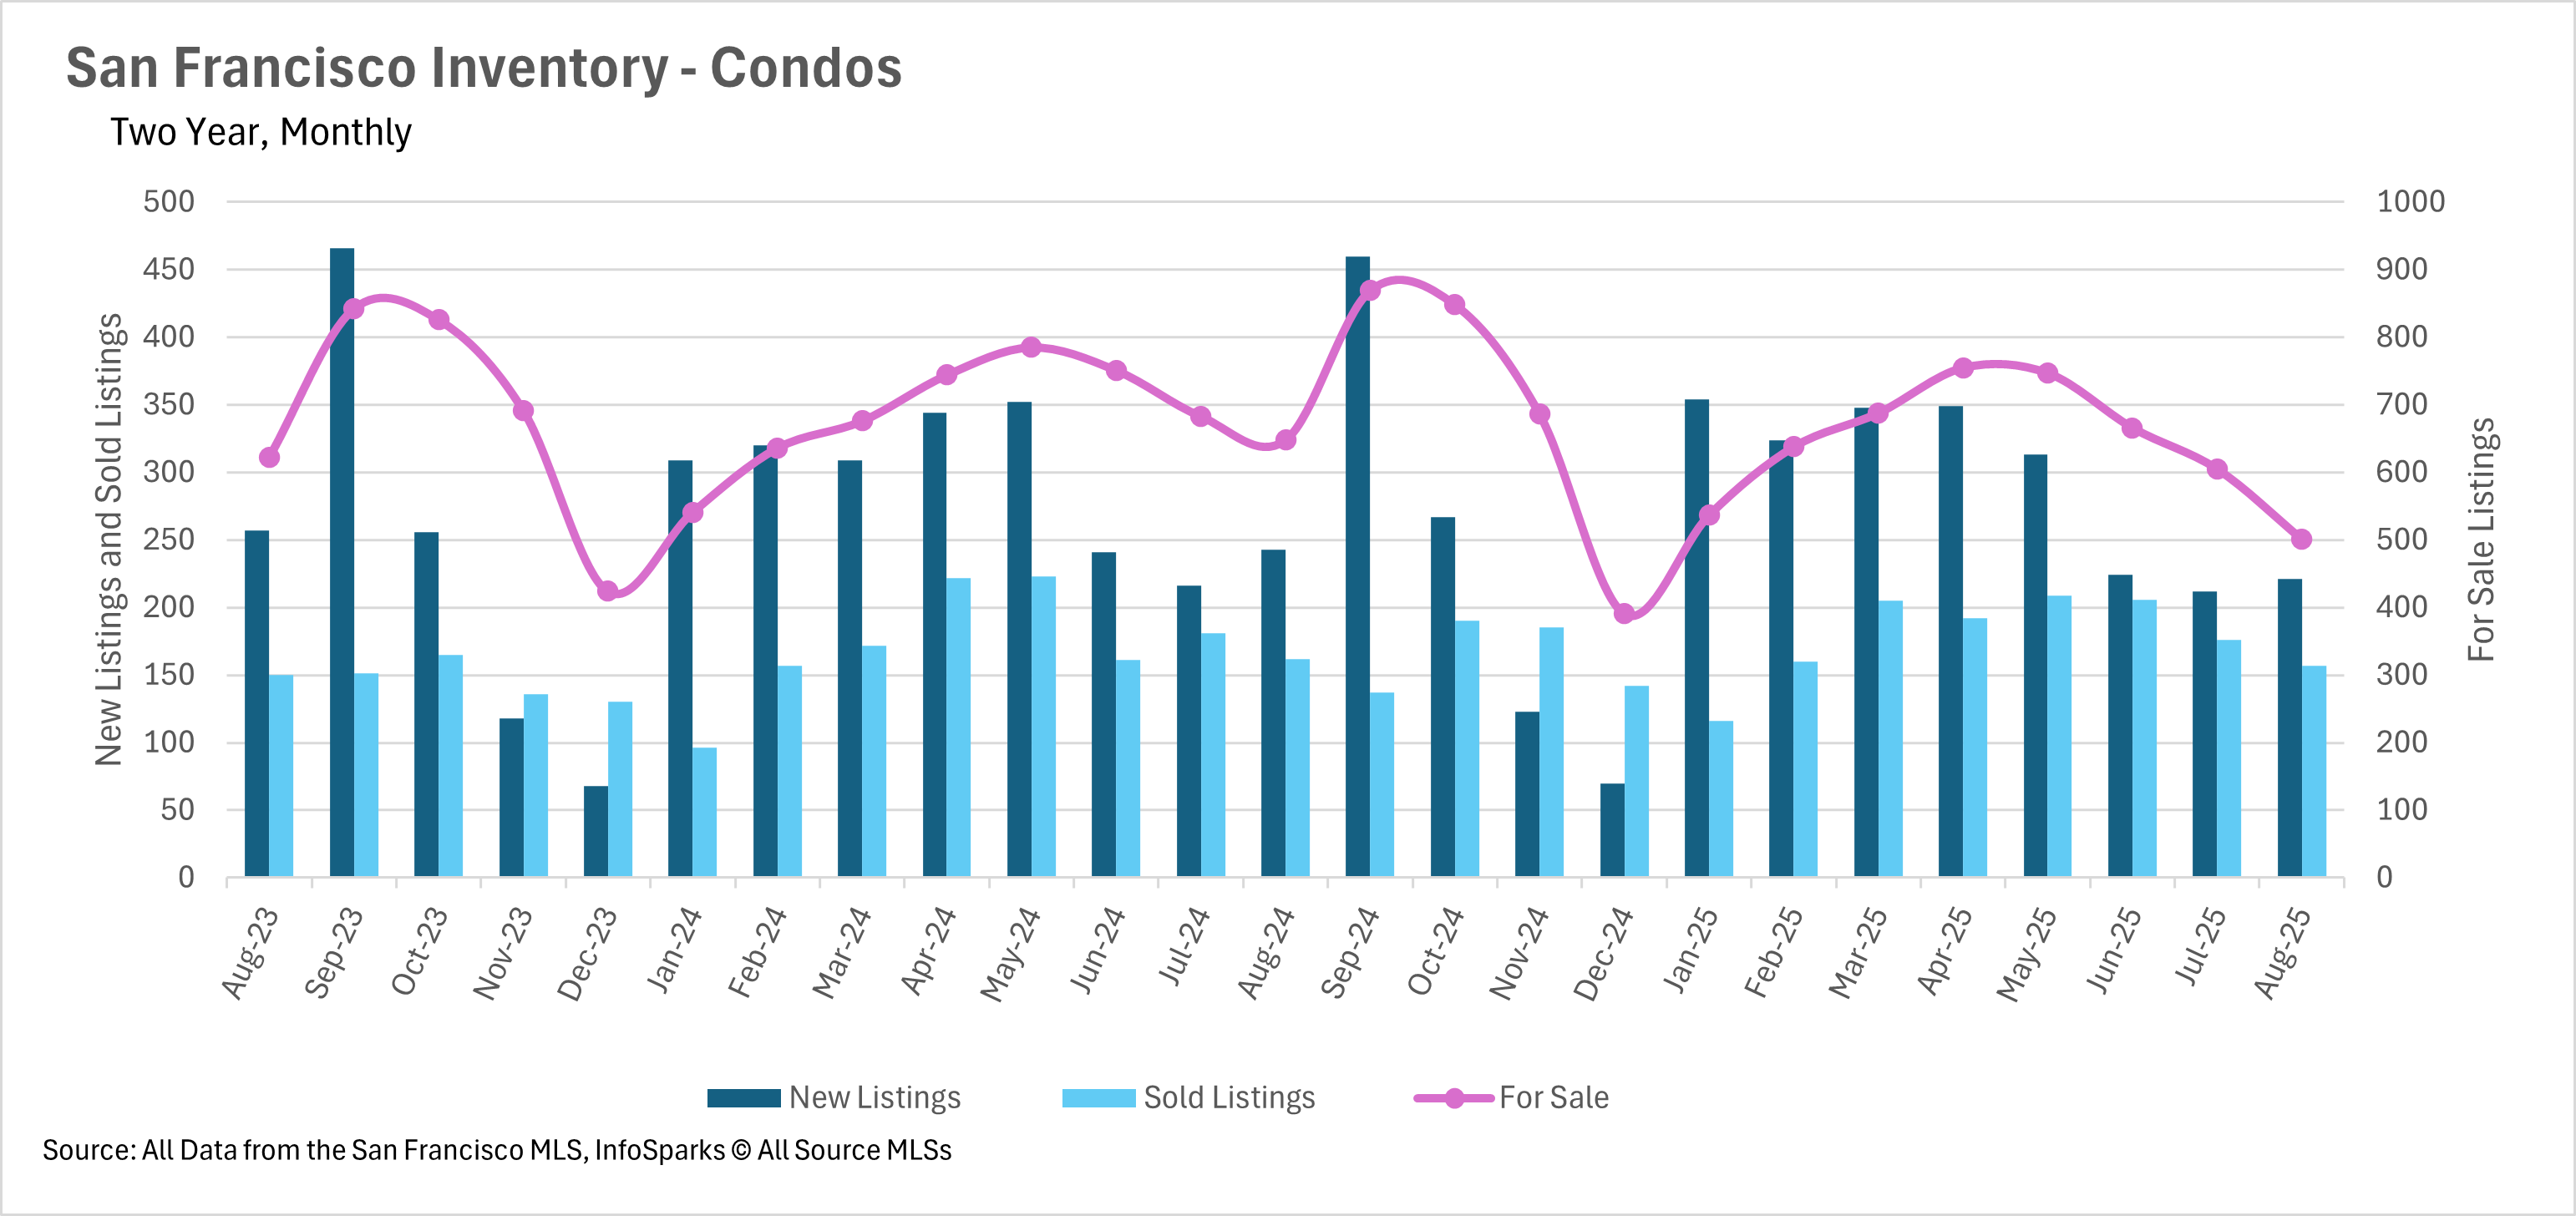
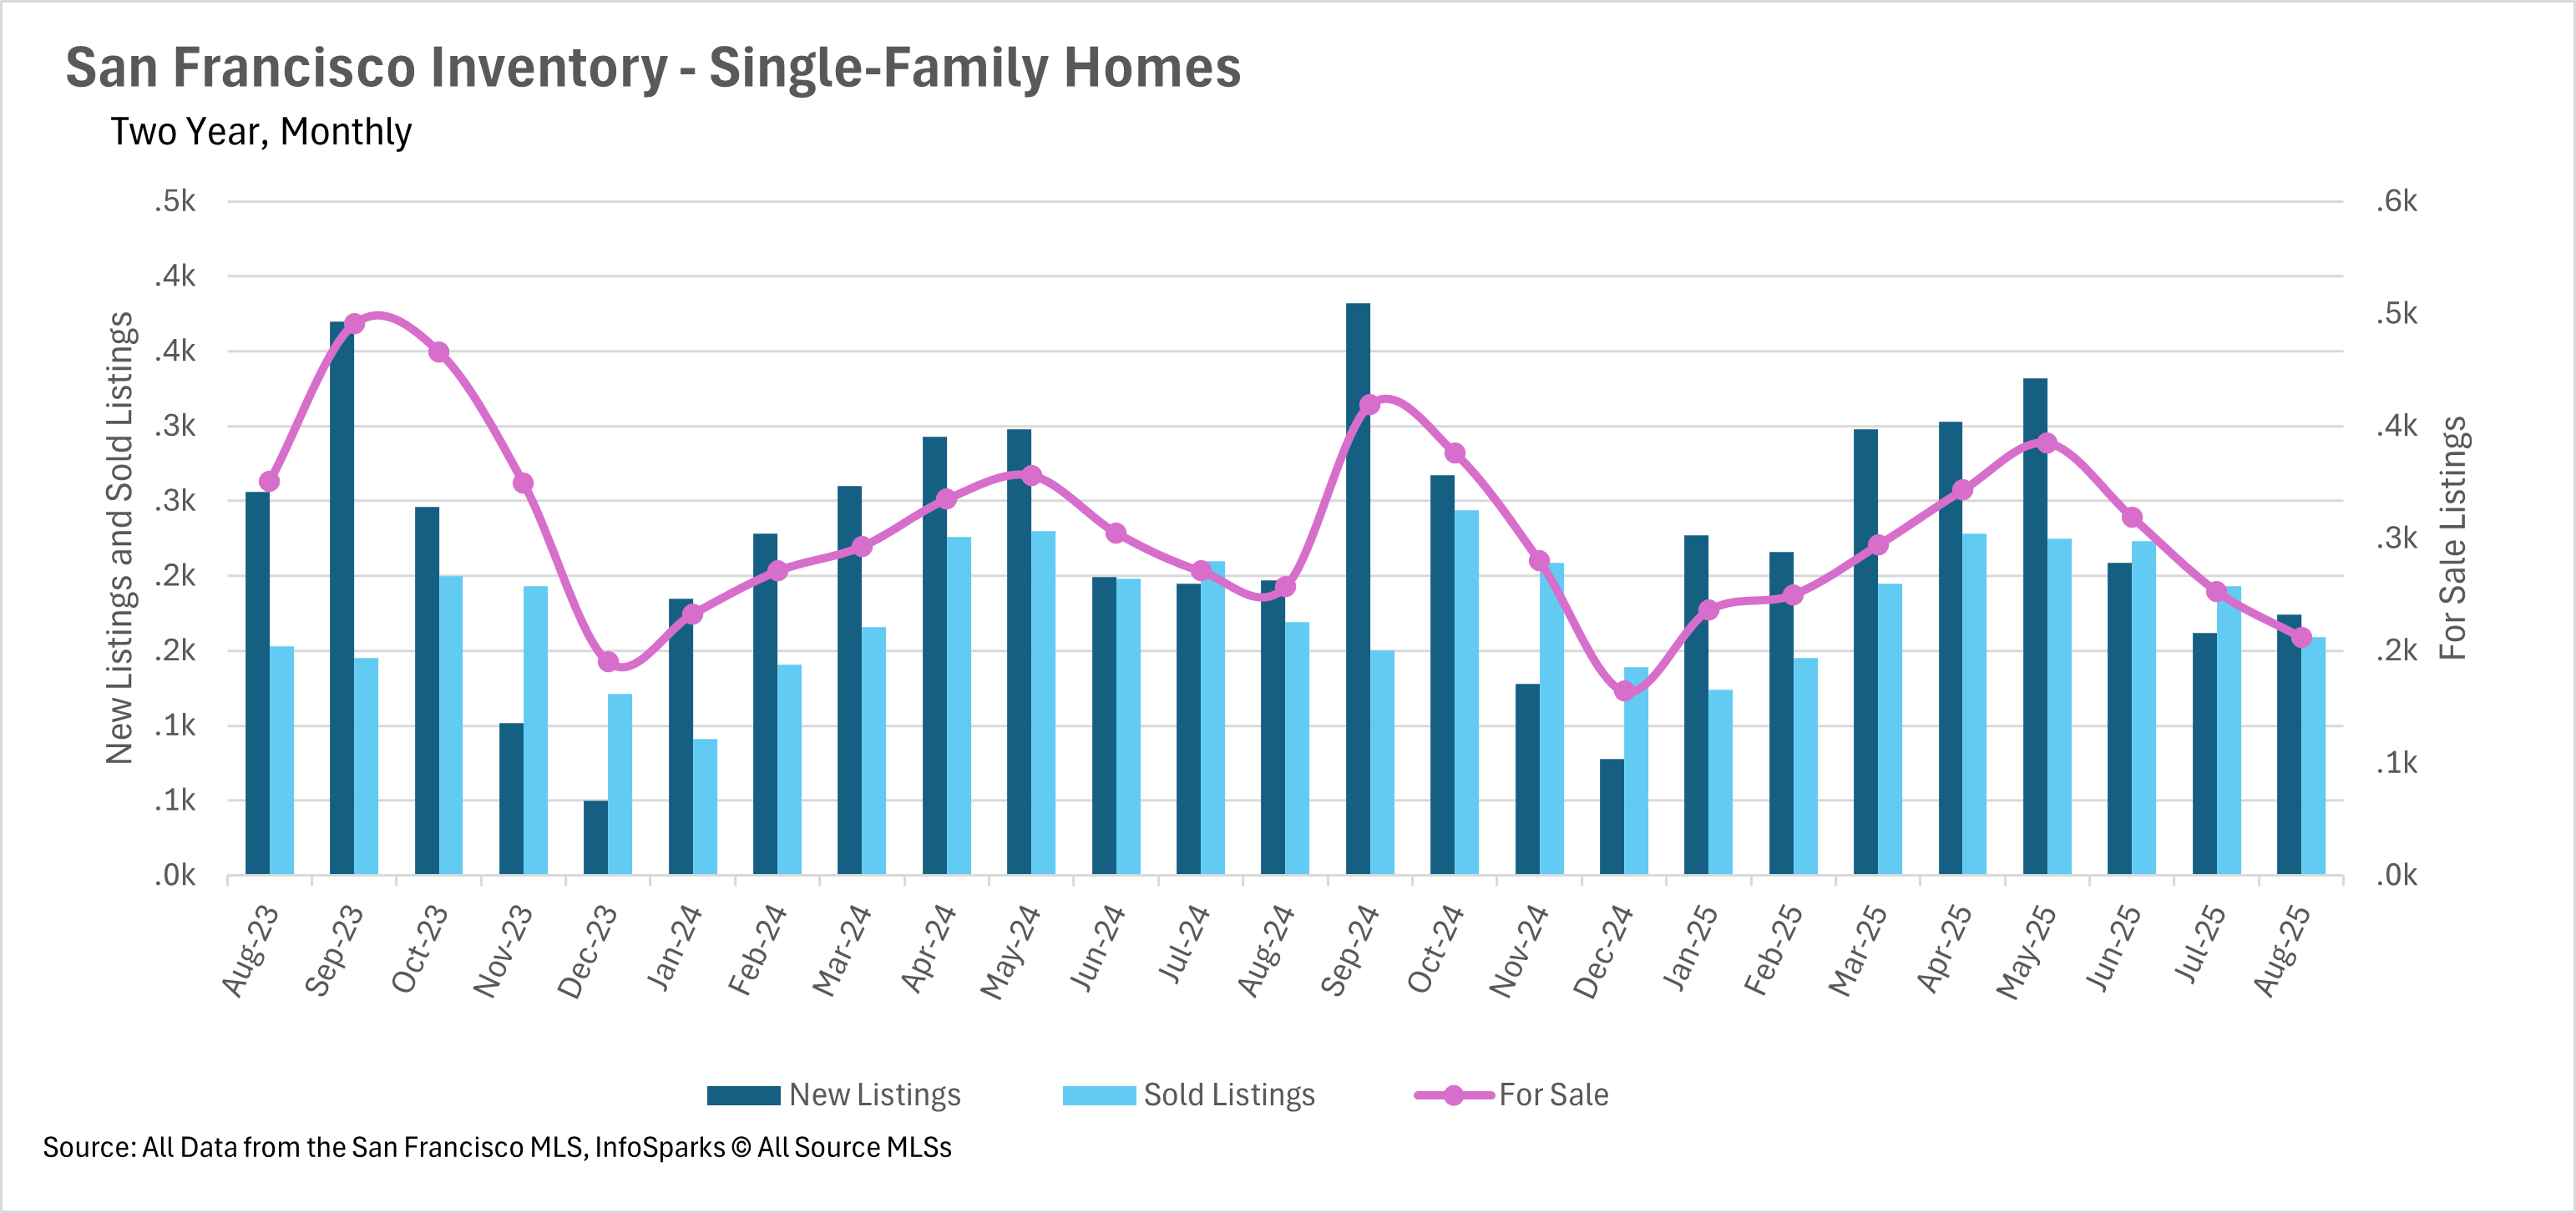
The inventory problem is nothing new in San Francisco. While many other counties saw ballooning inventories throughout the spring and early summer, inventories in San Francisco continued their decline. This trend continued in August, with the single-family home market recording 17.51% fewer active listings on a year-over-year basis, and the condo market recording 22.69% fewer active listings. This trend continues to be concerning, but unfortunately, there’s no end in sight!
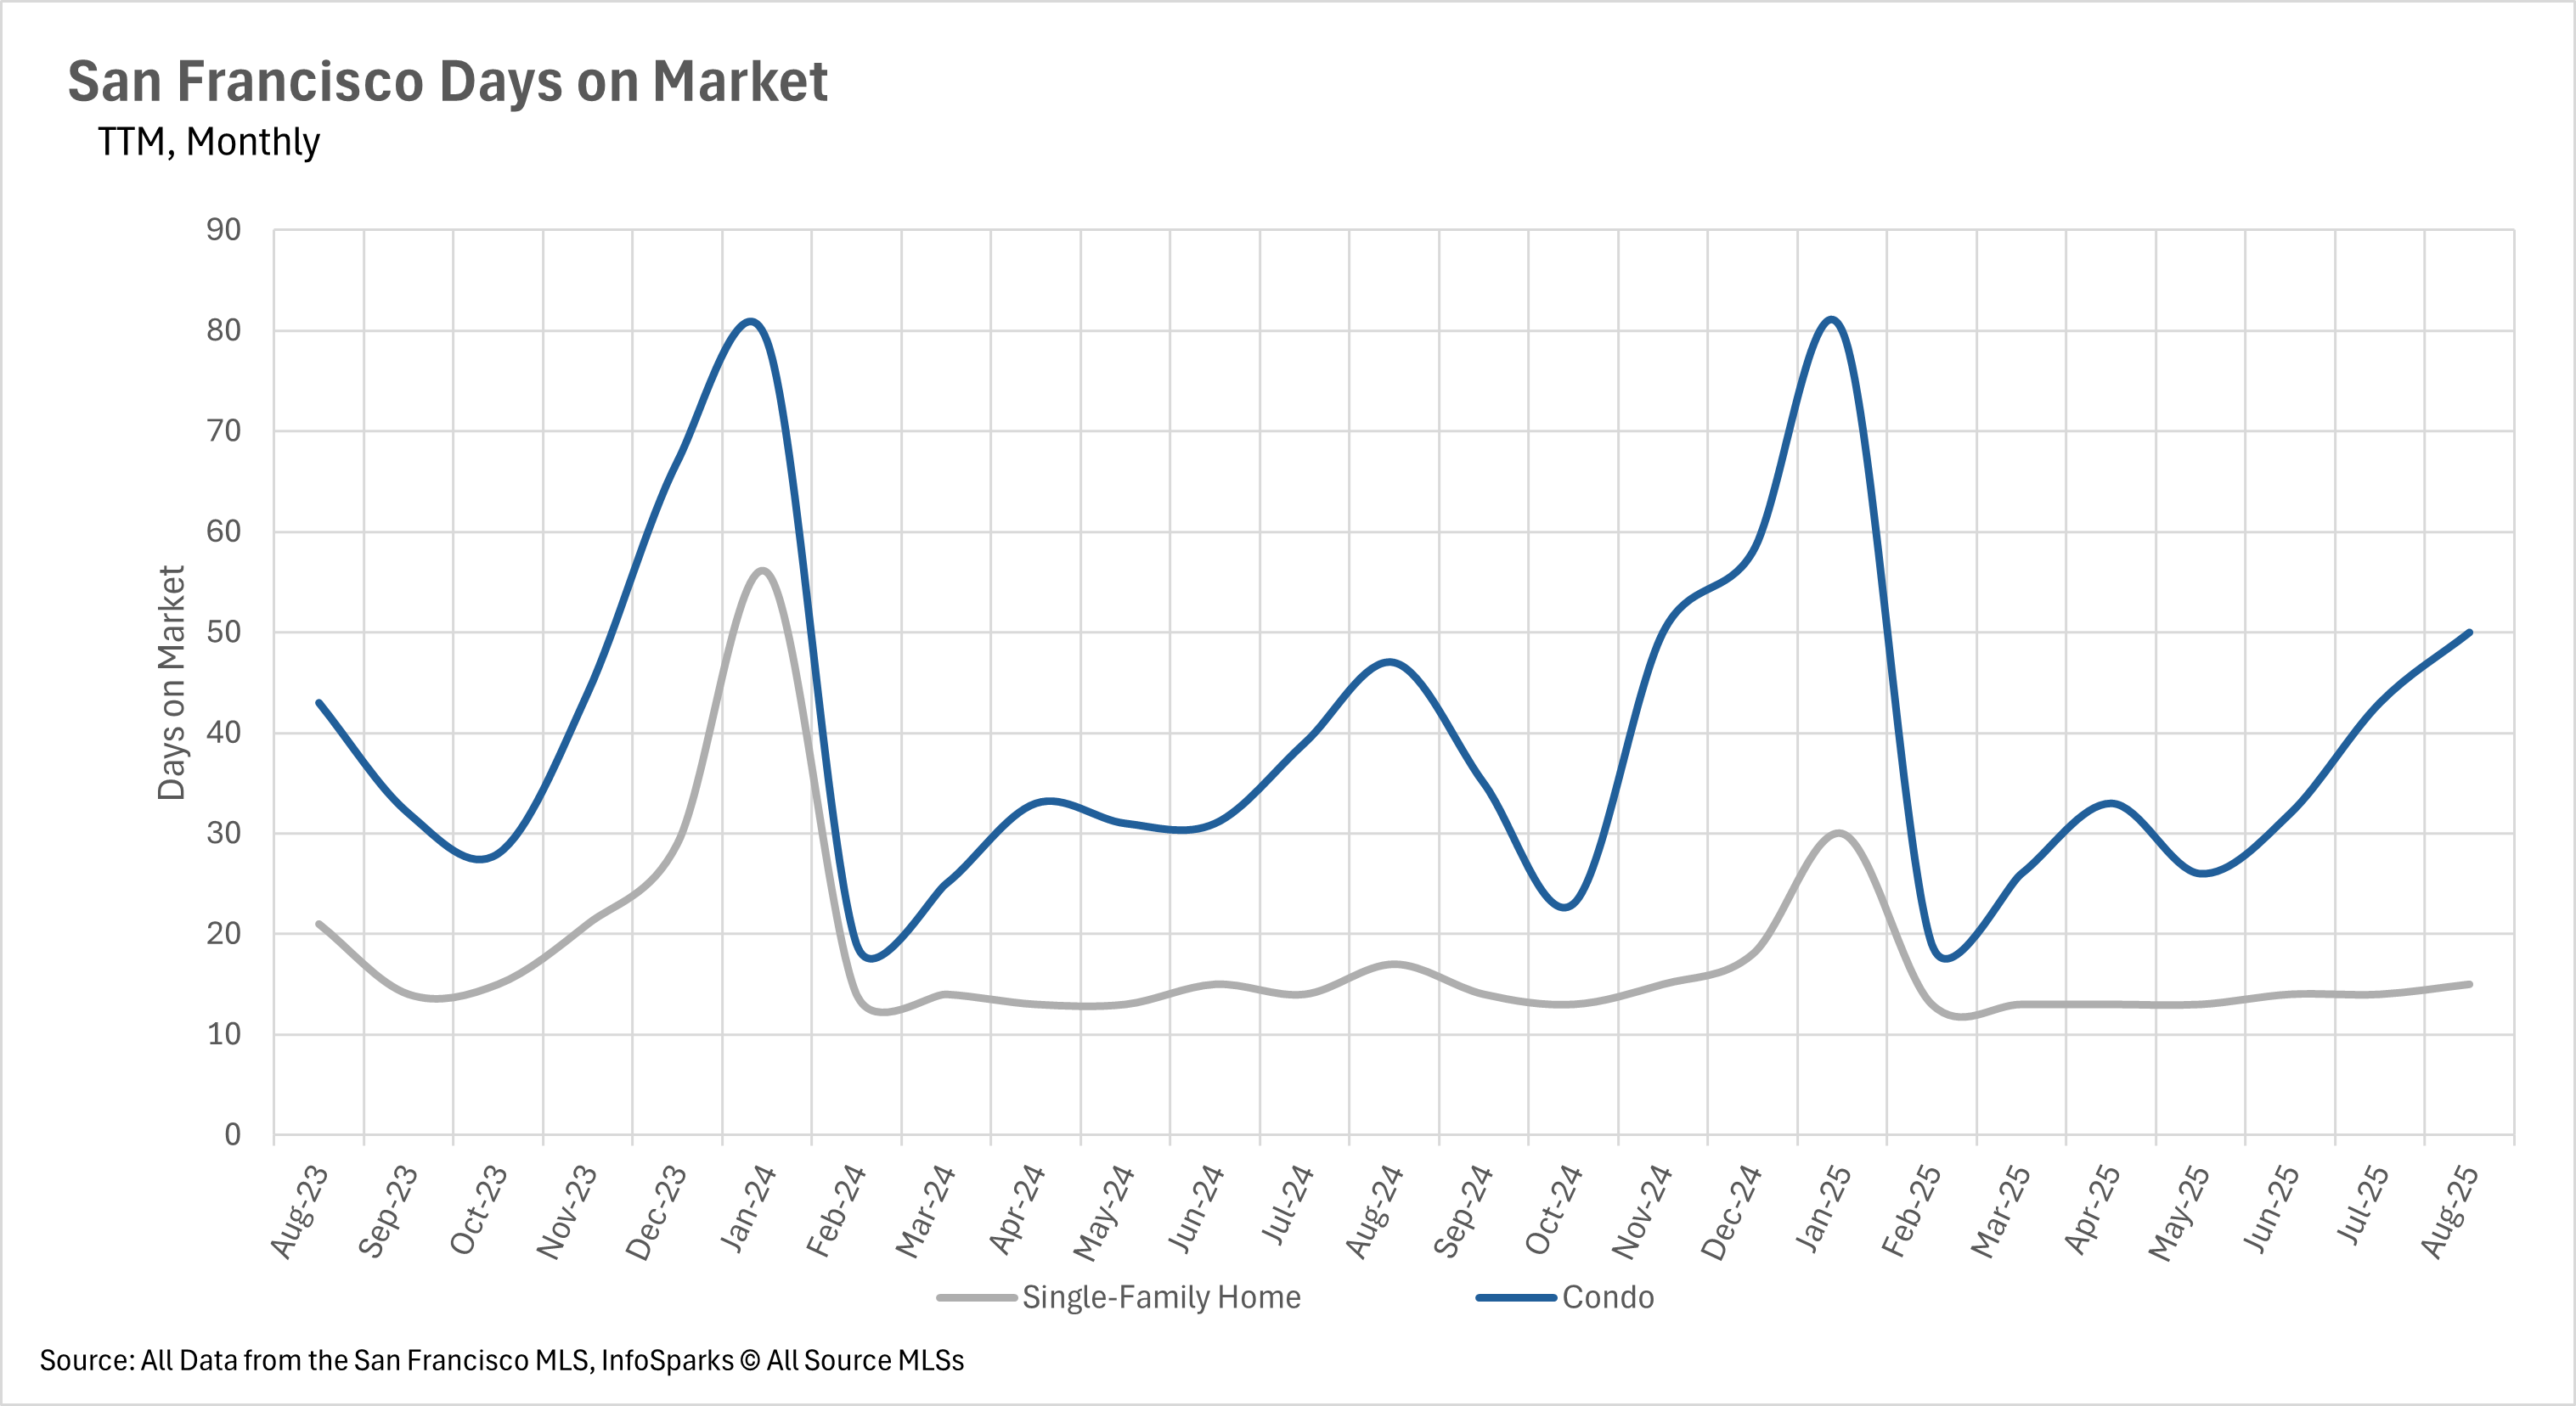
While you might assume that lower inventories mean that listings are spending less time on the market, you’d only be partially right when we look at San Francisco. The average single-family home is being scooped up incredibly quickly, spending just 15 days on the market. However, when we turn to the condo market, the average condo is spending 50 days on the market, representing a 6.38% increase year-over-year.
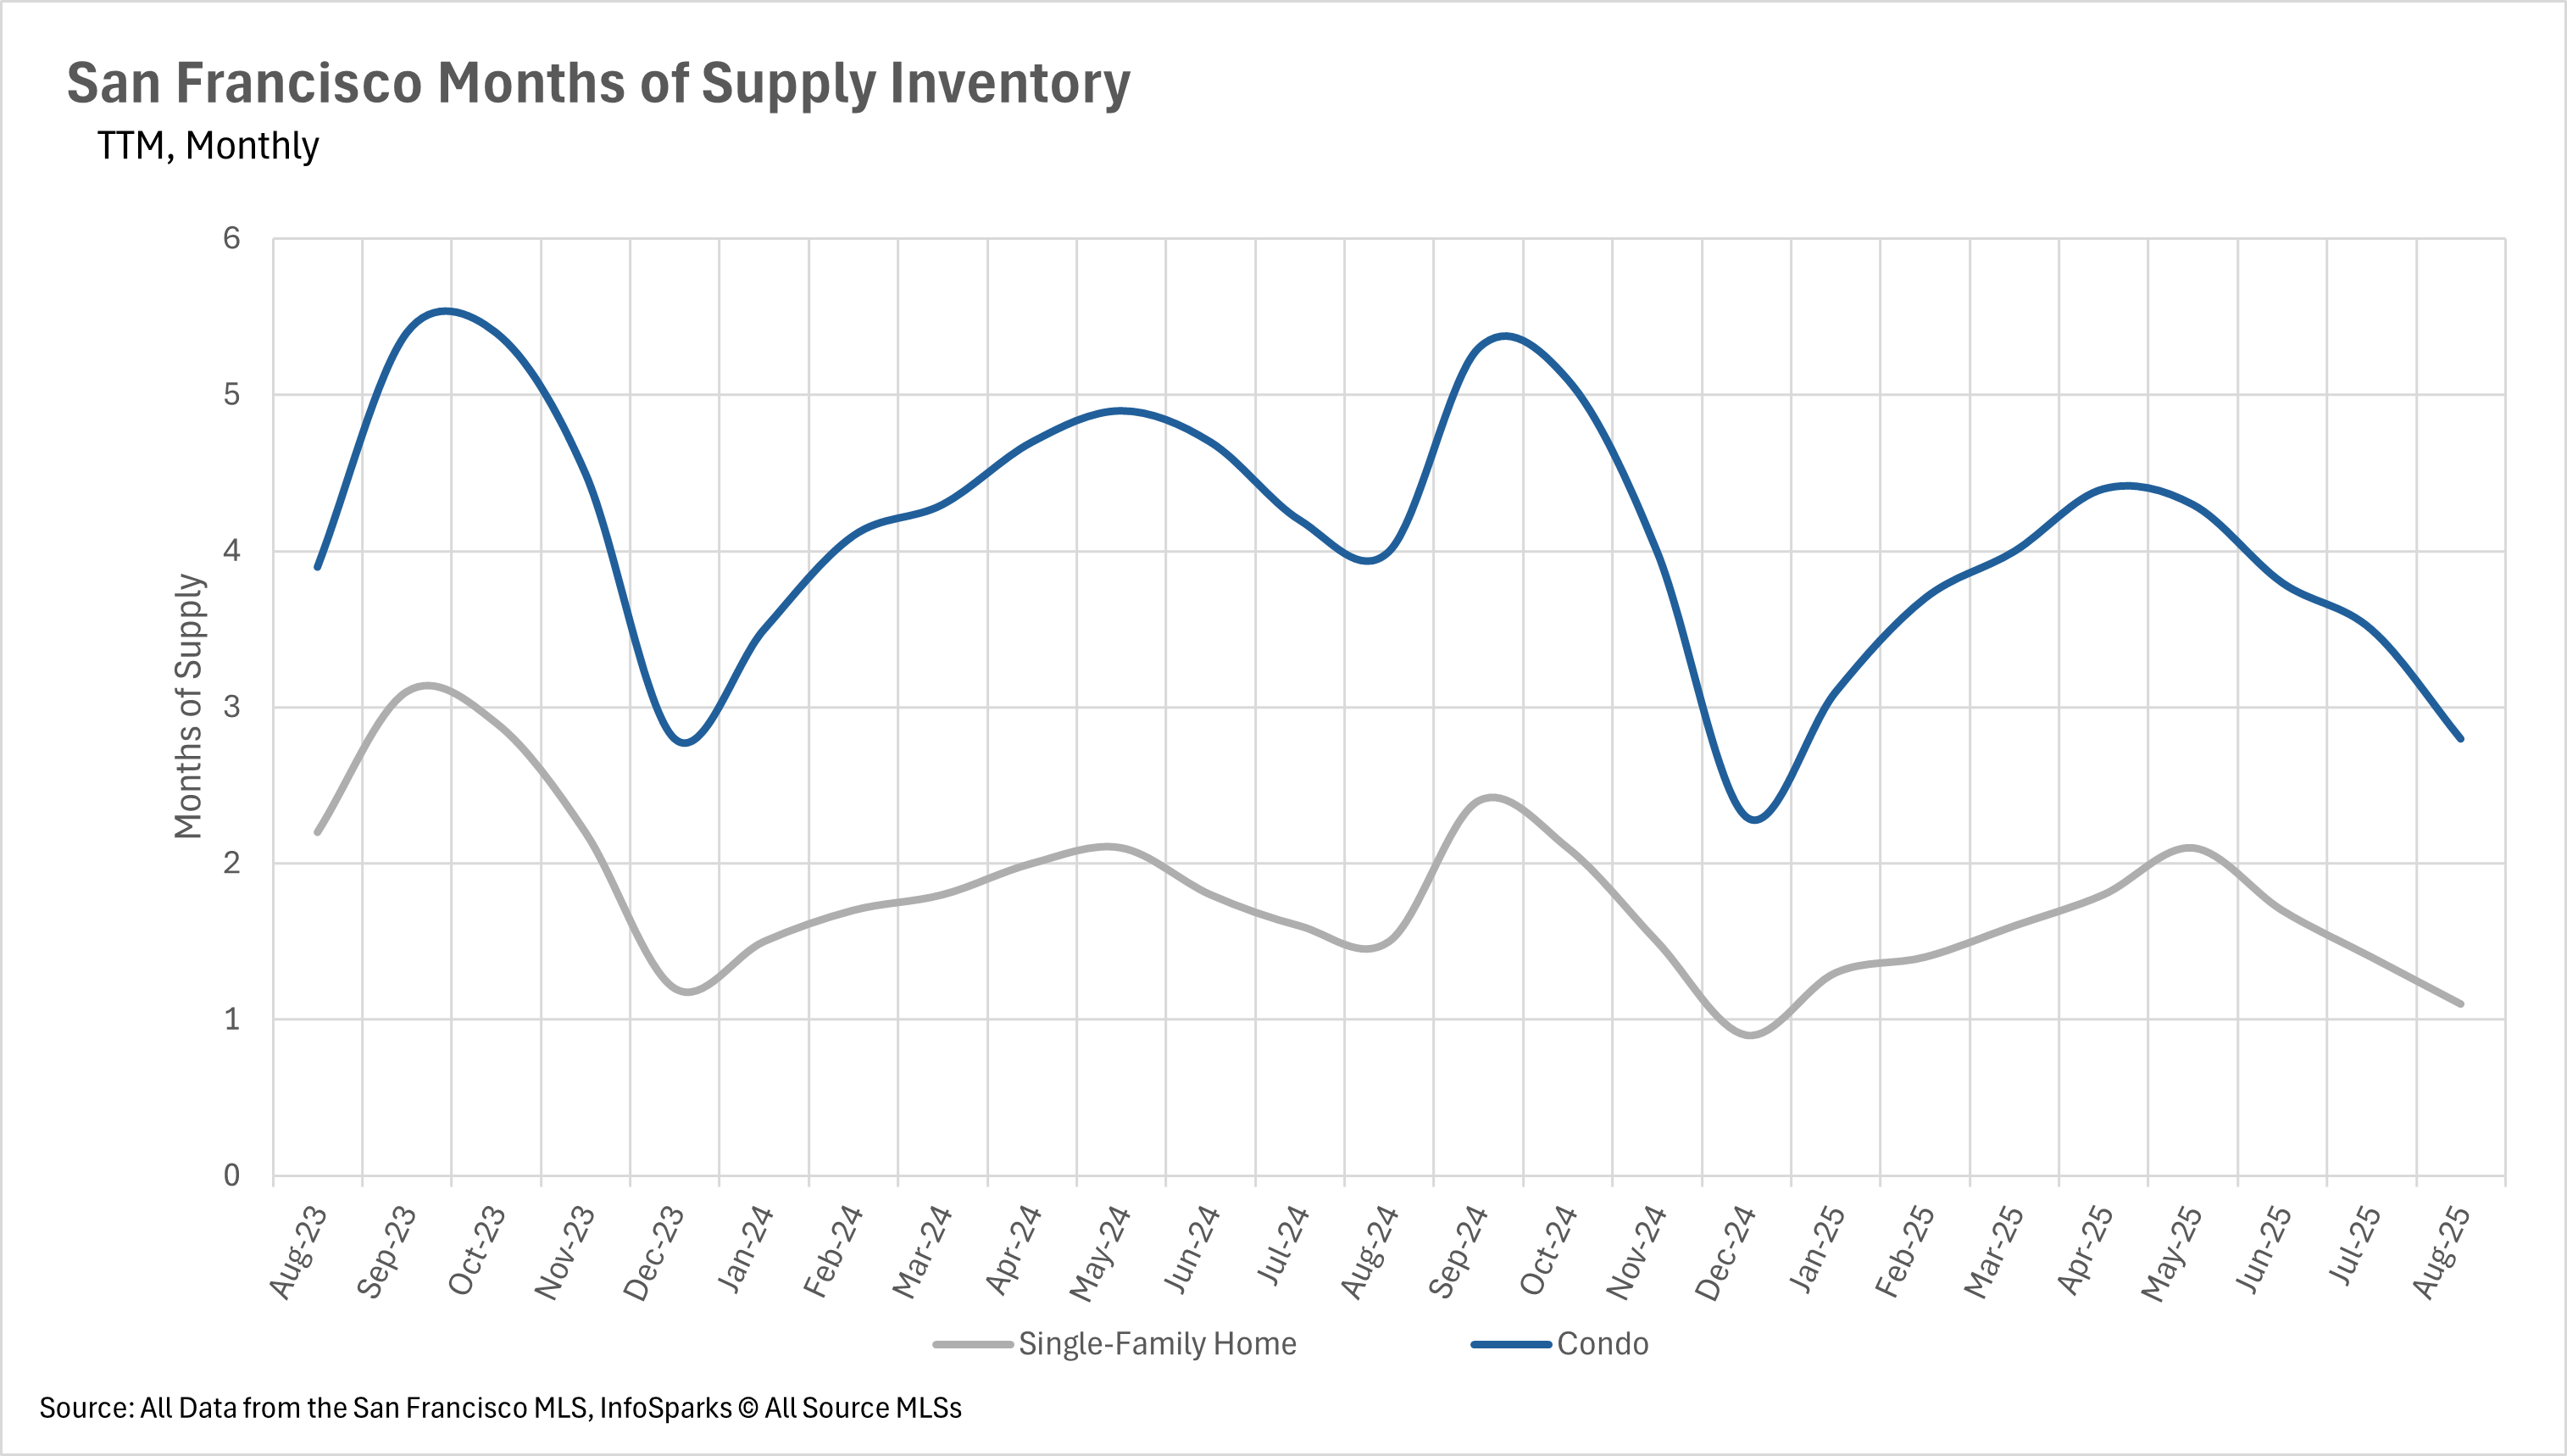
When determining whether a market is a buyers’ market or a sellers’ market, we look to the Months of Supply Inventory (MSI) metric. The state of California has historically averaged around three months of MSI, so any area with at or around three months of MSI is considered a balanced market. Any market that has lower than three months of MSI is considered a seller’s market, whereas markets with more than three months of MSI are considered buyers’ markets.
This past month, we saw some of the lowest levels of inventory ever in terms of months' worth of supply in the San Francisco area. Both the single-family home and condo markets are fierce seller's markets, with the single-family home market having just 1.1 months' worth of inventory on the market, and the condo market having just 2.8 months of inventory.
Curious about areas we love and serve? These neighborhood guides bring on-the-ground flavor and expert perspective:
Living in Bernal Heights: What Homebuyers Need to Know in 2025 – A vibrant, family-friendly neighborhood that blends small-town comfort with San Francisco convenience.
Exploring San Francisco’s Silver Terrace Real Estate: 200 Bayview Circle and Beyond – Discover a lesser-known hillside neighborhood with sweeping views, bigger lots, and incredible value.
Top 7 Reasons Families Love Mission Terrace – From Balboa Park to local ice cream shops, Mission Terrace is a hidden gem for families.
Need a little real estate wisdom, inspiration, or next-step guidance? These posts are full of insight and practical tips:
How to Read San Francisco Real Estate Disclosures Like a Pro – Everything you need to know about navigating those dense disclosure packets with clarity and confidence.
Multifamily Homes 101: Strategy & Guide for SF Buyers and Investors – Exploring duplexes and triplexes? Discover how they offer affordability, income, and flexibility in today’s market.
Demystifying San Francisco’s Down Payment Assistance Programs – A comprehensive breakdown of DALP, DreamKeeper, and Teacher Next Door—plus tips for buyers and peace of mind for sellers.
Real stories, real transformations—how do you sell a fixer-upper in Bernal Heights? Or list from abroad? We’ve got those covered in our San Francisco real estate case studies.
Stay up to date on the latest real estate trends.

June 11, 2026
Discover the cafés, tea shops, parks, and neighborhood amenities that make Dogpatch one of San Francisco's most vibrant places to live.

June 5, 2026
What San Francisco Homebuyers Need to Know Before Making an Offer

June 3, 2026
Are Home Prices Still Rising in Bernal Heights?

June 1, 2026
Are Home Prices Rising in Pacifica? How Fast Are Homes Selling? Here's What the Data Shows.
You’ve got questions and we can’t wait to answer them.