Bernal Heights Real Estate Market Update: October 2025
November 13, 2025
SHARE
Bernal Heights Real Estate Market Update: October 2025
October 2025 was a busy month for single-family home sales in Bernal Heights. If you’re a Bernal homeowner thinking about your equity—or a buyer trying to understand what it really takes to land a house on the hill, this recap is for you.
Below, you’ll find an overview of how the market performed, plus two real-life examples that show how pricing, condition, and strategy can produce very different results.
Big-Picture: How the Bernal Market Performed
In October, 23 single-family homes closed in Bernal Heights. Taken together, they paint a picture of a market that is still competitive, but also nuanced:
Median sale price: around $1.56M
Price range: roughly $880,000 to $3.9M
Median days on market: about 15 days
Average sale vs. list price: homes sold for roughly 6% over list on average
Most homes sold quickly: the majority of properties that went into contract within 30 days sold well over their list price
We’ll include detailed charts and tables of rolling 3 month data (median price, days on market, percent over list, and number of sold properties) so you can better see the market trends for Bernal.
What Actually Sold in October?
When you zoom in on the homes themselves, a “typical” October sale in Bernal looked like:
Property type: Single-family home (no condos or TICs in this snapshot)
Bedrooms / bathrooms: Most sales were 3-bed, 2-bath homes
Square footage: Often in the 1,400–1,500 sq ft range
Era of construction: Many were classic pre-war homes, with a median year built in the early 1920s
In other words: the kinds of homes Bernal is known for, charming, mostly older single-family houses with character, views, and a range of condition levels from “turnkey” to “bring your contractor.”
Two October Sales That Tell the Story
While the overall stats are helpful, sometimes a couple of real examples say more than a chart can. In October, two sales in particular helped define the month: the highest overbid and the largest under-asking sale.
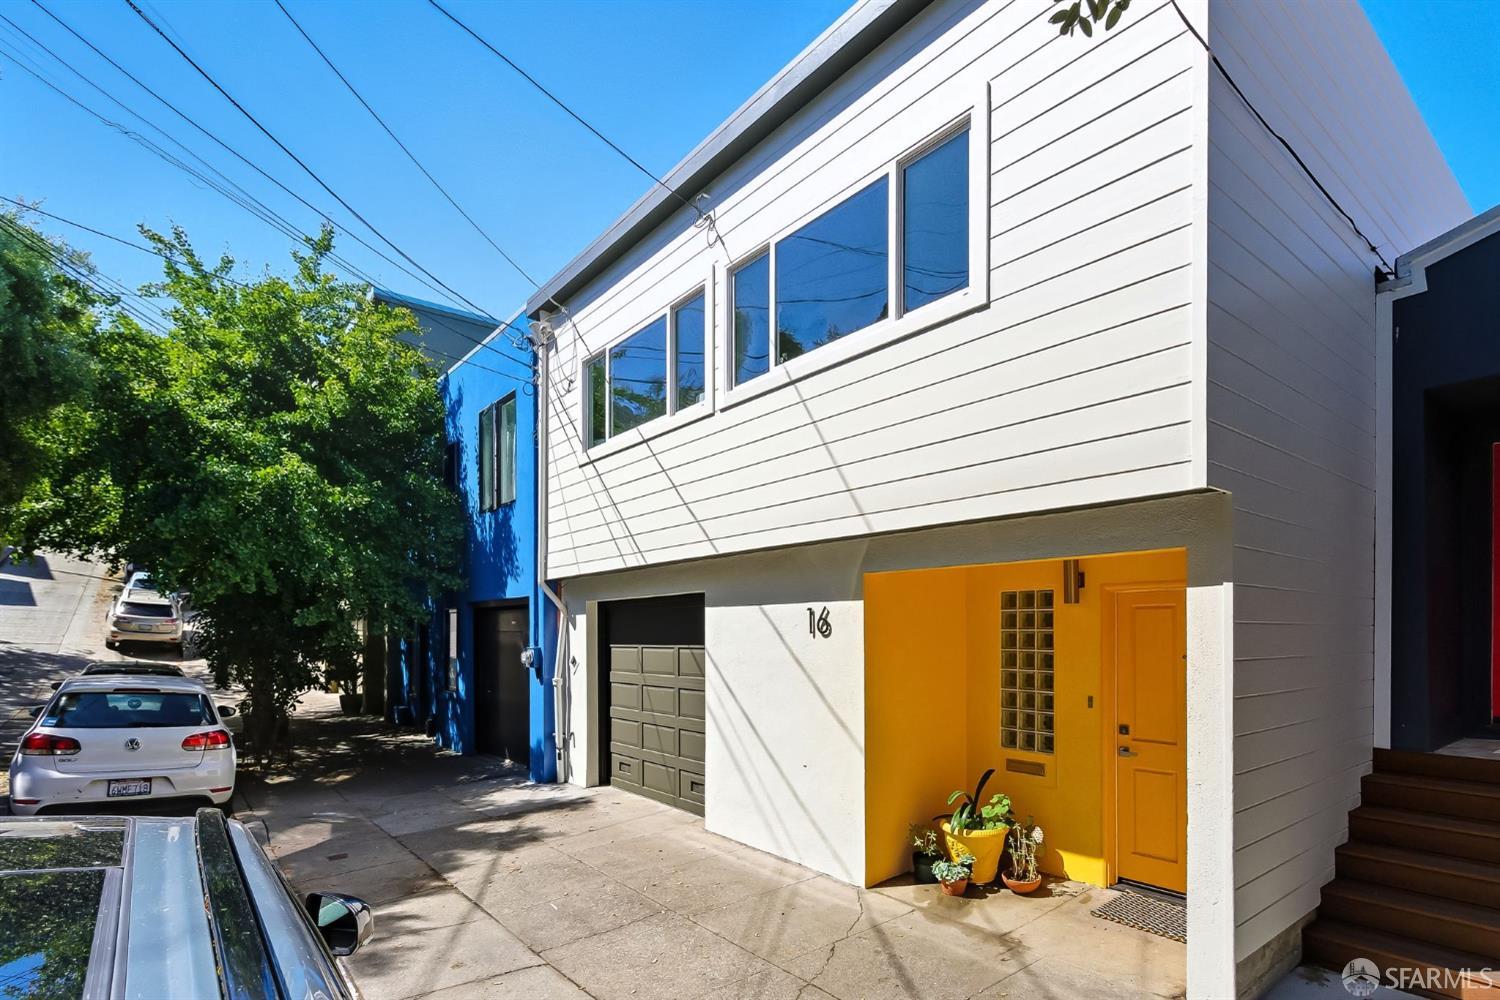
1. 16 Winfield St – The Bidding-War Standout
Address: 16 Winfield St, San Francisco, CA 94110
Type: Single-family home
Listed at:$1,099,000
Sold for:$1,675,000
Sale-to-list ratio:152.41% of list price
Beds / baths: 3 bed / 1 bath
Approx. size: ~1,007 sq ft
This north-slope Bernal home is a textbook example of a successful “marketing price” strategy. The home was listed at $1,099,000, well below where comparable 3-bedroom Bernal homes have been trading, inviting interest and competition.
The result?
A final sale price of $1,675,000
A price-per-square-foot significantly higher than the neighborhood’s October median
A clear signal that buyers will stretch for the right combination of location, layout, and move-in readiness. A strong overbid is often a sign of a home listed low to attract a larger buyer pool and ultimately more competition.
For sellers, 16 Winfield shows how aggressive pricing, strong presentation, and a desirable block can pull in multiple offers and push the final price far above list.
For buyers, it’s a reminder that some homes are intentionally priced to start a bidding war and that the “list price” is often just the opening number, not the destination.
2. 80 Bronte St – A Value Play in the Same Month
Address: 80 Bronte St, San Francisco, CA 94110
Type: Single-family home
Listed at:$1,100,000
Sold for:$1,050,000
Sale-to-list ratio:95.45% of list price
Beds / baths: 2 bed / 2 bath
Approx. size: ~2,088 sq ft
On paper, 80 Bronte offers more than double the square footage of 16 Winfield, but the pricing story is very different:
It sold under the list price
Its price-per-square-foot came in well below the neighborhood’s October median
Why does that happen in the same neighborhood at the same time?
Often, it comes down to things like:
Floor plan functionality
Overall condition, needed upgrades and a reminder to carefully review disclosures
Curb appeal and natural light
Micro-location, street feel, and nearby amenities
How the home photographs and shows in person
For sellers, 80 Bronte is a good reminder that size alone doesn’t guarantee a premium. Buyers look at total project costs, future work, and how a home will ultimately live day-to-day.
For buyers, it’s proof that opportunities still exist, even in a competitive month. Homes with quirks, older finishes, or less “Instagram-ready” presentation can offer better value if you’re willing to see past the surface.
What This Means If You’re a Bernal Seller
Putting October’s data together, a few themes emerge for homeowners:
Pricing and presentation still matter—A LOT. Homes that come out aligned with buyer expectations (and visually dialed in) tend to sell faster and higher, sometimes dramatically so.
The first 2–3 weeks are critical. Most of the over-asking sales in October went into contract within about 30 days. If you’re on the market longer than that with little activity, it’s usually a signal that either price or condition (or both) need to be addressed.
Not every strategy is “price low and hope.” For some homes, a more transparent pricing strategy can be appropriate. The key is matching the approach to the property, the current inventory, and your comfort level.
If you’re curious where your home might land in today’s market, closer to a “Winfield” outcome or more in line with the broader averages, a data-backed valuation and prep strategy can make all the difference.
What This Means If You’re a Bernal Buyer
For buyers, October’s numbers may feel intimidating, but there are important takeaways:
Yes, some homes still go far over asking. Especially those that are well-priced, beautifully presented, and in the most sought-after pockets of Bernal.
But there are also under-asking and “fair value” opportunities. Larger or more project-oriented homes, or homes that have been on the market longer, can present a chance to step into Bernal with more room in the budget for upgrades.
Preparation is everything. Having your financing ready, understanding current overbid patterns by price point, and knowing which streets/blocks fit your lifestyle can help you move quickly on the right home and avoid overpaying for the wrong one.
Thinking About Your Next Move in Bernal Heights?
Whether you’re:
A homeowner wondering what your Bernal property might be worth in today’s market, or
A buyer hoping to land a home on the hill without getting swept up in the hype,
we’re happy to walk you through the data behind these October sales and what it means for your specific situation.
Property Types Residential Income, Residential Include Property Subtypes(Residential) Single Family Residence Statuses Closed (10/1/2025 to 10/31/2025) , Sold Off MLS (10/1/2025 to 10/31/2025) Area/District SF District 9 Subdistrict Bernal Heights
Listing Statuses
Active
Pending
Closed
Other
Total
0
0
23
0
23
Aggregate Statistics
Minimum
Average
Median
Maximum
Tot. Val.
0
3
3
4
0
1
2
4
900
1,614
1,436
2,814
0.03
0.05
0.04
0.07
1,472
2,003
1,751
3,063
1890
1927
1922
1989
$899,000
$1,469,978
$1,248,000
$3,295,000
$511.11
$915.95
$946.04
$1,224.14
$20,355,140.19
$32,469,311.53
$27,256,114.29
$69,571,542.86
$880,000
$1,754,498
$1,560,000
$3,900,000
$40,353,450
$502.87
$1,120.21
$1,114.18
$1,663.36
$20,355,140.19
$38,796,218.08
$32,358,857.14
$75,976,744.19
0
28
15
193
2
28
15
193
*Calculations for this field only use listings with valid values; listings with blank or zero values are excluded
DOM Statistics for Closed Listings
# of Listings
% of Total
SP % LP
20
86
121.66
1
4
100.00
0
0
0
0
2
8
96.43
23
100
106.03
CDOM Statistics for Closed Listings
# of Listings
% of Total
SP % LP
20
86.96
121.66
1
4.35
100.00
0
0.00
0
0.00
2
8.70
96.43
23
100
106.03
📬 Curious about your home’s value or planning a 2026 move?
Reach out for a no-pressure consultation and a customized market report for your block. We’ll review recent Bernal sales (including overbids and underbids), talk strategy, and help you decide what timing and approach make the most sense for you.