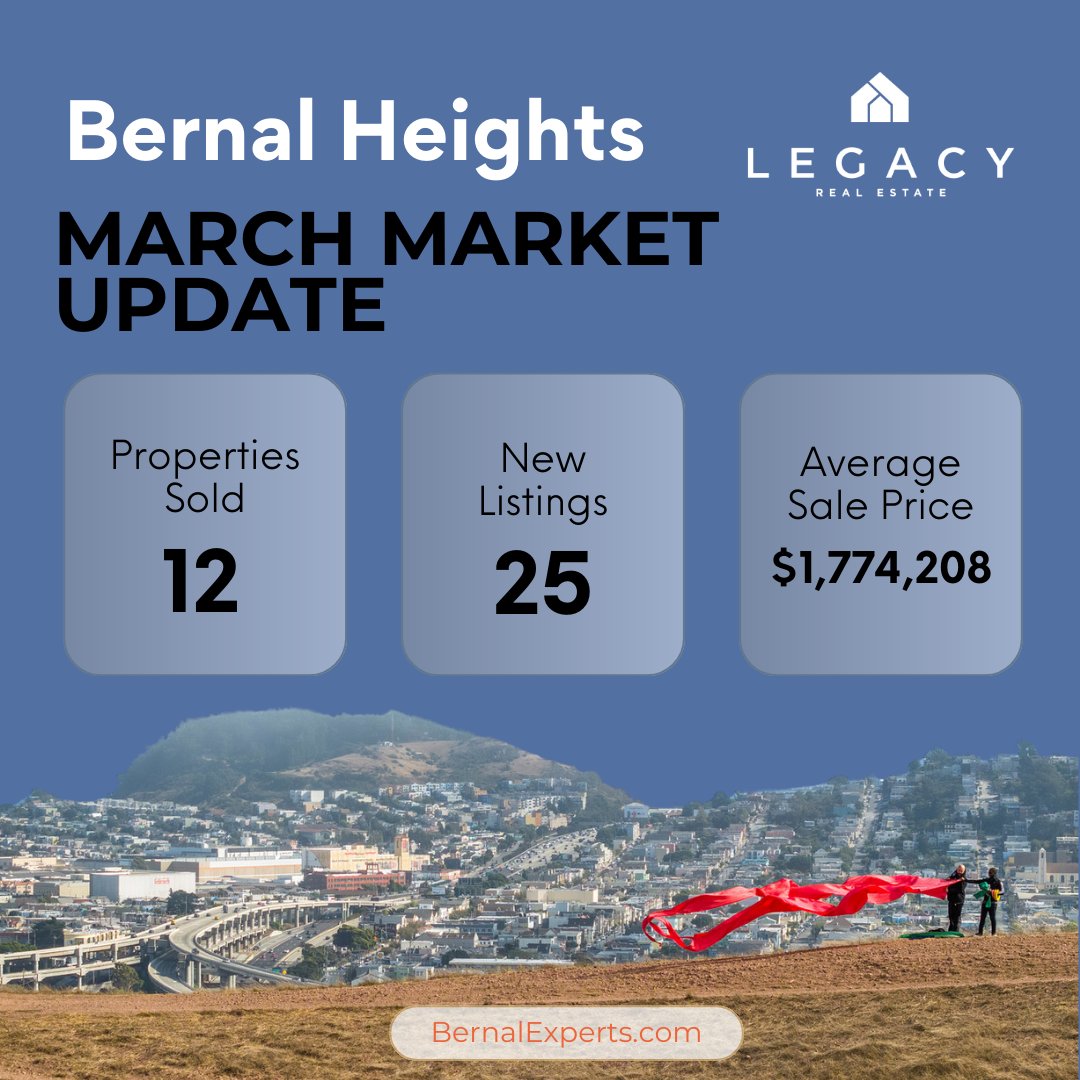
Exploring the March 2025 Home Sales in Bernal Heights
March 2025 marked an eventful month for the real estate market in Bernal with three notable single-family home sales, two straddling the $2.5M mark, and 114 Virginia cresting the $3M mark. Let's delve into the numbers and overarching trends of Bernal's housing community.
Highlighting Record-Breaking Sales
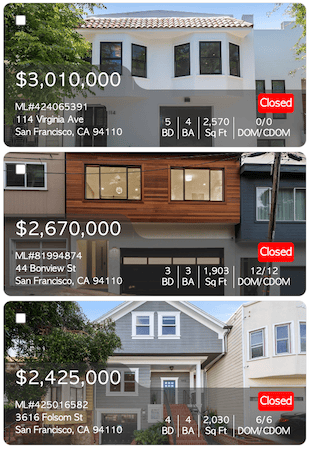
Three notable sales topped the charts last month:
114 Virginia Avenue This single-family home sold for a remarkable $3,010,000. With five bedrooms and four bathrooms, its spacious design and modern amenities cater to luxury living in a historic setting.
44 Bonview This single-family home with three bedrooms and three bathrooms sold for $2,670,000 after 12 days on the market. Boasting numerous high-end upgrades, an open floor plan, new roof, and high-end appliances.
3616 Folsom St Sold for $2,425,000, with four bedrooms, four bathrooms, and a 1,746 sq ft lot, it boasts high ceilings, rich wood floors, bundled with modern appliances and a classic Victorian facade.
Delving into Market Metrics
The Bernal Heights March market demonstrated a majority of residential properties and one residential income sale. Here’s a snapshot of key metrics that defined March 2025.
Pricing Insights:
Listing Prices: Range from $748,000 to $2,900,000, with an average of $1,545,163.
Closed Prices: Range from $748,000 to $3,010,000, with an average of $1,774,208.
Closed Price Per Square Foot: Ranges from $689.51 to $1,403.05, averaging $1,100.48 (median of $1,182.89).
Pricing Insights - Sales Price
Median Price Per Square Foot
Bernal Heights New Listings
Bernal Heights Days On Market
Critical insights show that 67% of homes sold within the first 30 days, reflecting high demand. The fast-moving market (majority closing within 30 days) calls for decisive and speedy actions from buyers.
Percent of Original List Price
Winning offers in Bernal averaged 14% over the list price in Bernal, up from February.
Statistical Summary
Property Type Residential Statuses Closed (3/1/2025 to 3/31/2025) , Sold Off MLS (3/1/2025 to 3/31/2025) Area/District SF District 9 Subdistrict Bernal Heights
Listing Statuses
Total
12
Aggregate Statistics
Minimum
Average
Median
Maximum
Tot. Val.
2
3
3
5
1
2
2
4
903
1,592
1,633
2,570
0.04
0.05
0.04
0.07
1,746
2,260
1,956
3,188
1900
1938
1934
2004
$748,000
$1,545,163
$1,347,500
$2,900,000
$549.26
$960.71
$1,002.92
$1,313.69
$11,805,391.30
$32,232,660.39
$25,793,587.81
$64,881,355.93
$748,000
$1,774,208
$1,690,000
$3,010,000
$21,290,500
$689.51
$1,100.48
$1,182.89
$1,403.05
$11,805,391.30
$37,126,821.96
$33,649,690.09
$67,342,372.88
0
19
13
52
0
19
13
52
*Calculations for this field only use listings with valid values; listings with blank or zero values are excluded
Conclusion
Bernal Heights continues to show the character and resilience that make it one of San Francisco’s most beloved neighborhoods. Whether you’re tracking market trends out of curiosity or planning your next move, staying informed helps you make confident decisions in a dynamic real estate landscape.
For those actively exploring what’s on the market, you can browse current Bernal listings through our home search portal. And if you're wondering what your own home might be worth in today’s market, feel free to request a free, no-obligation CMA.
Recently, we had the honor of helping longtime Bernal homeowners sell their charming Victorian. With thoughtful preparation, strategic marketing, and a deep understanding of the neighborhood, we were able to guide them through a successful sale—showing that even in a shifting market, Bernal homes hold strong appeal (read more).
Have questions or want to dive deeper into Bernal data? We’re always happy to chat—no pressure, just real talk about real estate.