San Francisco Housing Market Update: 2026 Prices Surge as Inventory Stays Tight
April 17, 2026

April 17, 2026
Note: You can find the charts and graphs for the Big Story at the end of this section.
Click here to jump to San Francisco housing data.
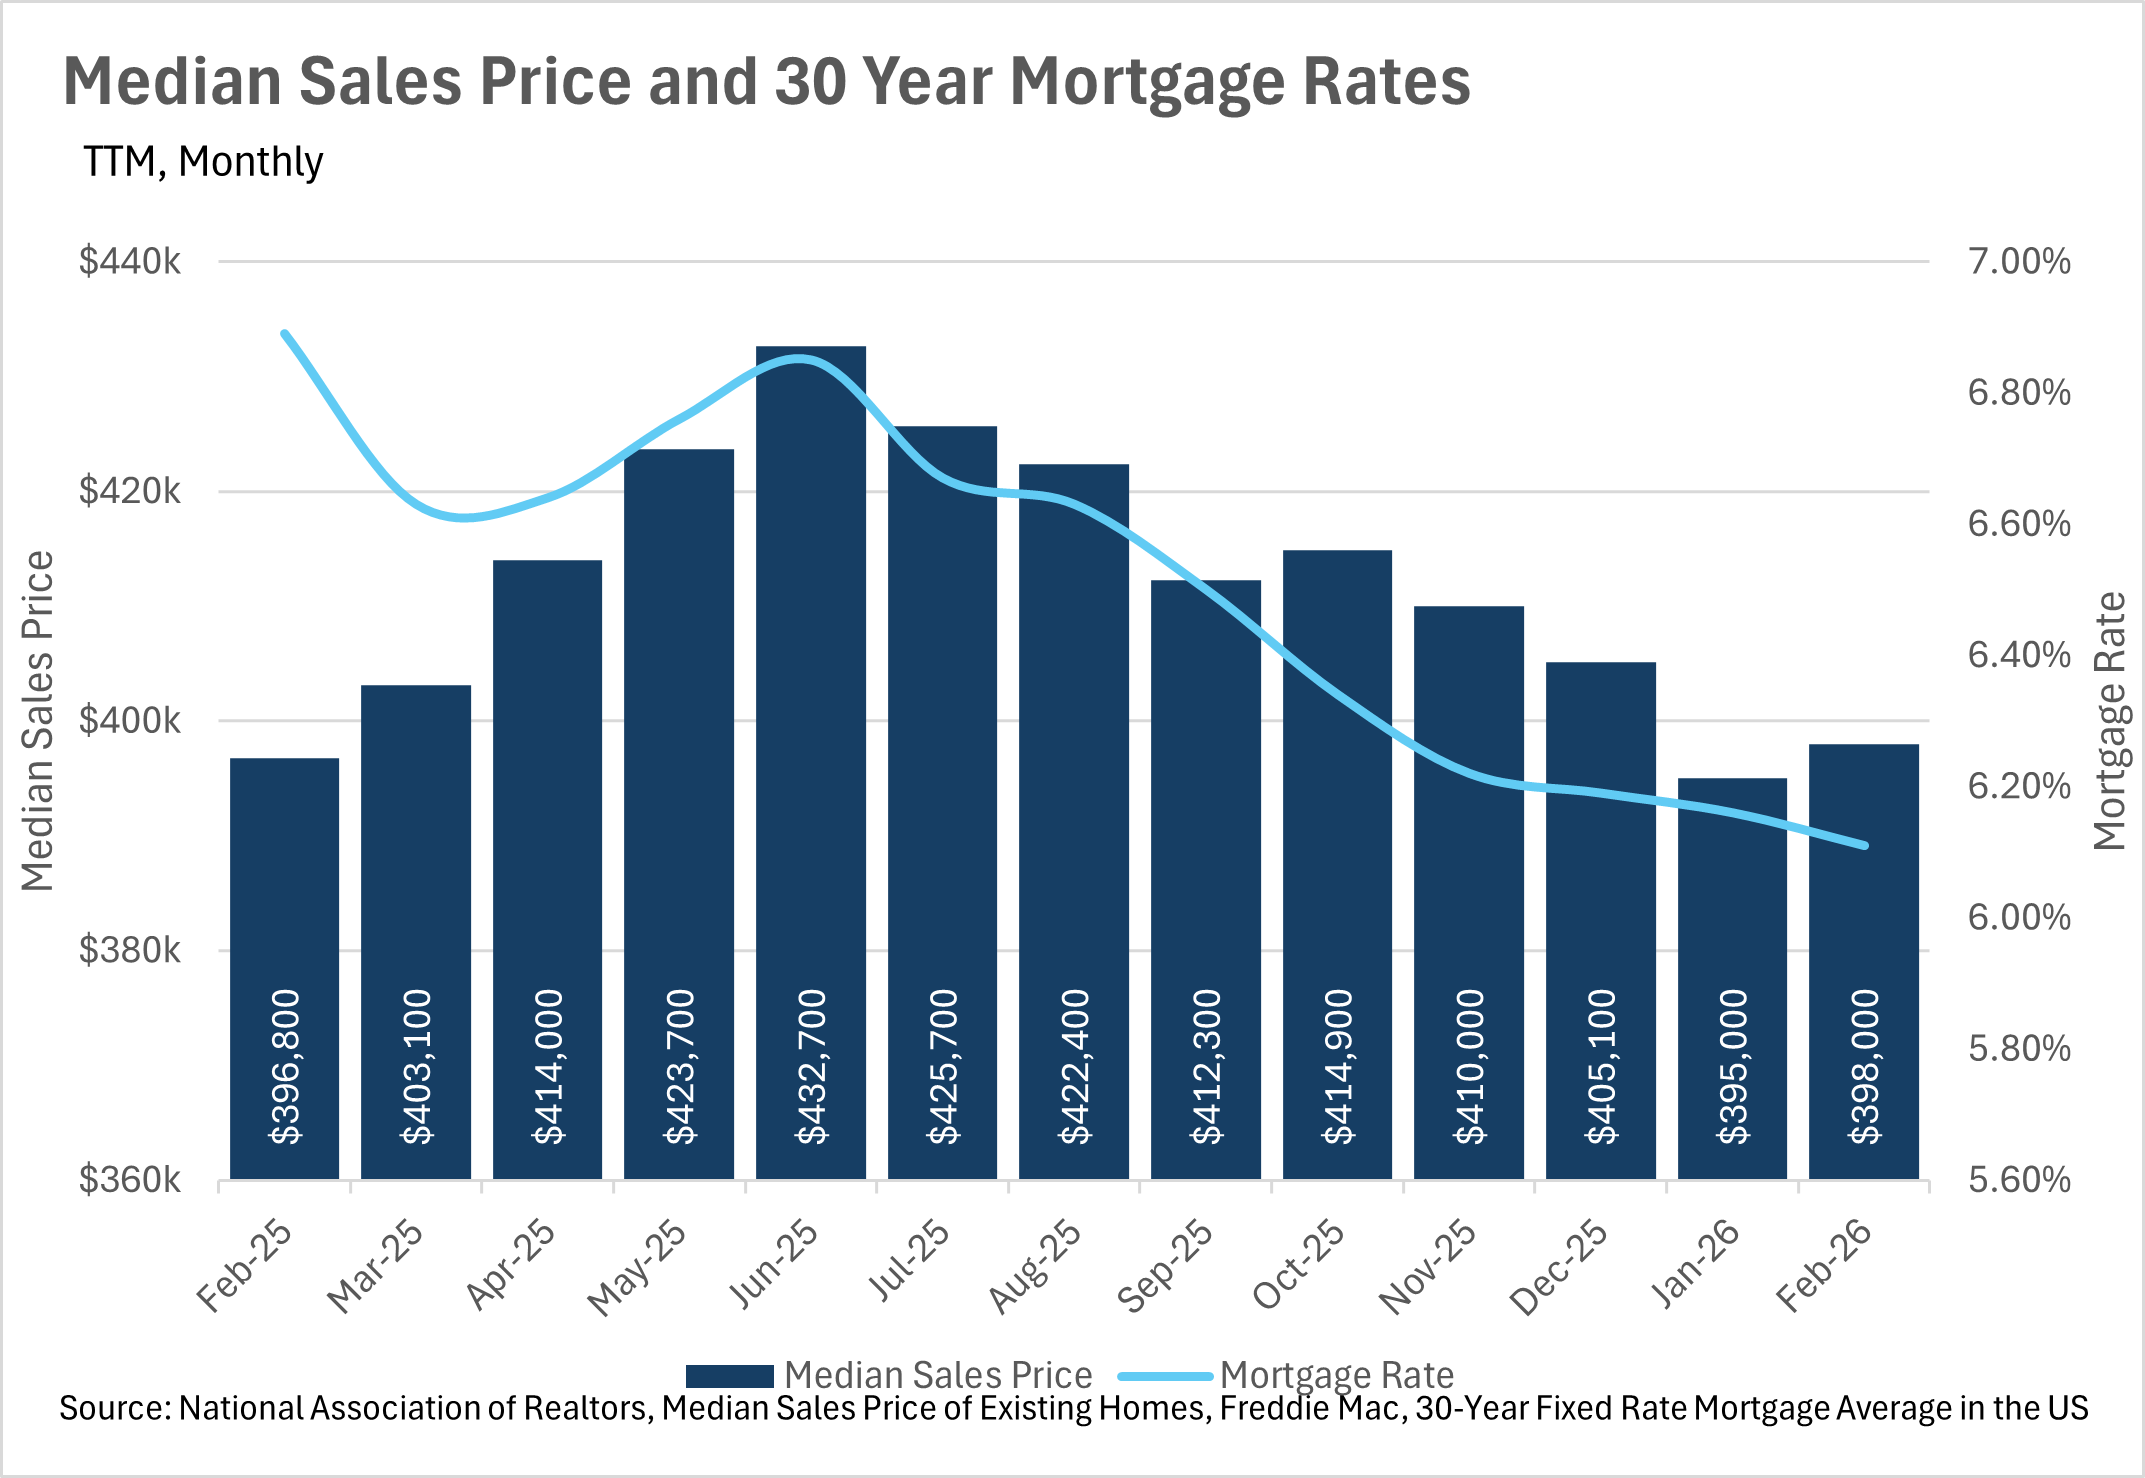
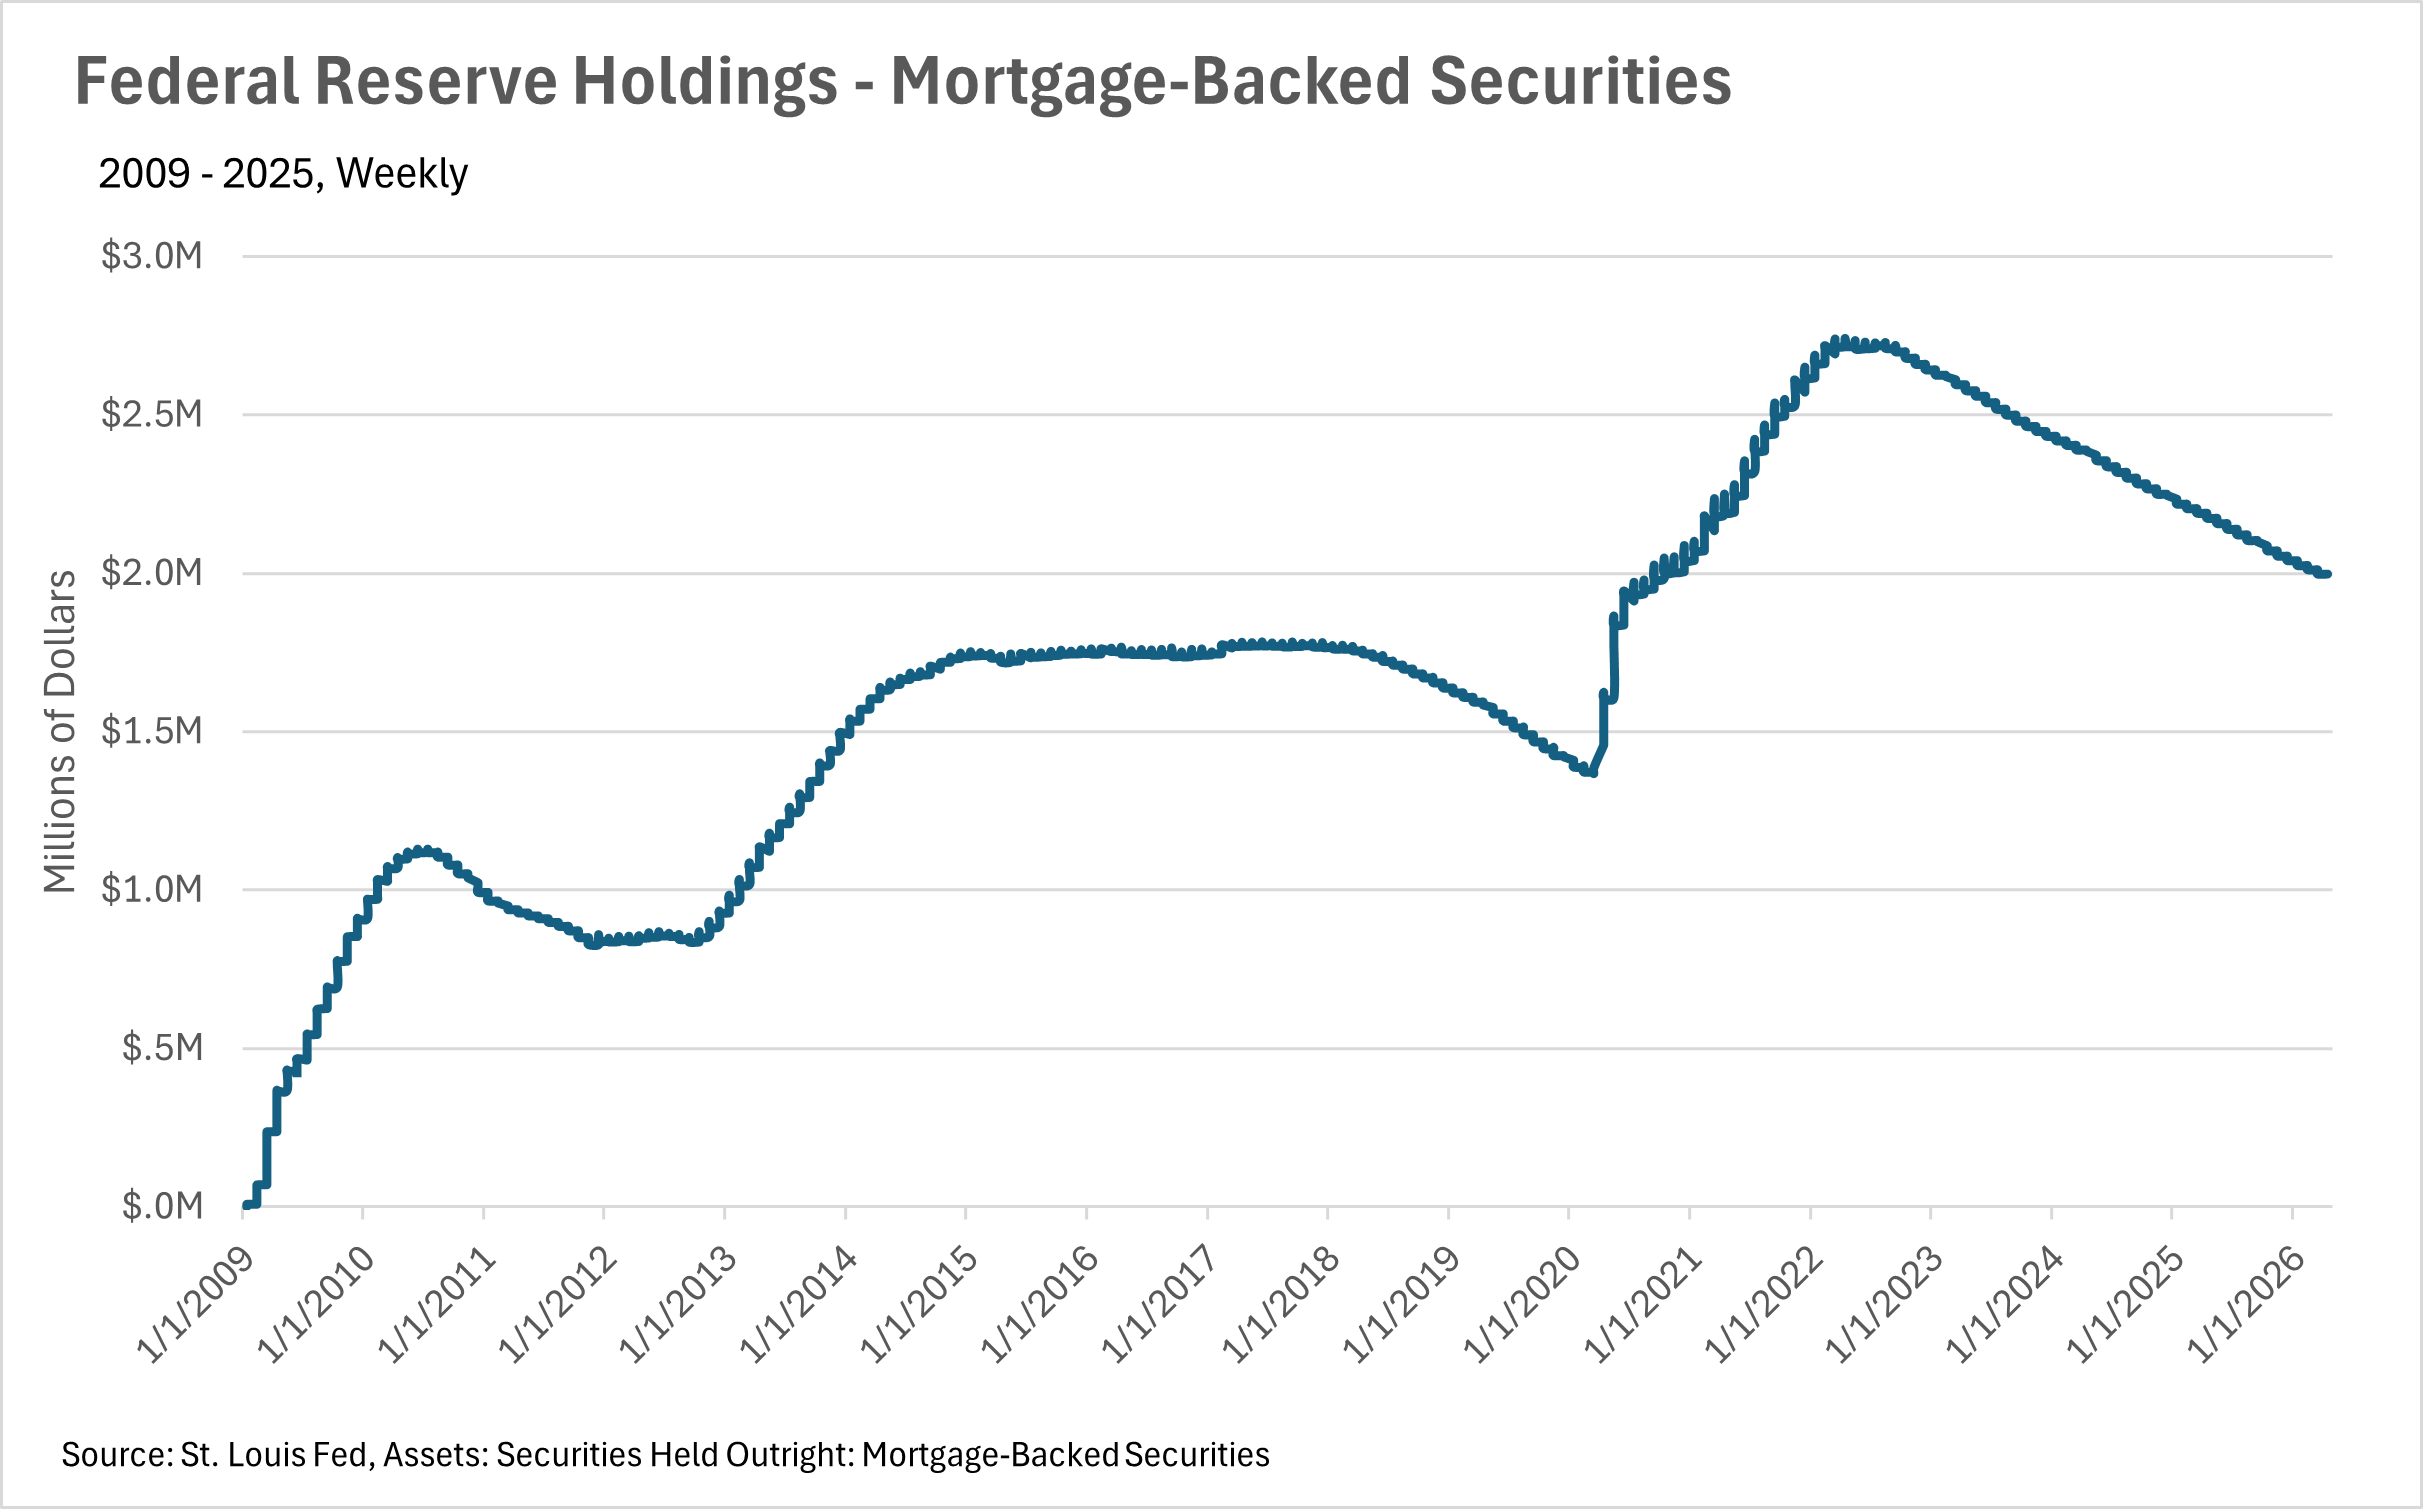
Although median home sale prices have remained remarkably stable over the past several months, the continued decline in mortgage rates is making homeownership considerably more affordable than it was just a year ago.
In February, the median home sold for $398,000, representing a modest 0.30% year-over-year increase and a 0.76% uptick from January.
On the mortgage rate front, the average 30-year rate dropped to 6.11% in February, representing an 11.32% year-over-year decline from the 6.89% we were seeing at this time last year.
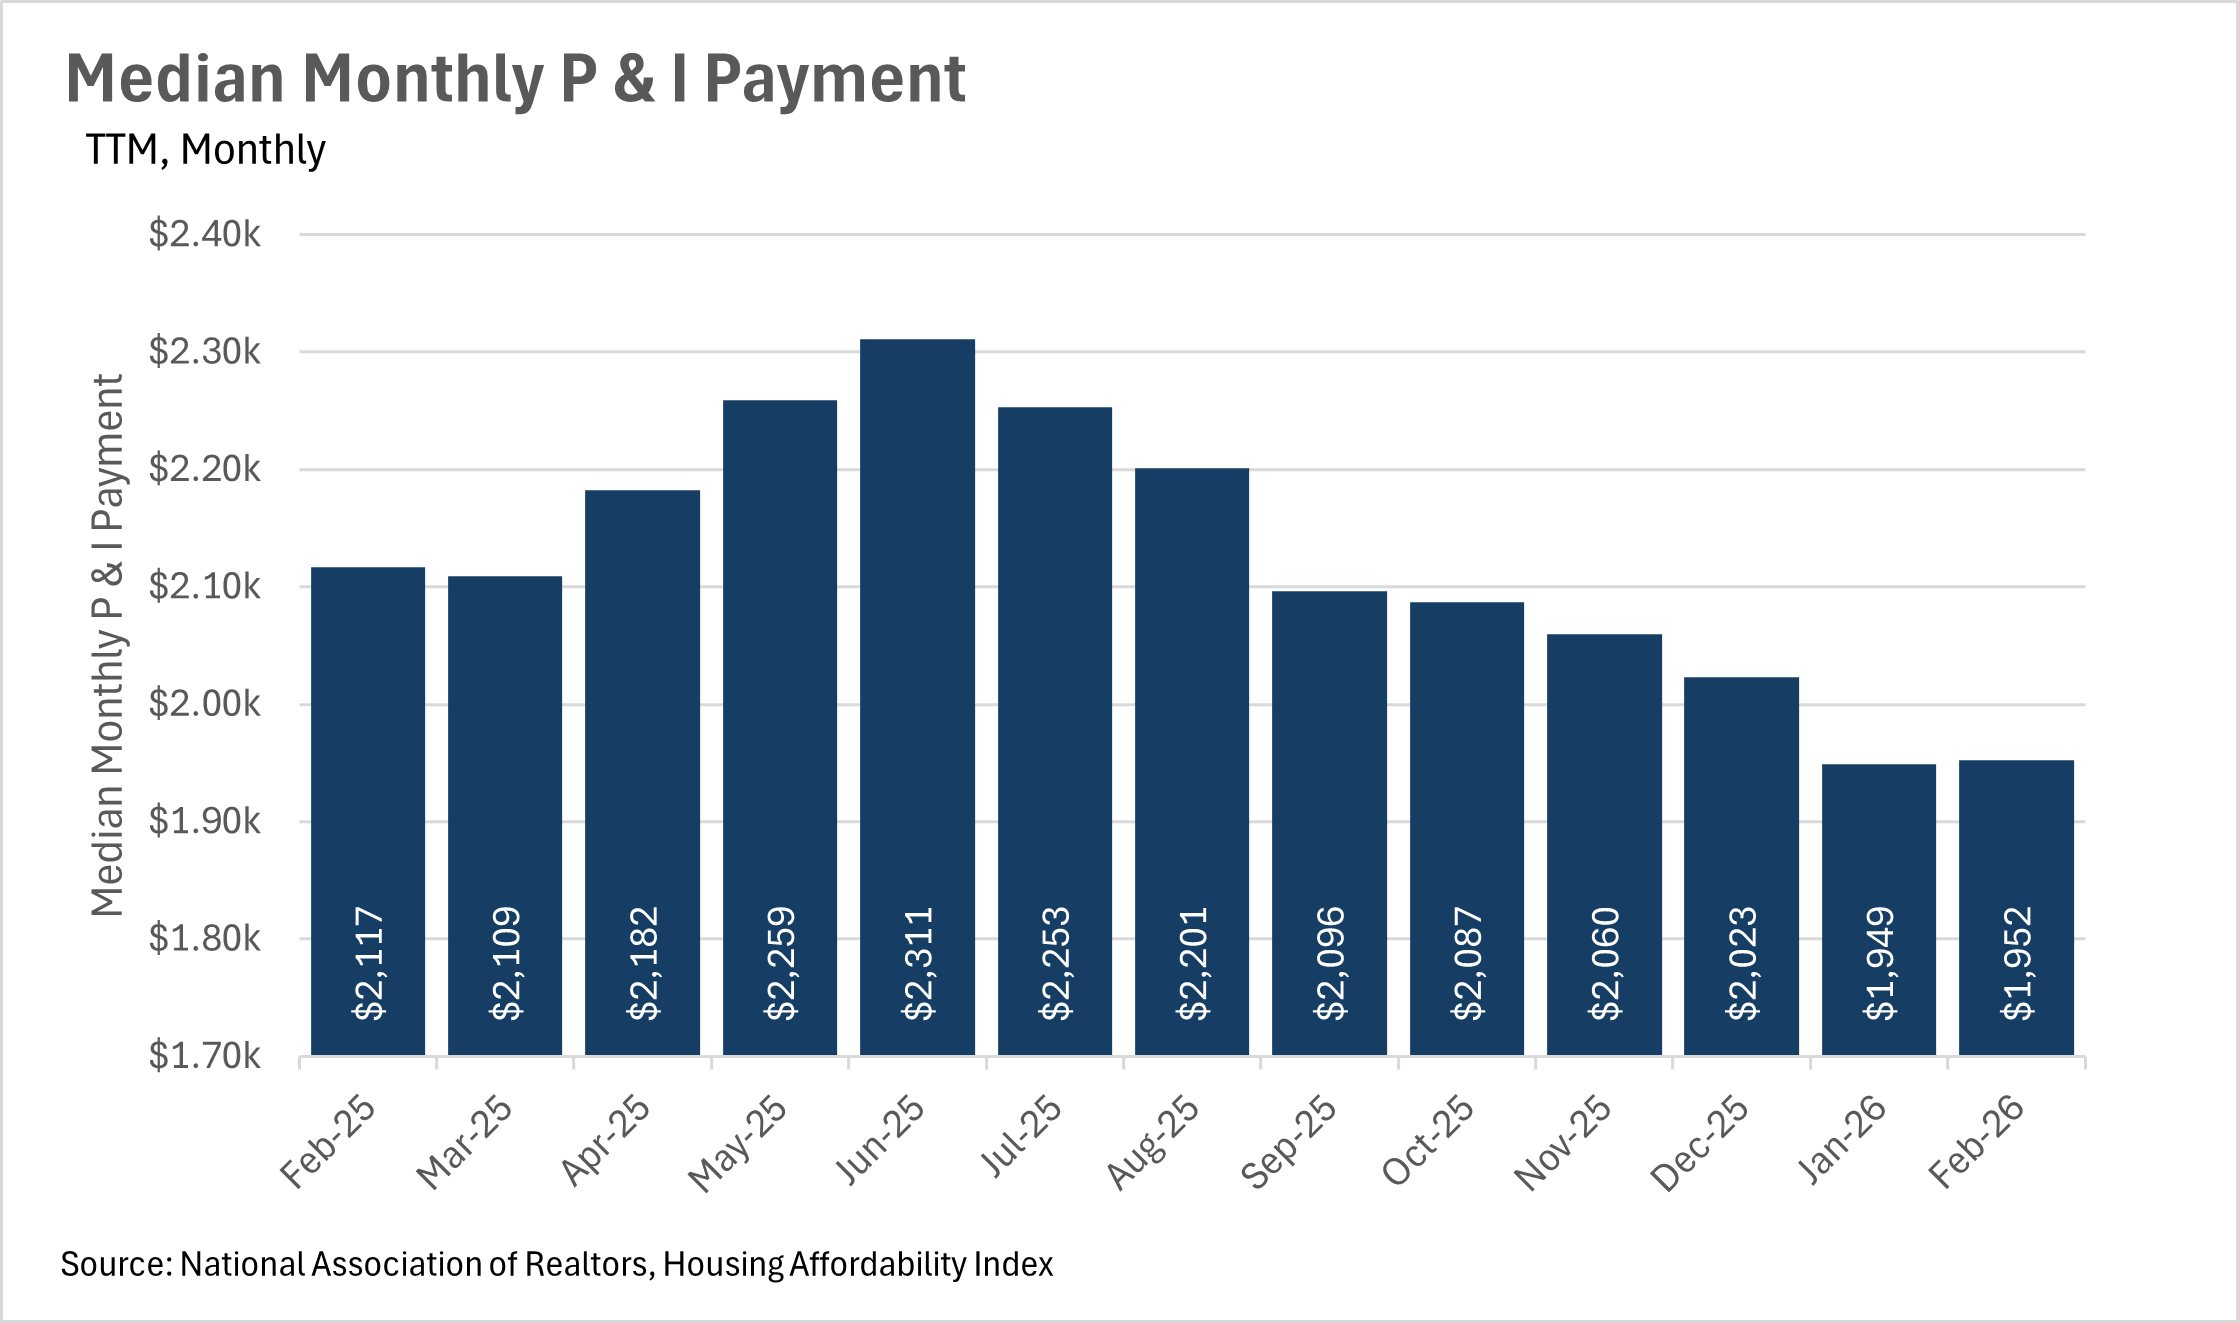
This decline in rates has had a major impact on what the average homeowner is paying each month. The median monthly principal and interest payment came in at $1,952 in February, down 7.79% from the $2,117 the median homeowner was paying just a year ago. That is approximately $165 in monthly savings, which is a meaningful boost to the average American’s budget.
If rates continue to trend downward, we could see buyers start to return to the market in a more meaningful way as we move deeper into the spring and summer months.
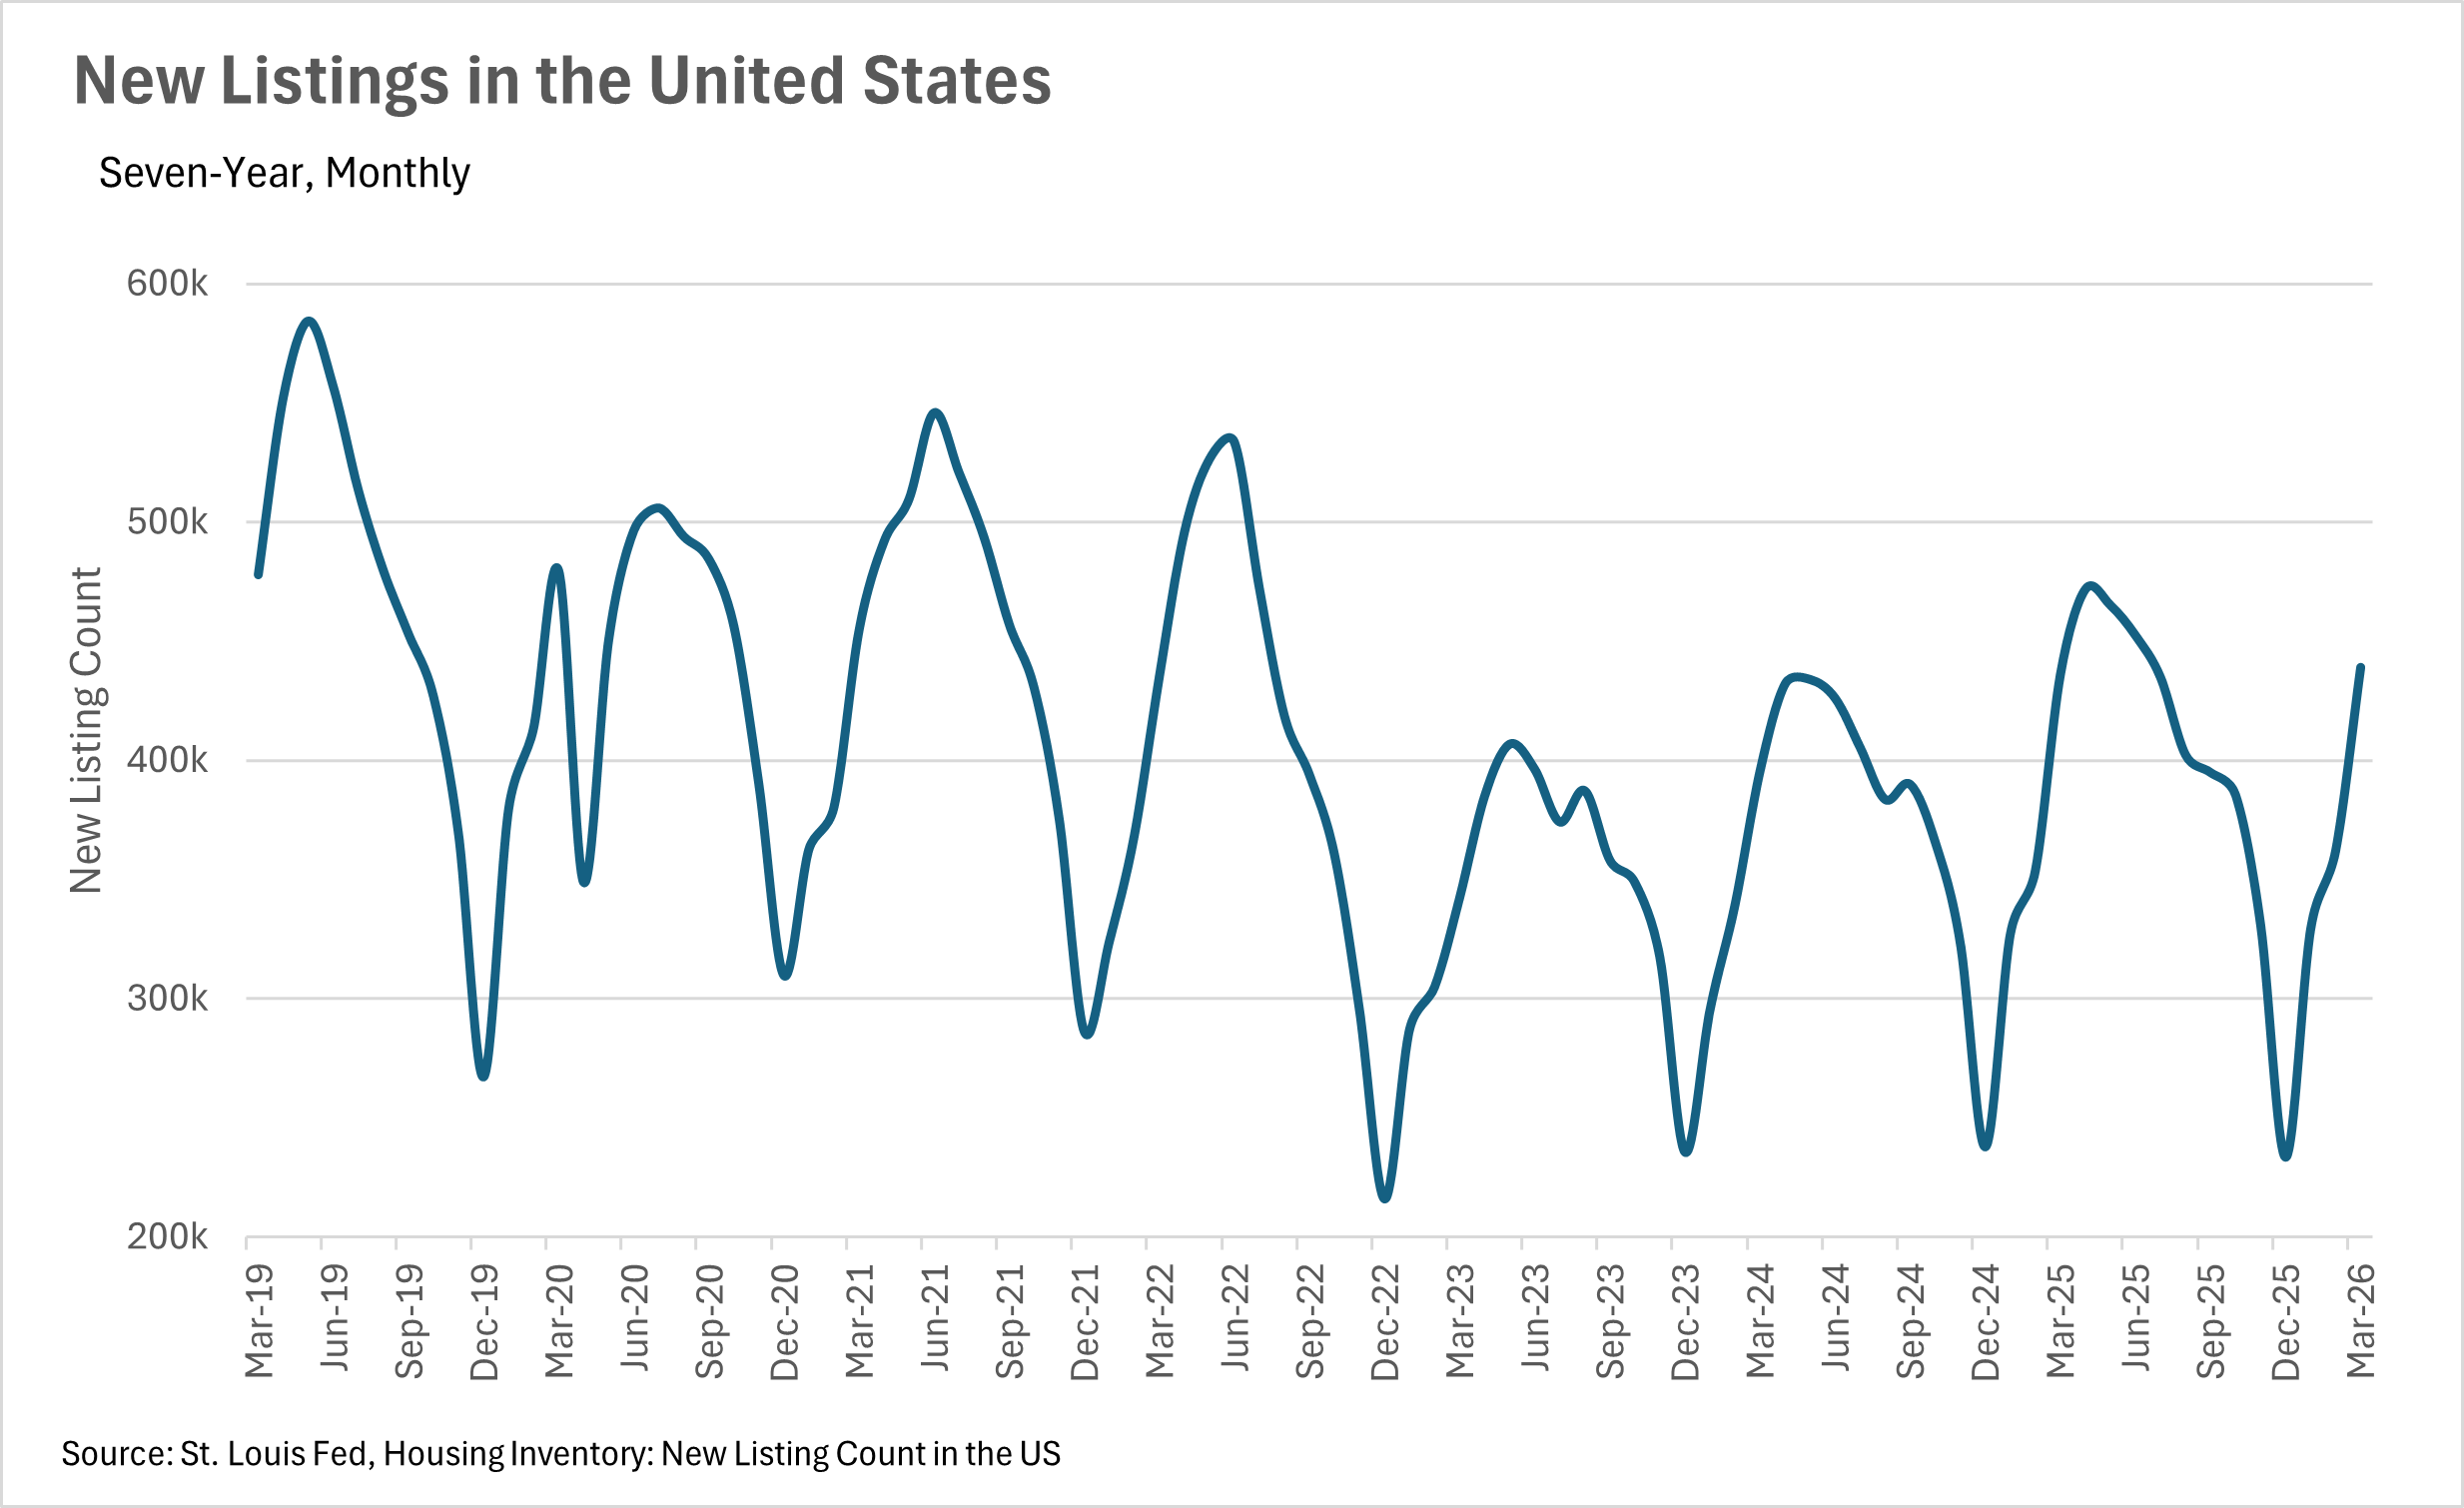
One of the most encouraging stories in the housing market right now is the dramatic increase in new listings as we move into the spring selling season.
In March, there were 439,000 new listings that hit the market, representing an eye-popping 21.21% month-over-month increase and a 0.70% year-over-year increase.
This surge in new listings is a welcome sight, as it means buyers will have considerably more options to choose from as the market heats up.
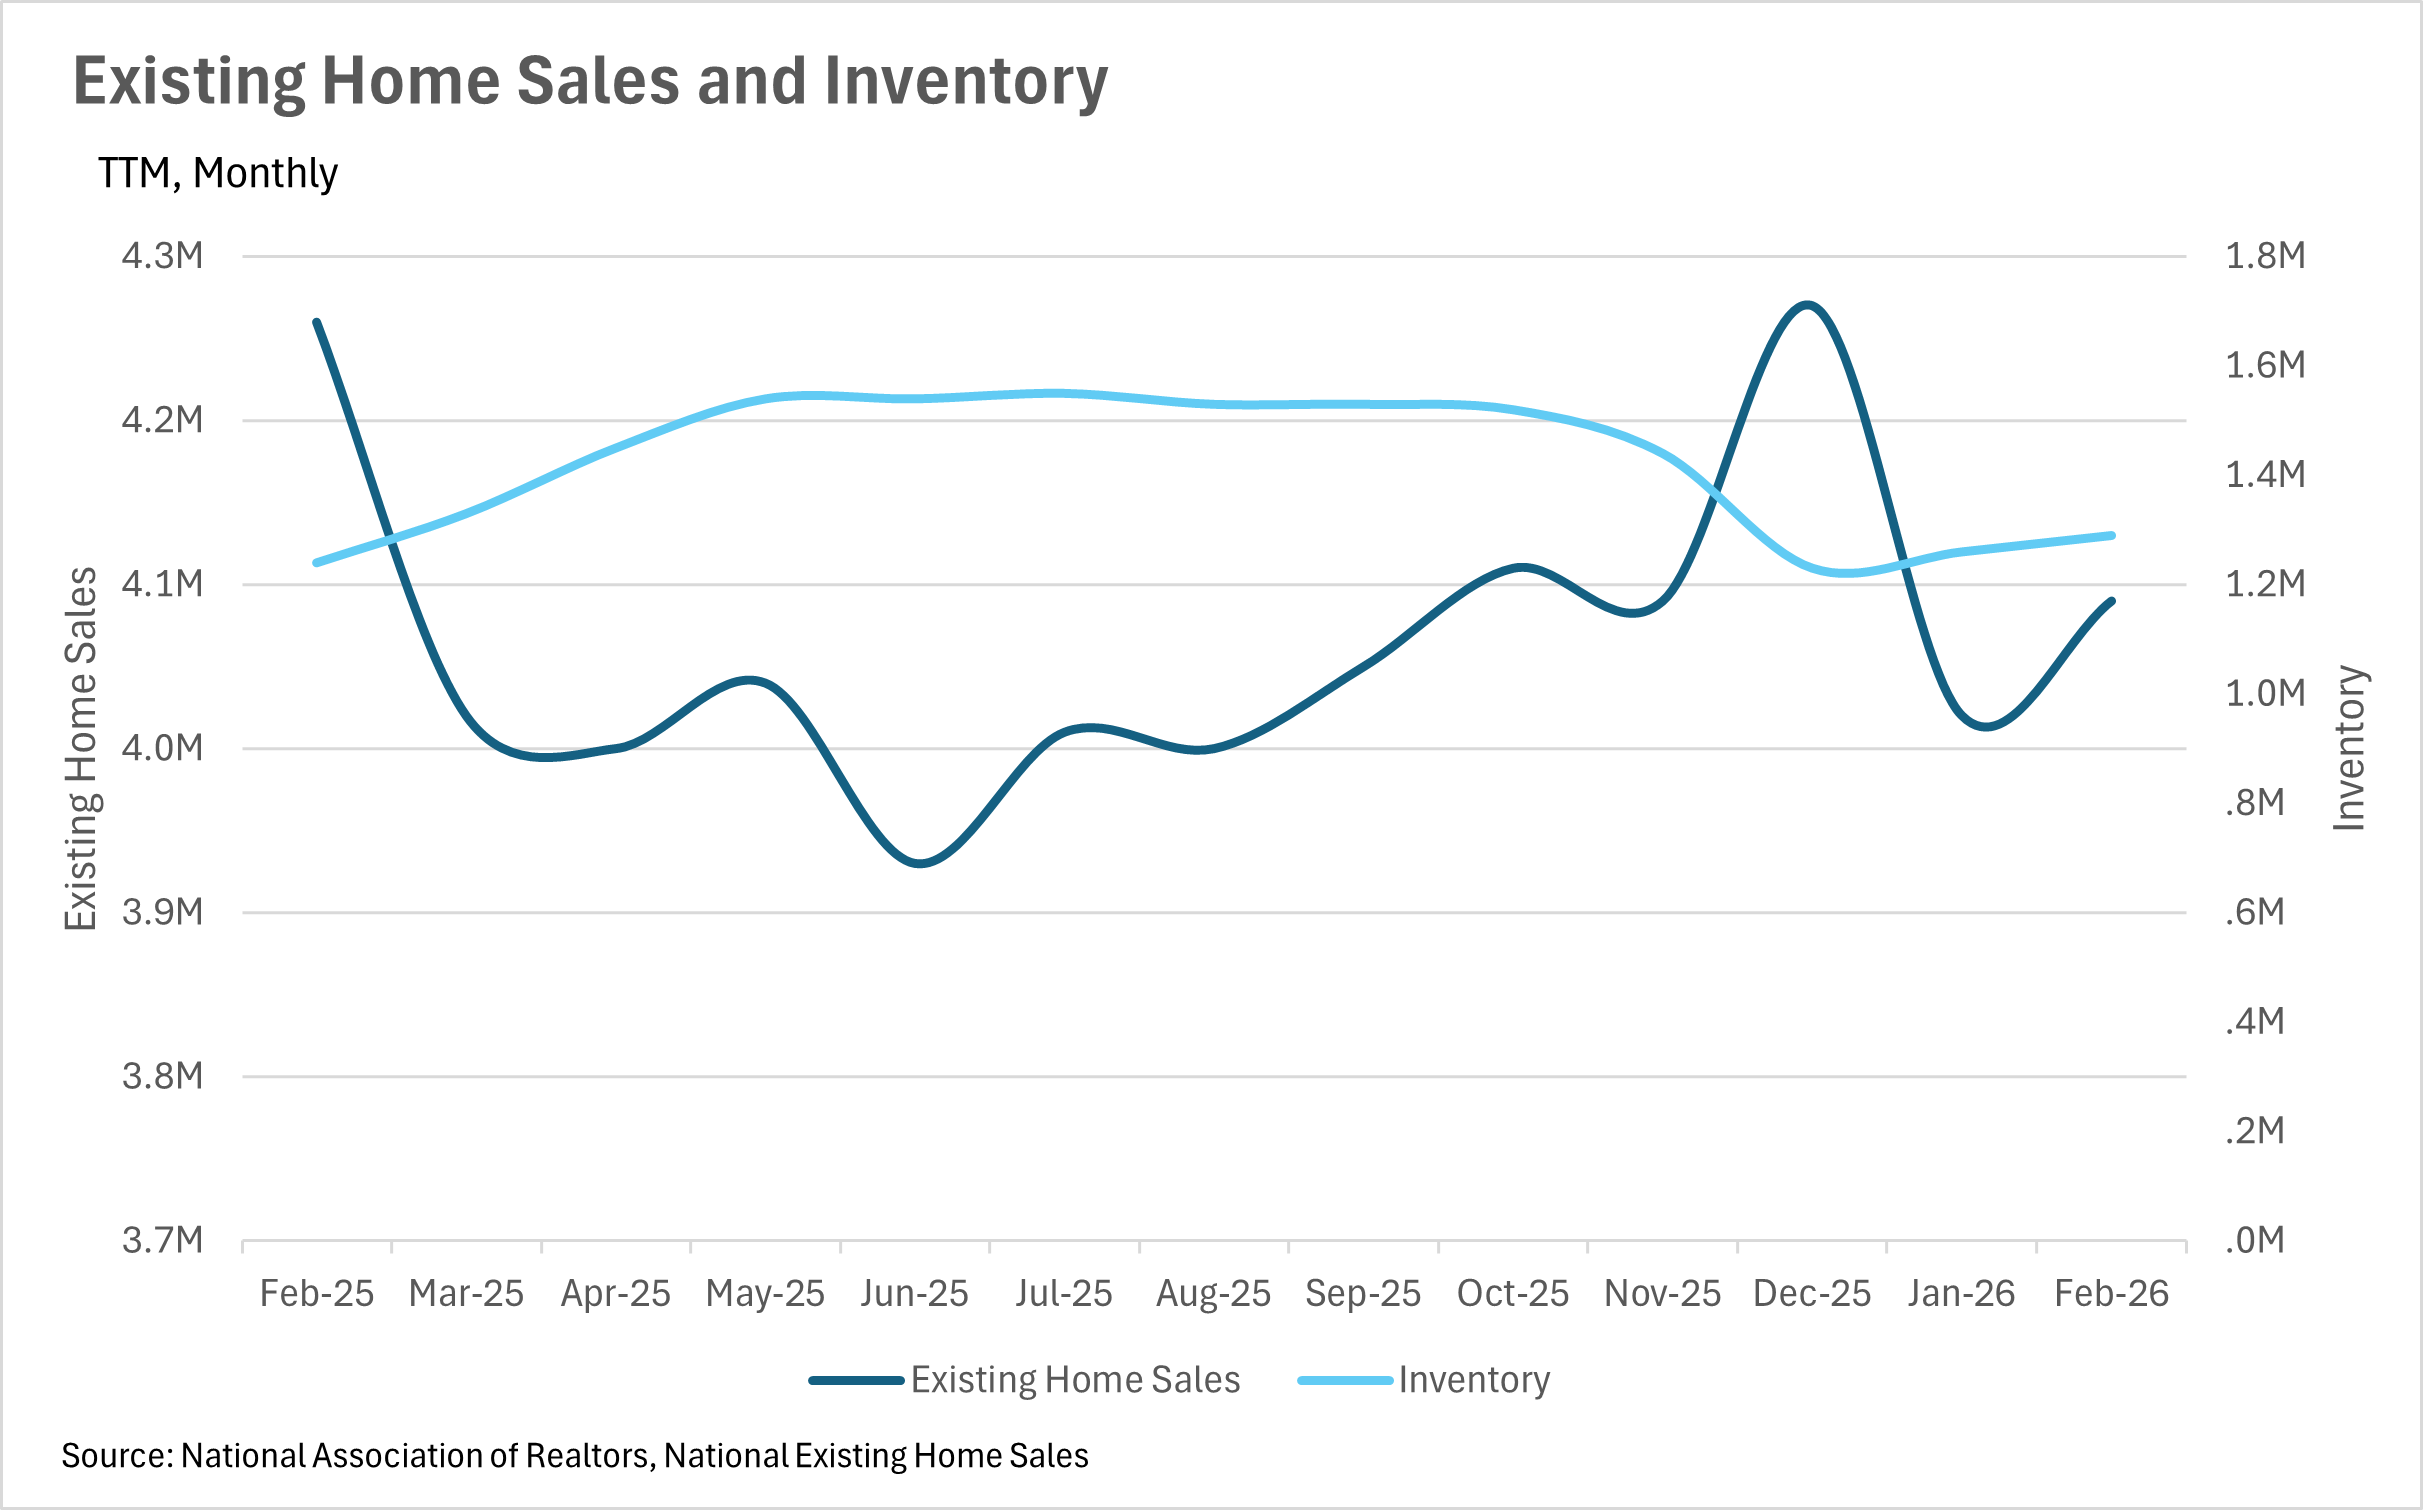
On the inventory side, there were 1,290,000 homes available for sale in February, representing a 4.03% year-over-year increase and a 2.38% month-over-month increase.
This gradual build in inventory, combined with the huge surge in new listings, should give buyers some breathing room as we head into the busier months of the year. That said, inventory levels still have a long way to go before they reach what would be considered truly healthy levels, so it will be worth watching whether this momentum carries through spring.
After a sluggish January, existing home sales rebounded slightly in February, with 4,090,000 homes changing hands.
This represents a 1.74% month-over-month increase, but still comes in 3.99% below where we were at this time last year.
While it is encouraging to see sales pick back up, the year-over-year decline tells us that buyers are still being cautious despite the substantial drop in mortgage rates over the past year.
Part of the story may be that buyers are waiting to see even more rate cuts before jumping in, or they may be waiting for the influx of new listings to give them more options.
Either way, it will be fascinating to see whether the combination of lower rates, climbing inventory, and a fresh wave of new listings is enough to bring buyers off the sidelines in the coming months.
When determining whether a market is a buyers’ market or a sellers’ market, we look to the Months of Supply Inventory (MSI) metric.
The state of California has historically averaged around three months of MSI, so any area with about three months of MSI is generally considered a balanced market. Markets with less than three months are considered seller’s markets, while markets with more than three months are considered buyer’s markets.
At the national level, we are seeing an interesting dynamic play out. Inventory is growing at a modest pace year over year, existing home sales are lagging slightly behind last year’s figures, and new listings are surging just as we head into the traditionally busy spring season.
All of this suggests that the market is slowly tilting back toward a more balanced state, which would be welcome news for buyers who have been dealing with tight inventory for years. However, if mortgage rates continue to drop and buyers finally decide to come off the sidelines, we could just as easily see the market swing back in favor of sellers.
As always, real estate is highly localized, which is why it is so important to look at what is happening in your local market below in the Local Lowdown.
Note: You can find the charts and graphs for the Local Lowdown at the end of this section.
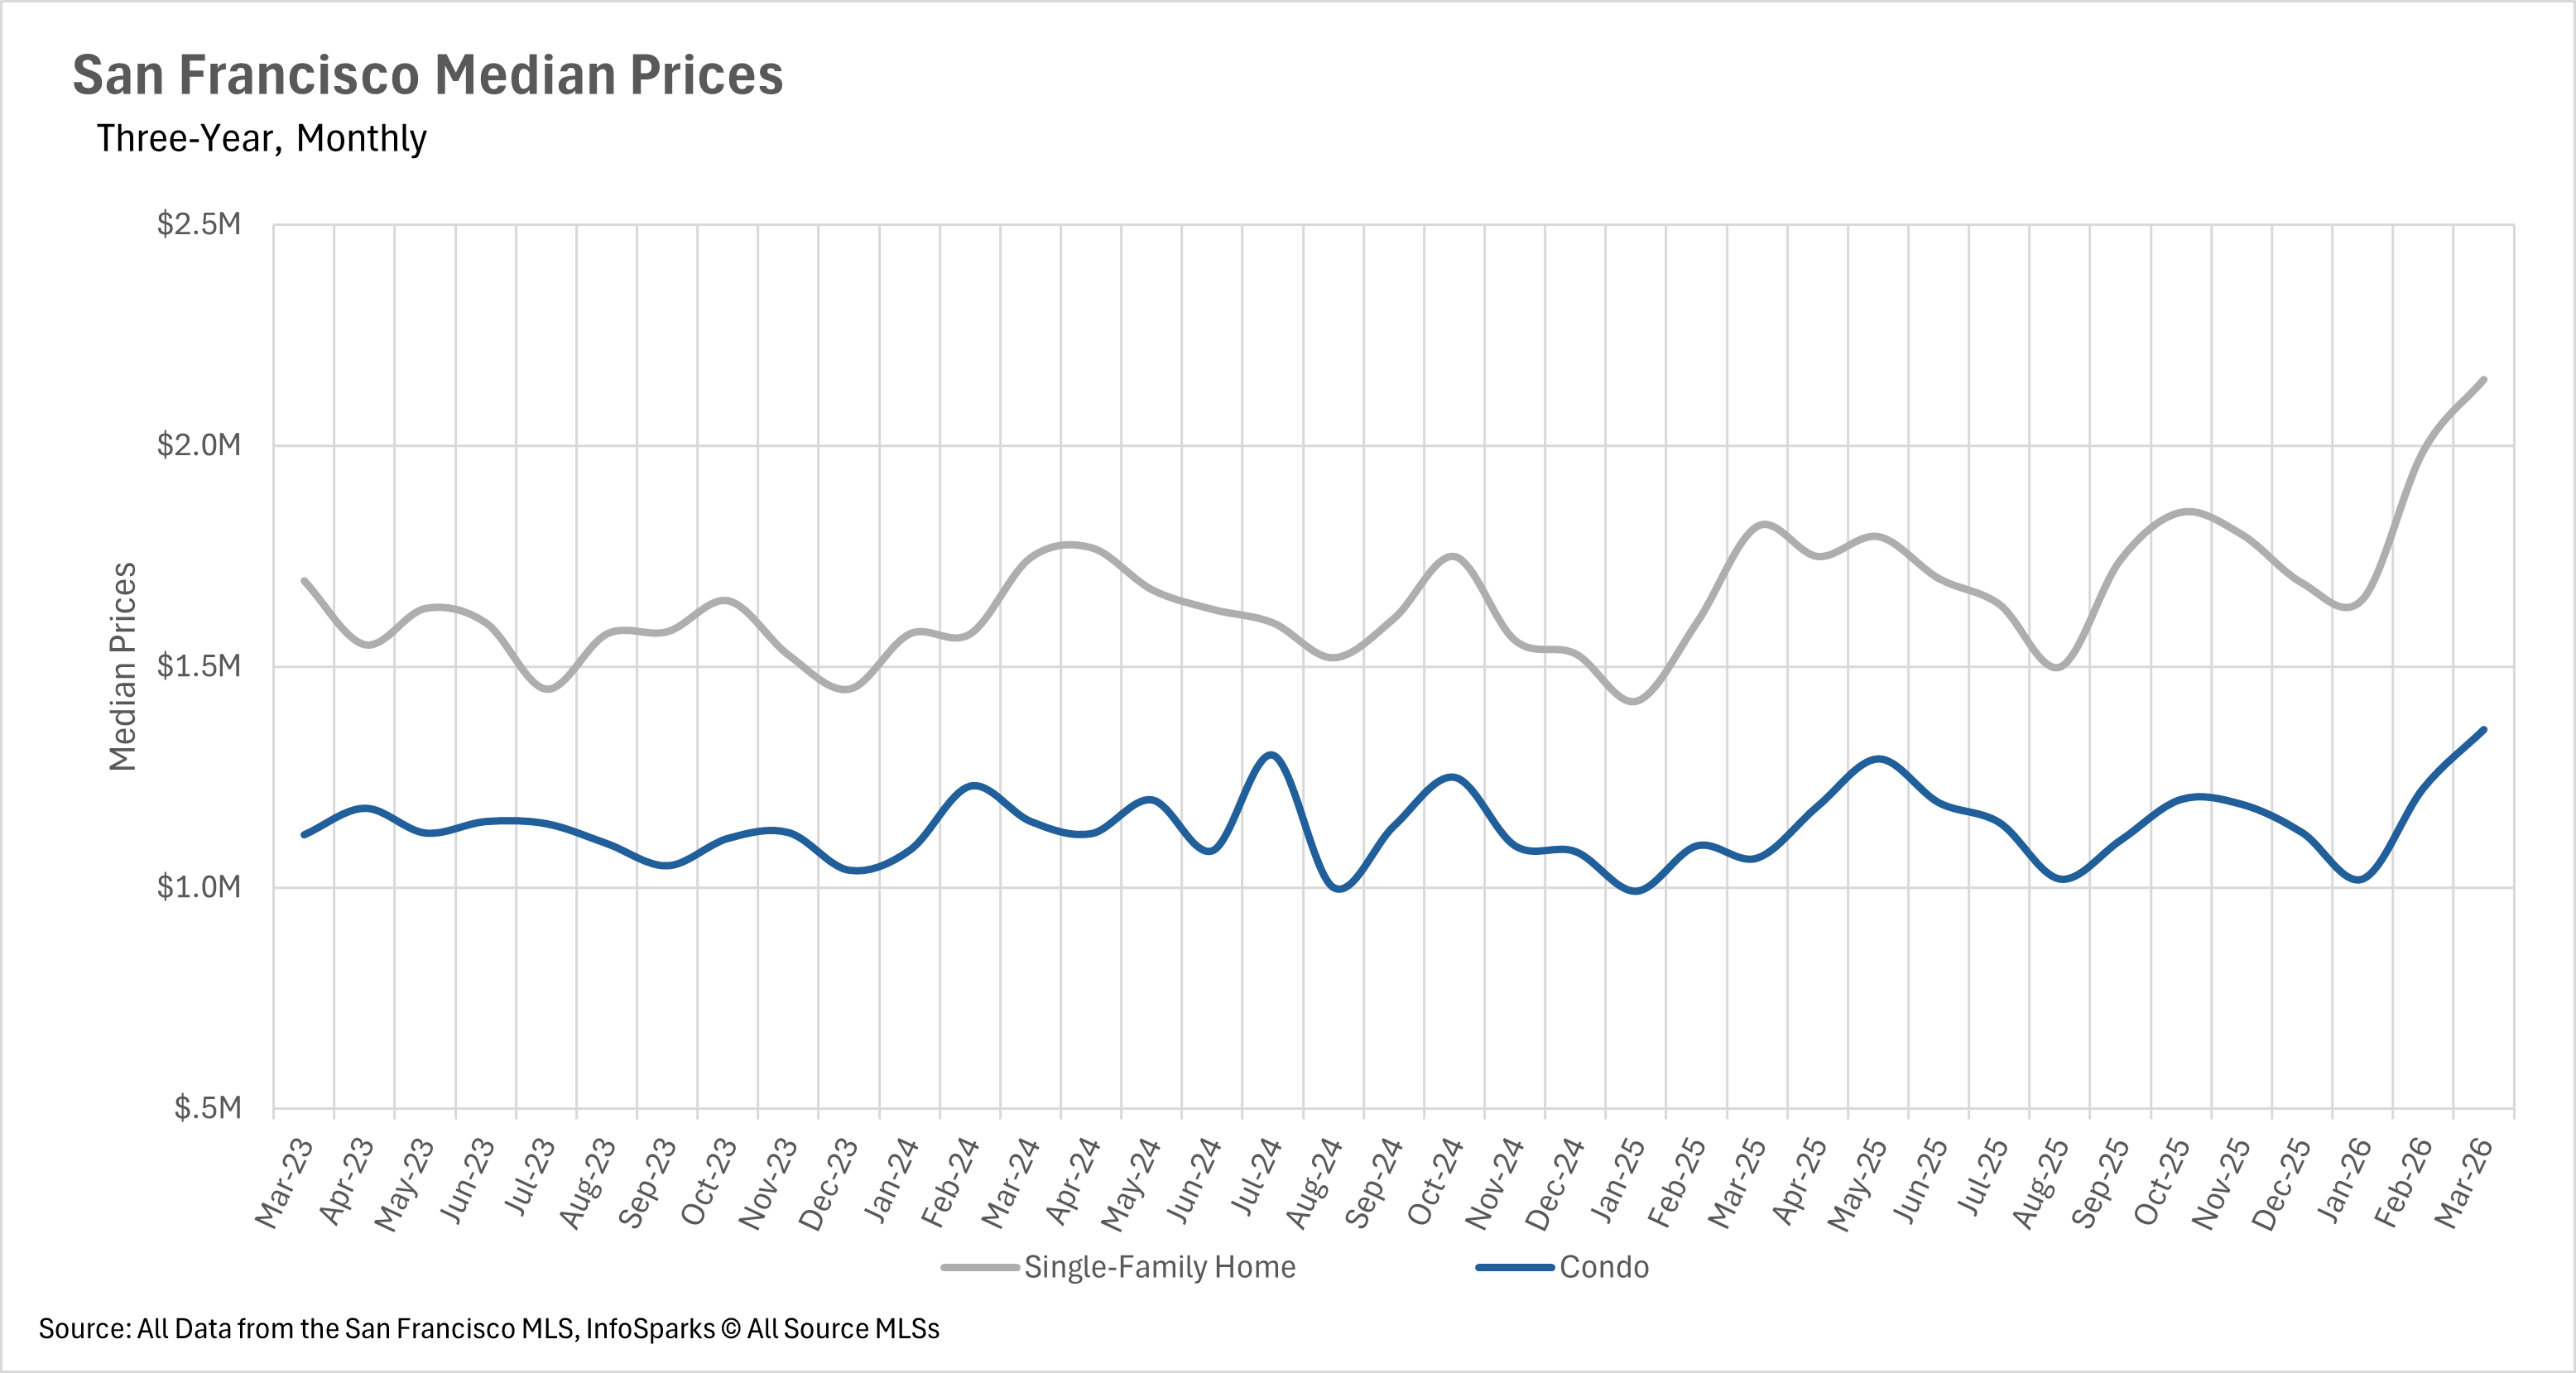
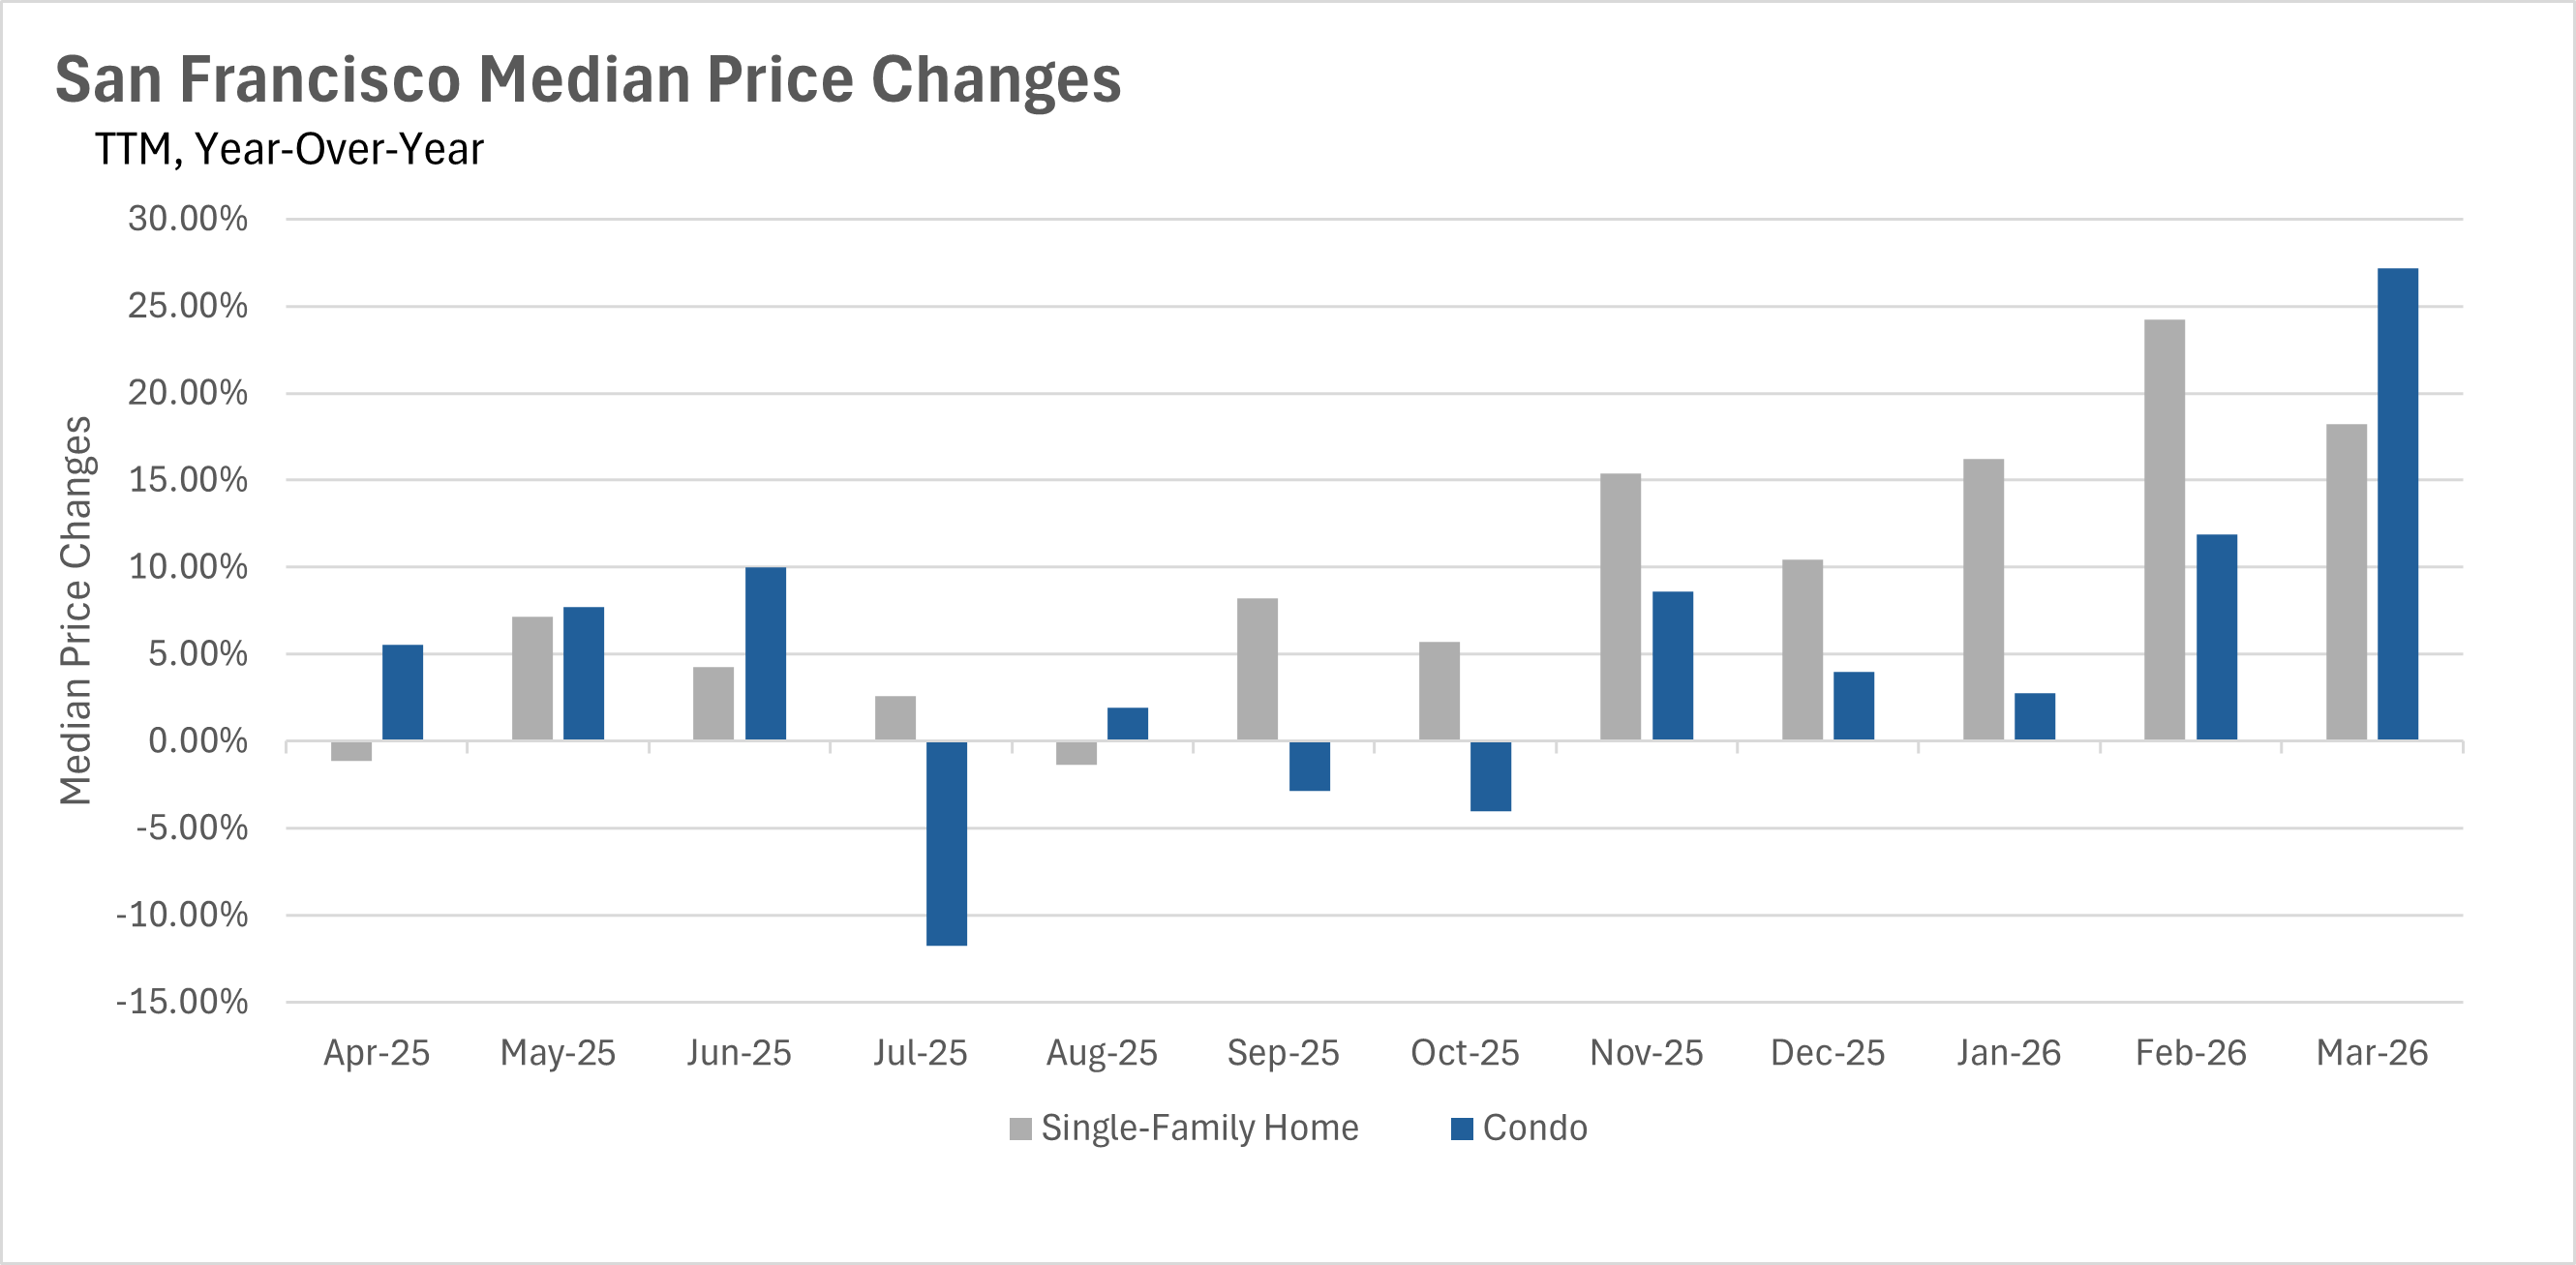
March brought explosive price appreciation to San Francisco, with both property types posting exceptional year-over-year gains.
Single-family homes saw an 18.24% increase in median sale price, with the median home selling for $2,150,000.
The condo market stole the spotlight this month, however, with a remarkable 27.17% surge in median sale price to $1,357,500.
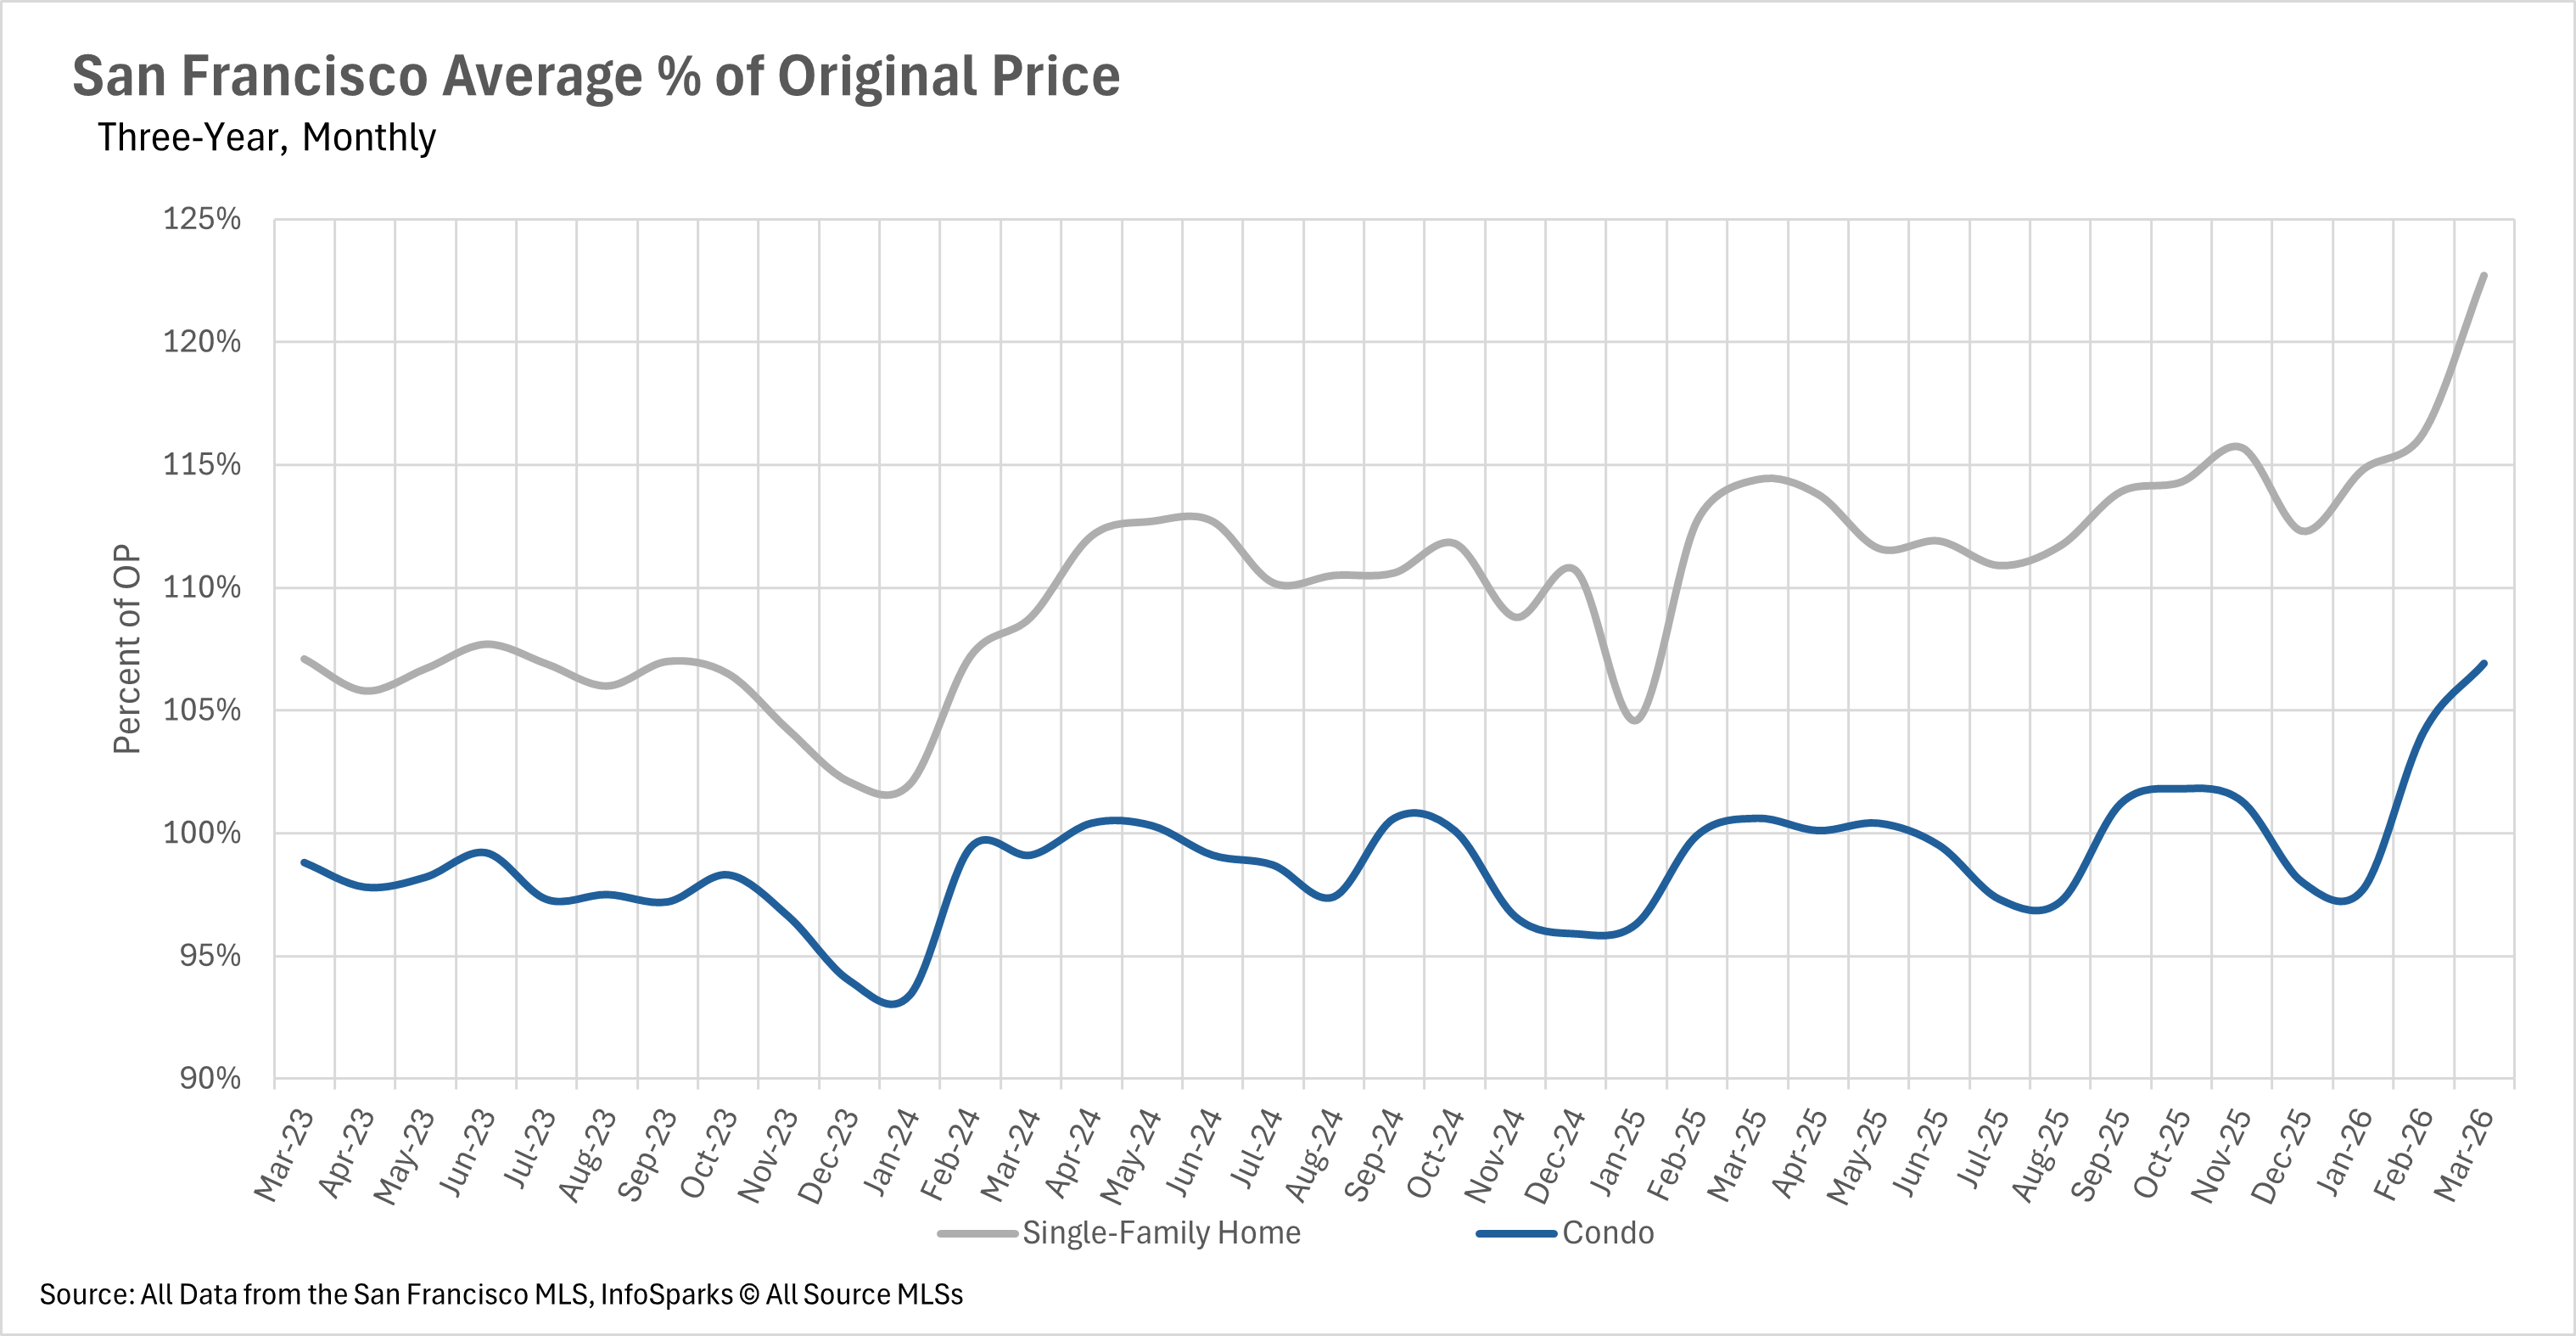
Competition for homes has reached an extraordinary level, with single-family homes selling for nearly 23% over the original asking price on average, and condos selling for nearly 7% over asking.
These are some of the highest premiums we have seen in recent memory, reflecting the intense demand in San Francisco’s housing market.
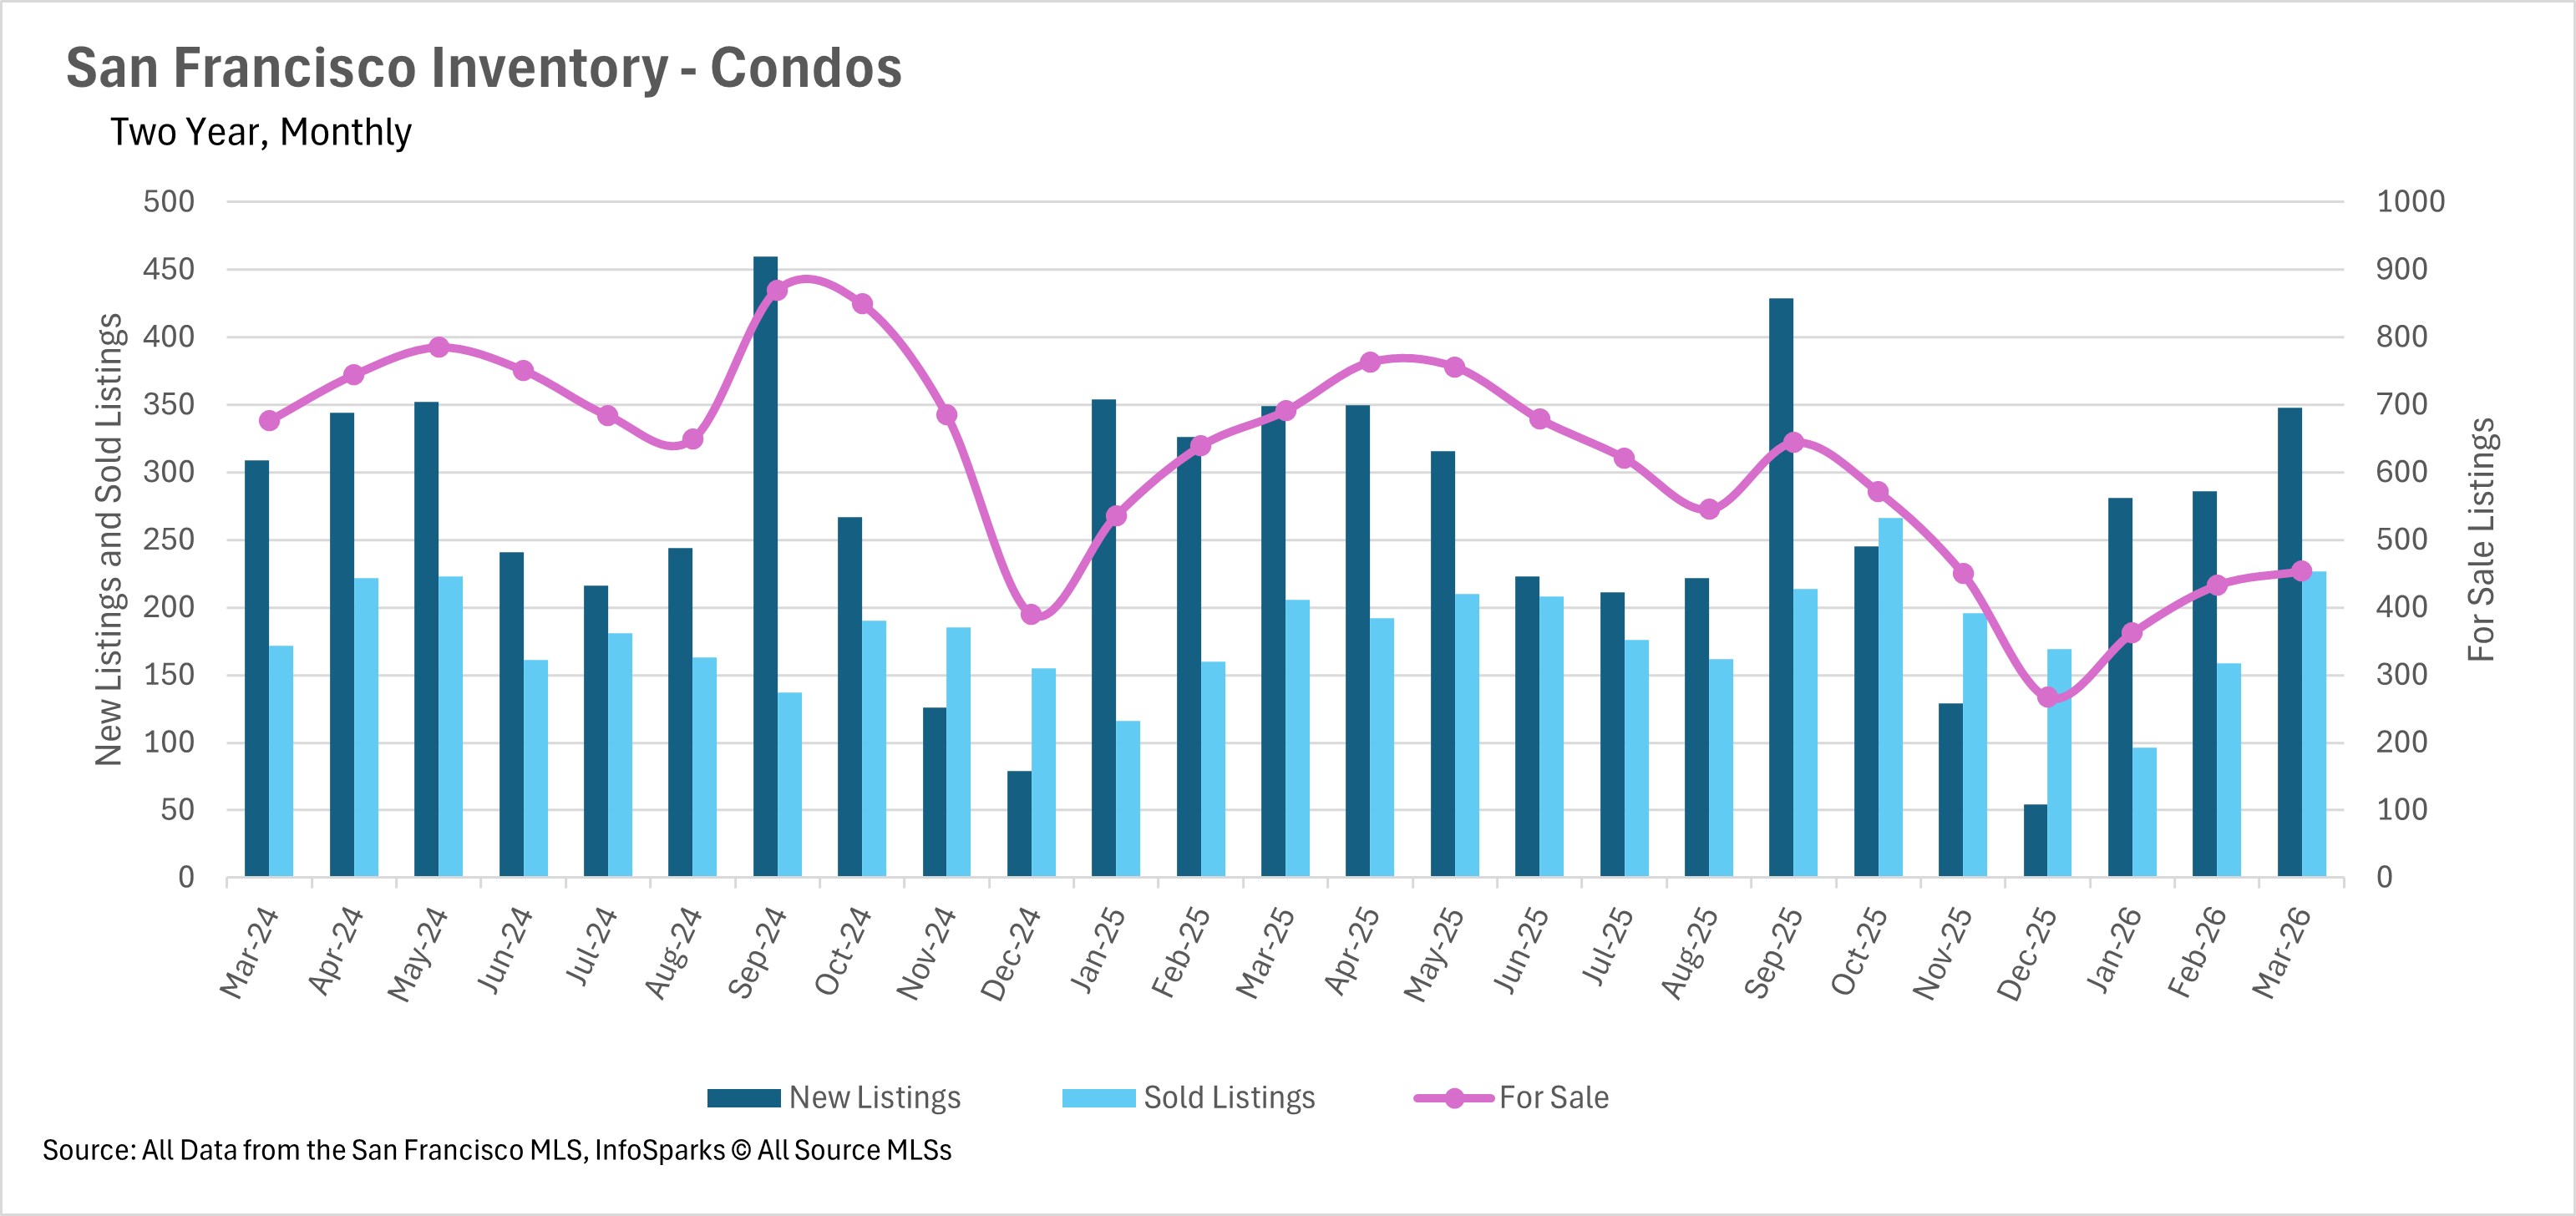
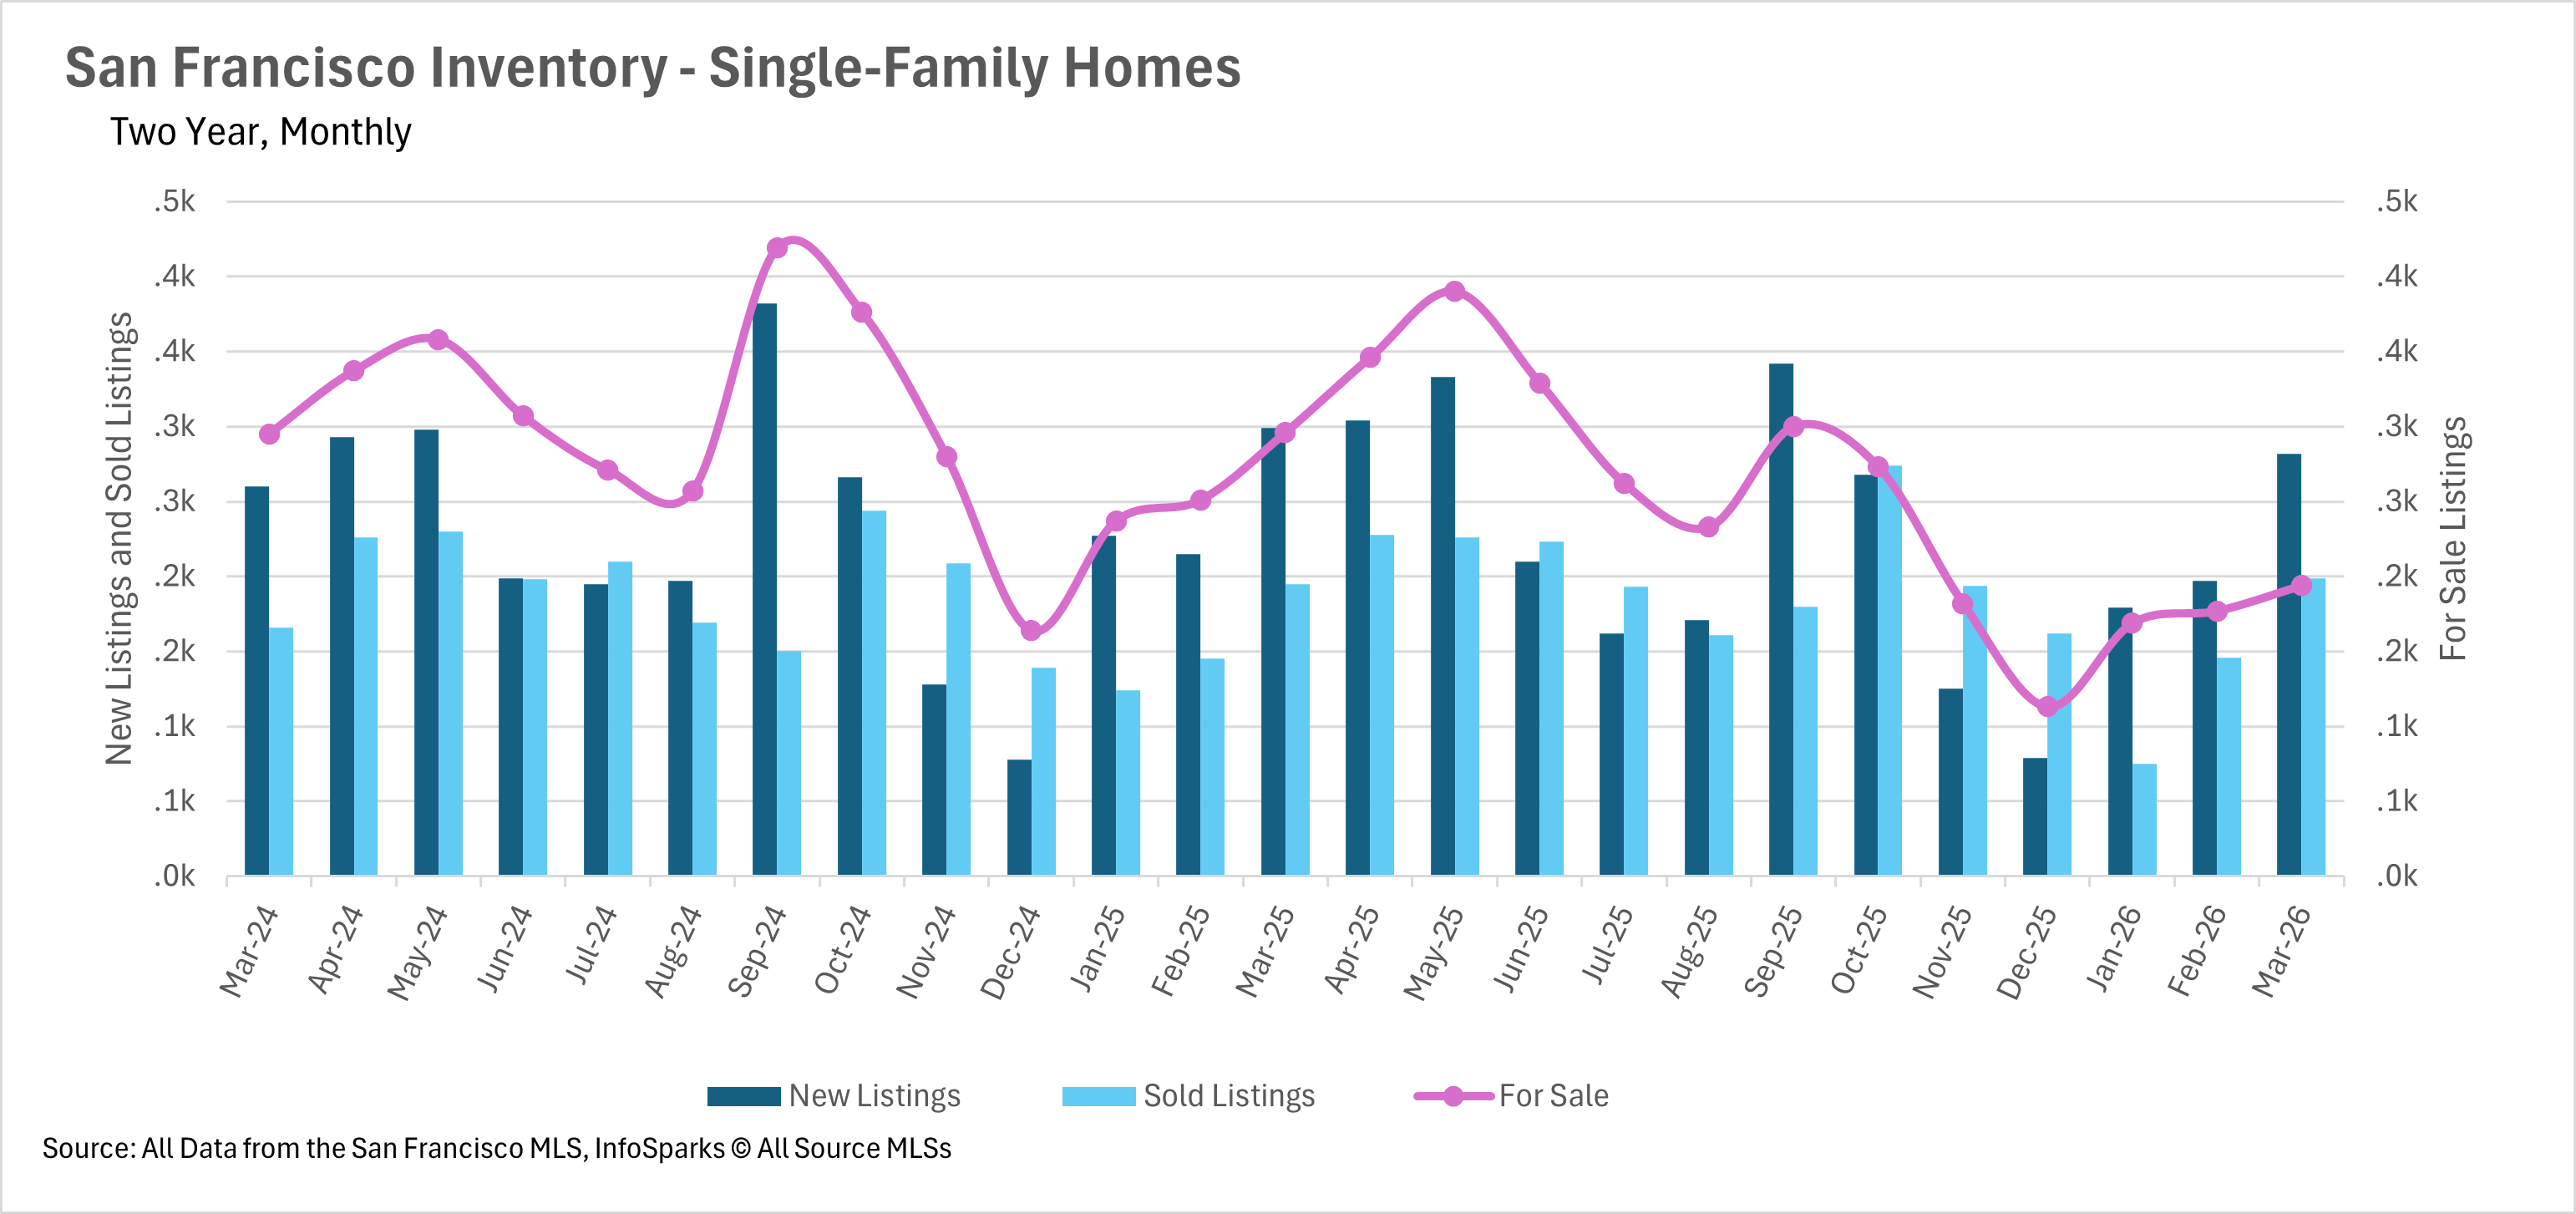
Despite the arrival of spring and the typical increase in new listings, inventory levels remain drastically below where they were a year ago.
There are currently just 194 single-family homes for sale in San Francisco, representing a 34.46% decline compared to March 2025.
The condo market is facing a similar shortage, with inventory down 34.30% year over year to 454 units.
While new listings did increase from February, with 282 new single-family homes and 348 new condos hitting the market, the pace of sales has kept overall inventory suppressed.
Buyers continue to face an extremely limited selection of properties as we head deeper into the spring season.
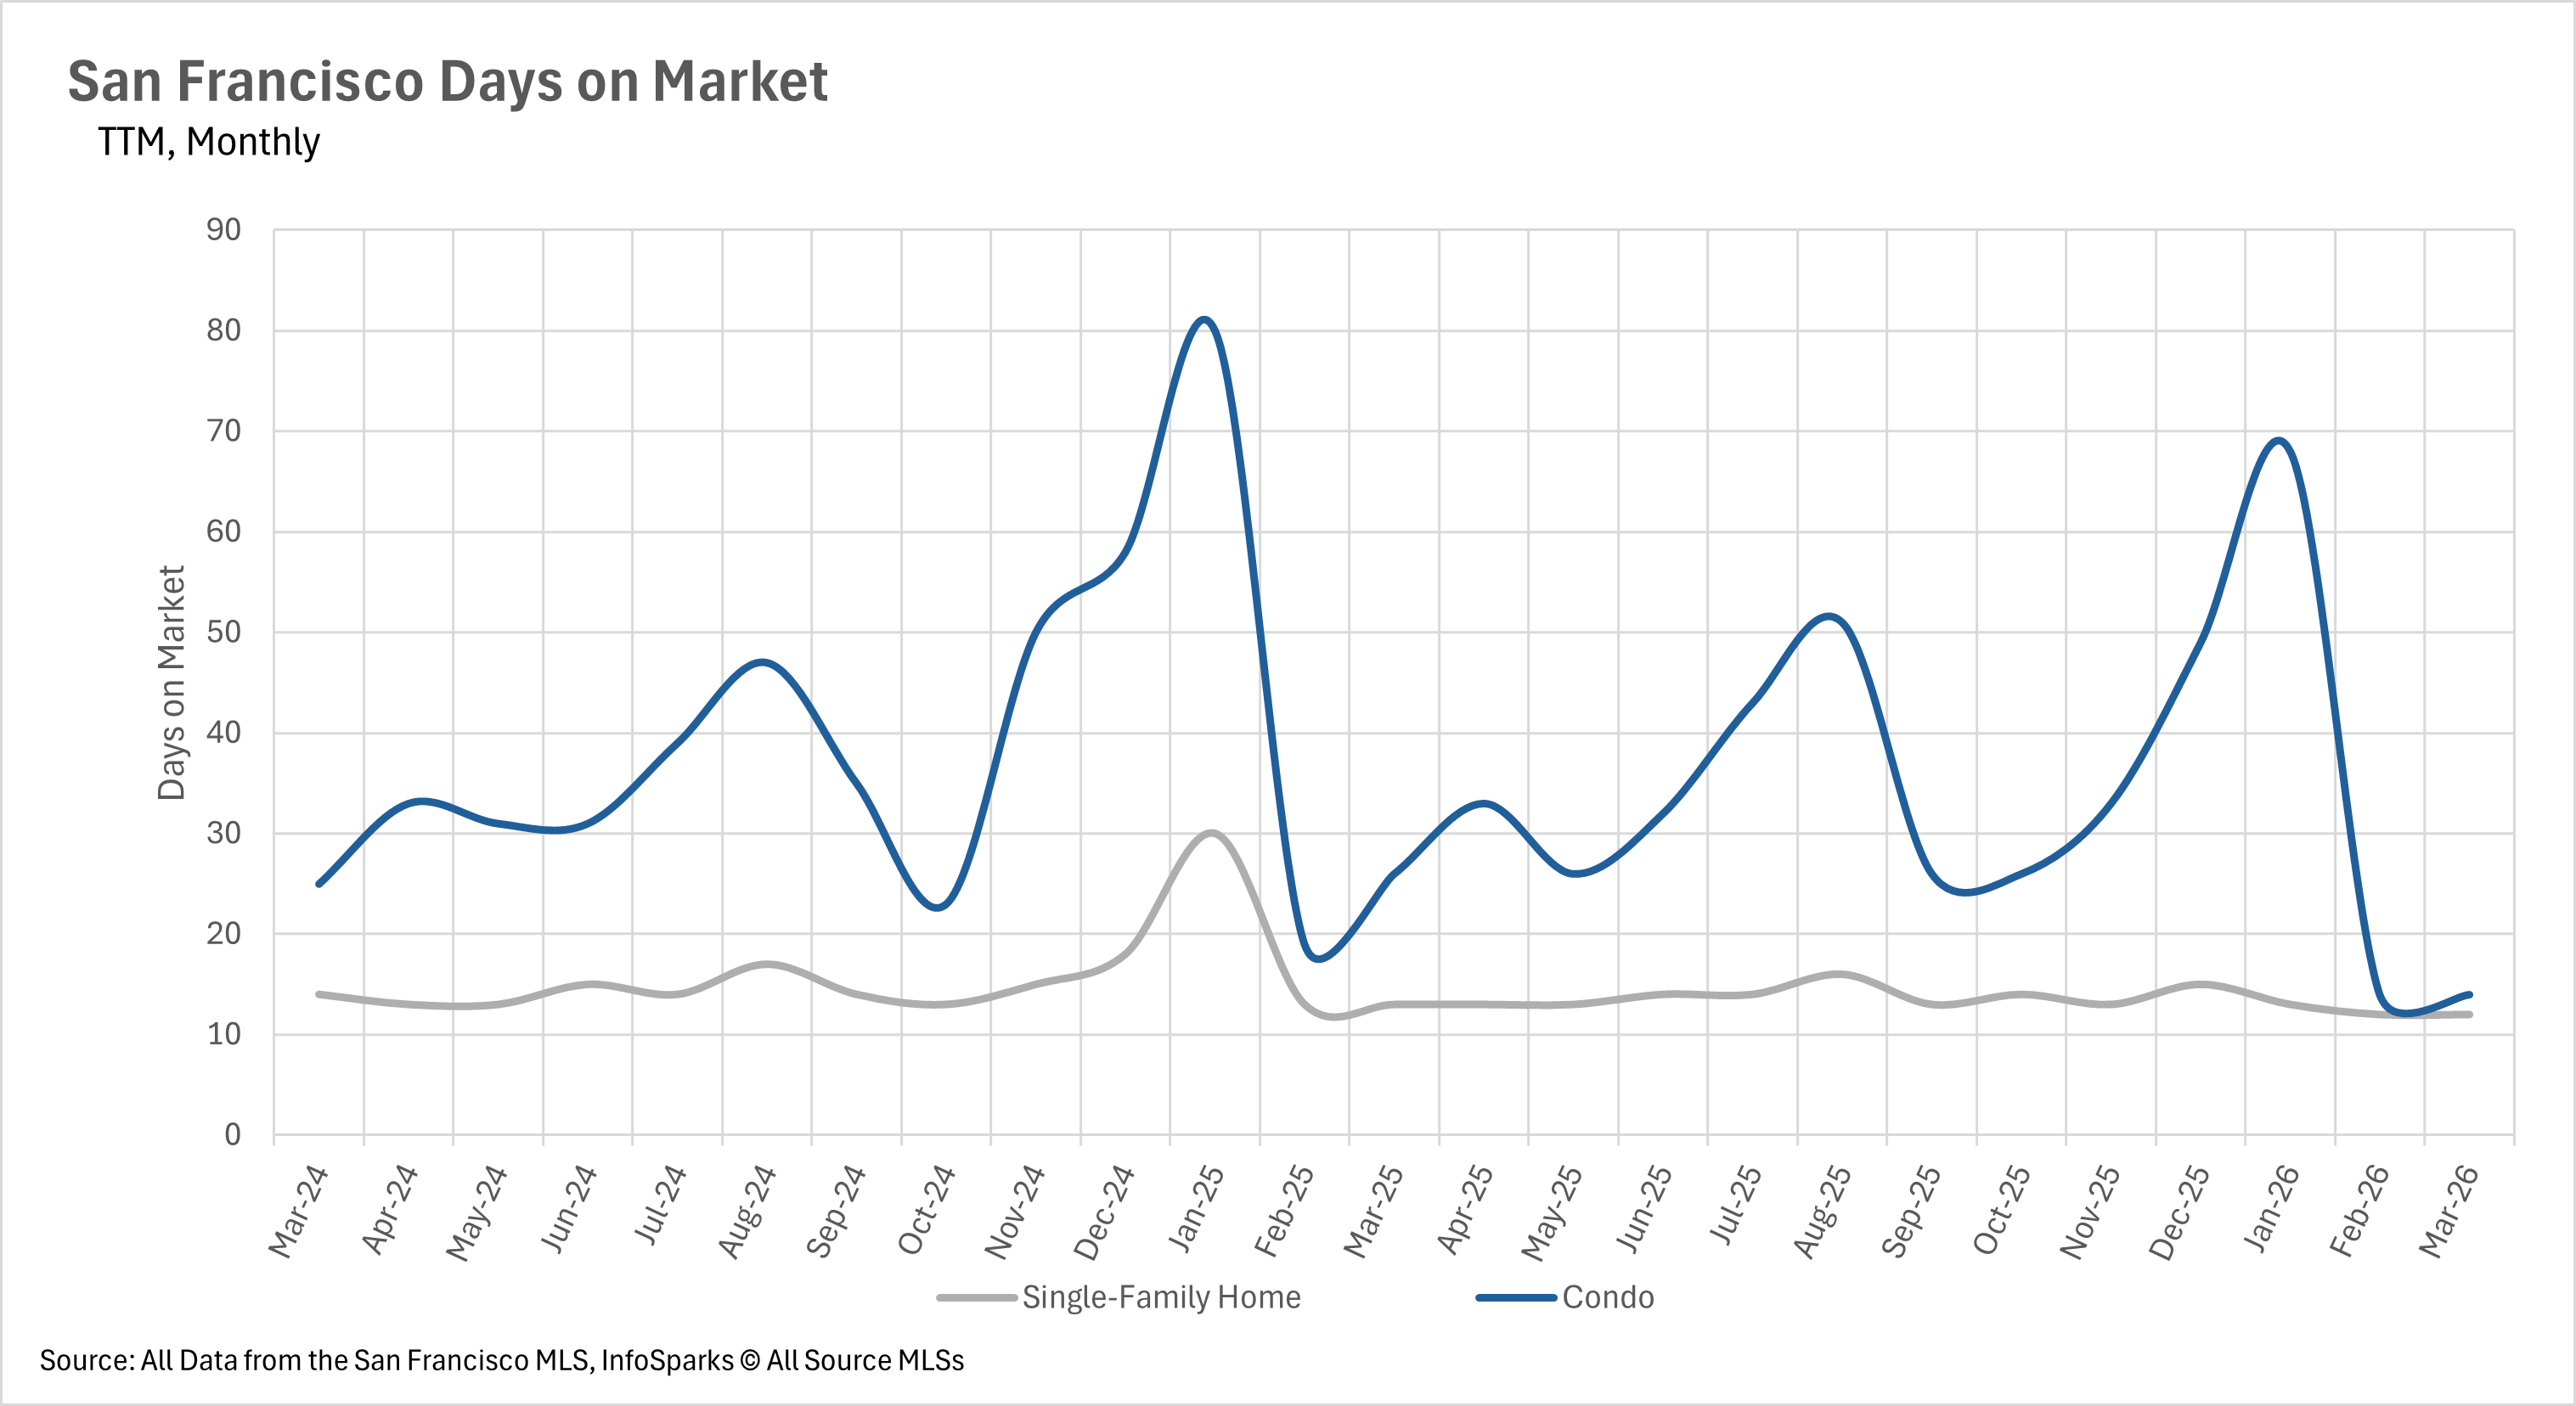
The severe inventory shortage has created one of the fastest-moving markets San Francisco has seen in years.
The average single-family home is selling in just 12 days, representing a 7.69% decrease compared to last March.
The condo market has seen an even more dramatic acceleration, with the average condo selling in just 14 days, a stunning 46.15% year-over-year decline.
For buyers, this means there is virtually no time to deliberate before making an offer, and multiple-offer situations have become the norm rather than the exception.
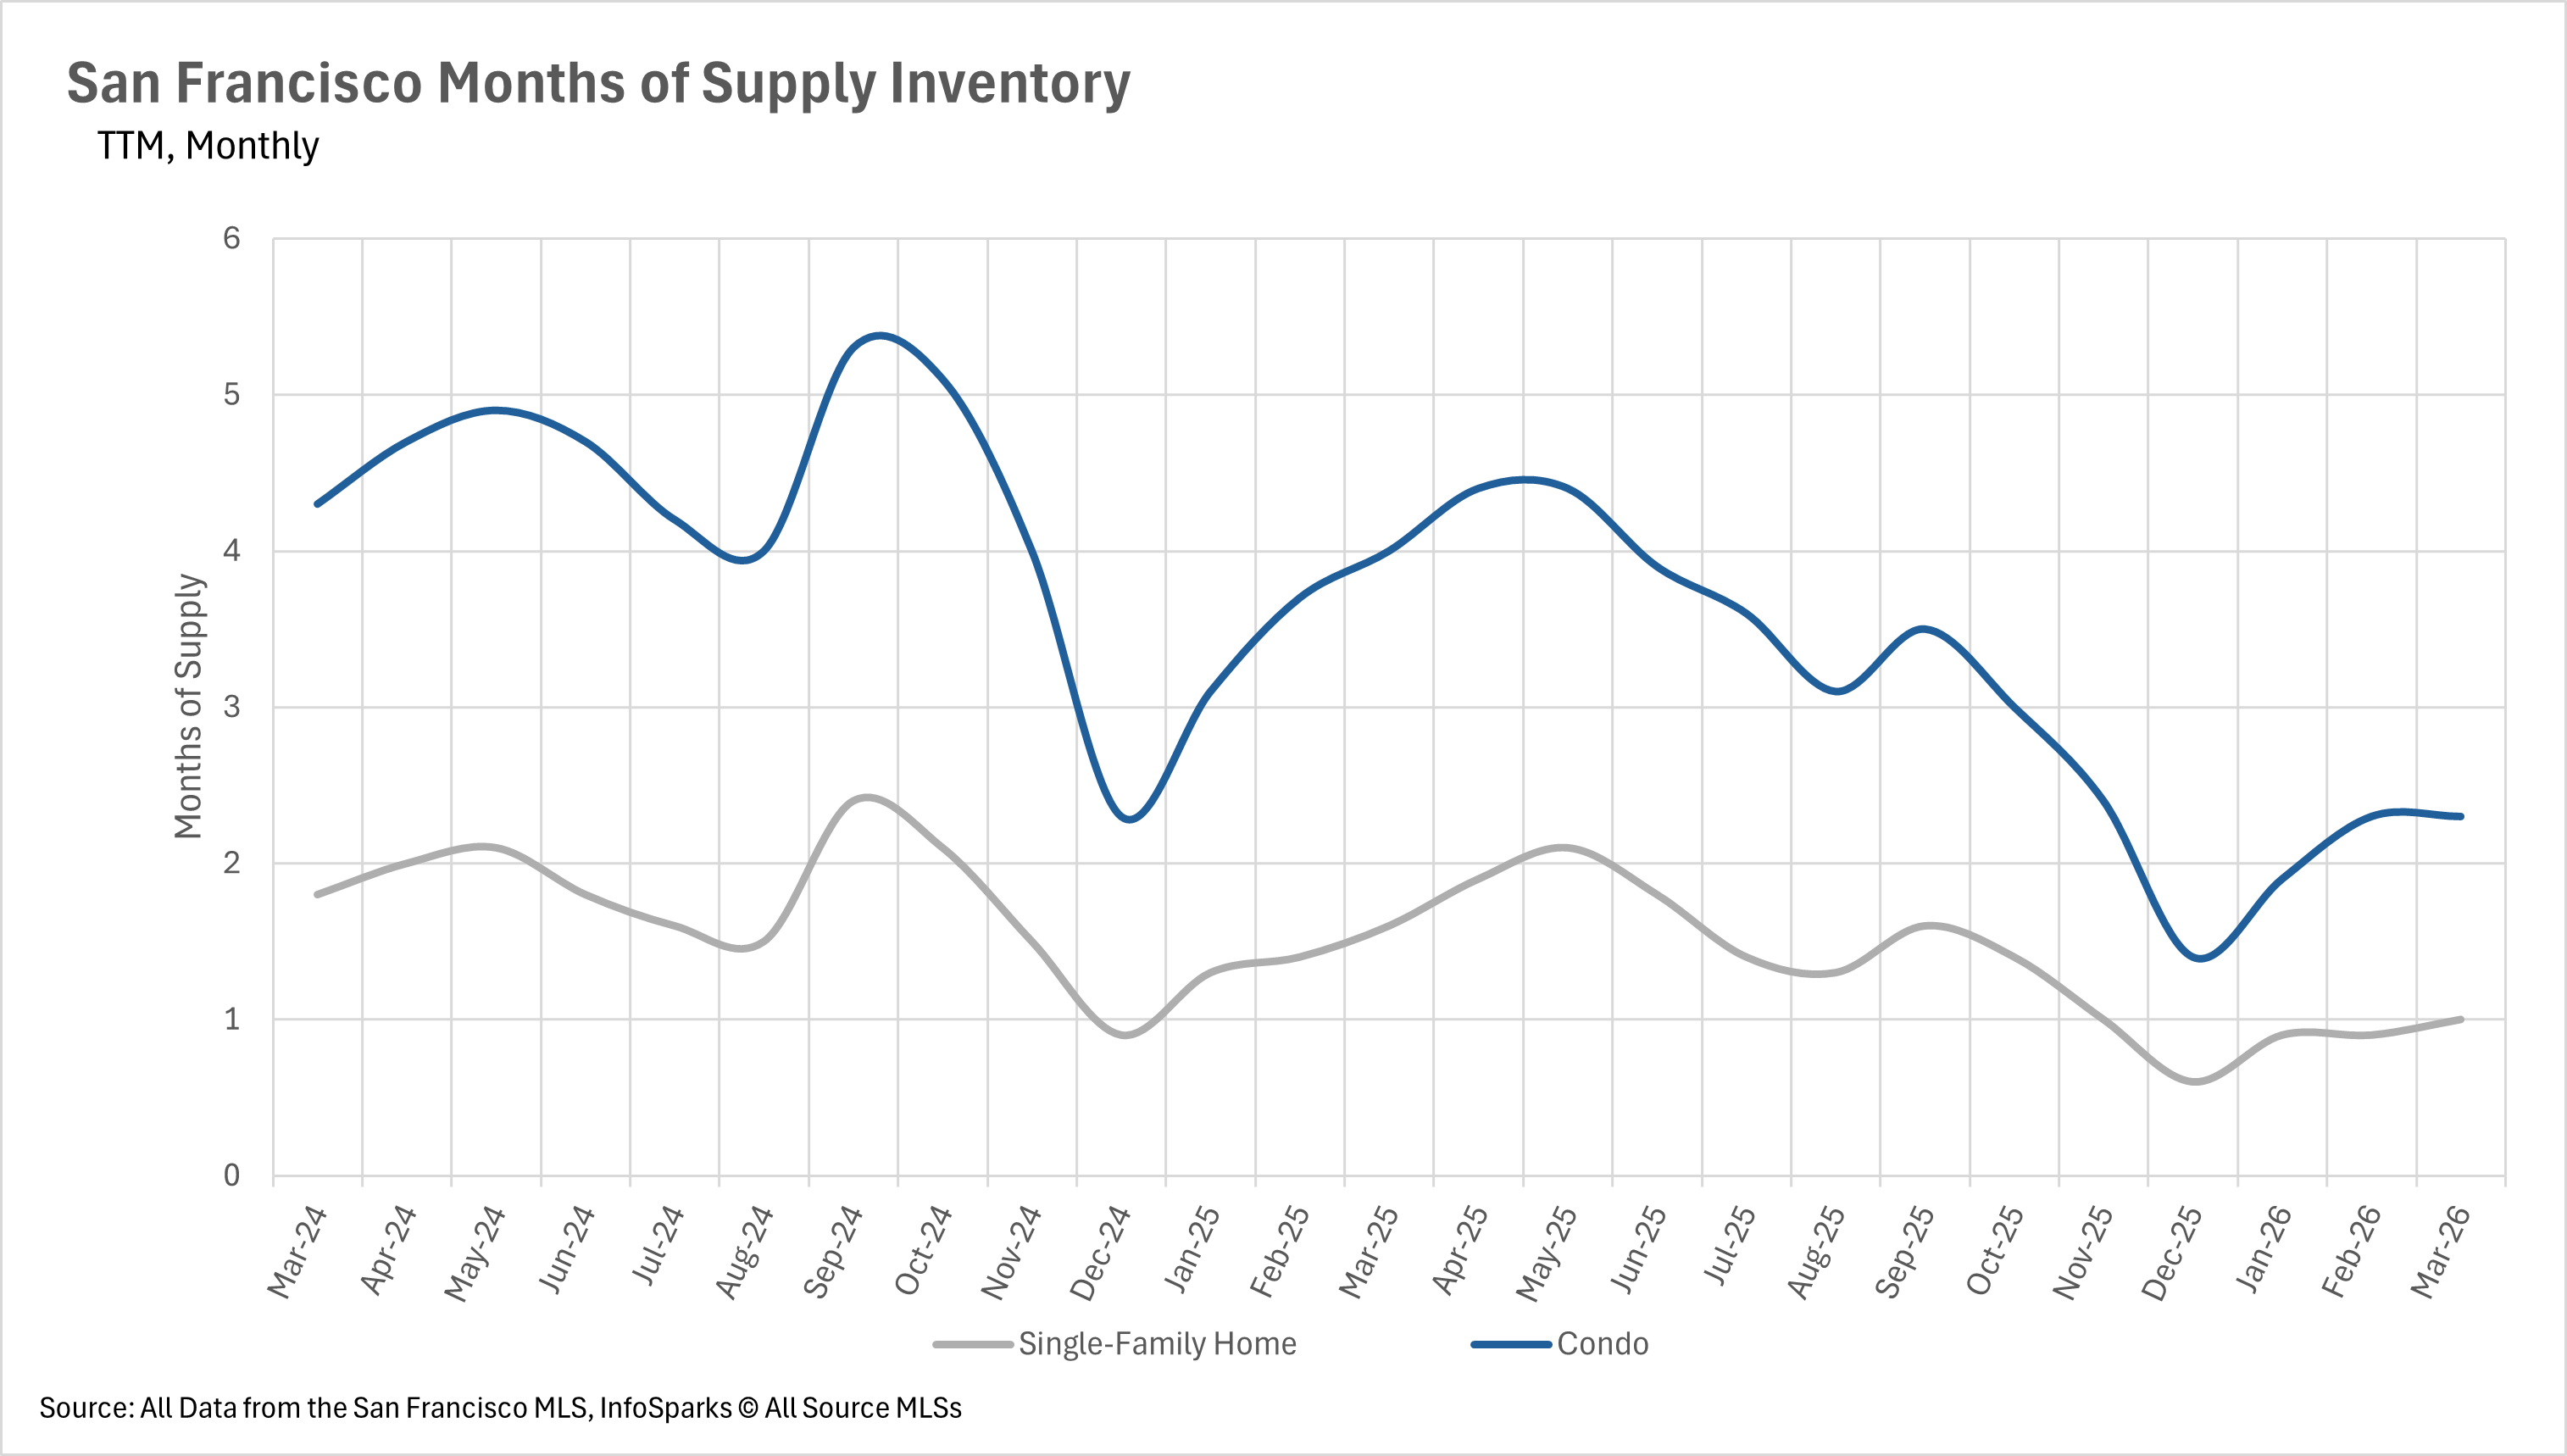
When determining whether a market is a buyers’ market or a sellers’ market, we again look to the Months of Supply Inventory (MSI) metric.
The state of California has historically averaged around three months of MSI, so any area with about three months of MSI is considered balanced. Markets with less than three months are seller’s markets, while those with more than three months are buyer’s markets.
With just 1.0 months of single-family home inventory and 2.3 months of condo inventory on the market, San Francisco remains a deeply entrenched seller’s market across all property types.
Both figures are down more than 37% year over year, and the condo market has shifted from a buyers’ market last year to a strong seller’s market today.
Sellers continue to enjoy significant leverage in negotiations, and buyers should be prepared for fierce competition throughout the spring season.
As this latest San Francisco market update makes clear, today’s buyers and sellers benefit from looking at both the newest data and the broader trend line.
For added context, read our earlier May 2025 market update, and last month’s San Francisco Real Estate Market Update: Low Inventory Fuels Strong Start to 2026.
Buyers can also explore our Mortgage Calculator, Affordability Calculator, and Why Buy With Us.
Sellers may find our Get a Custom Home Valuation, Prepping for Sale, and Communities We Serve especially helpful. If you have any questions about how today's market aligns with your real estate goals, we are here to help. Contact Us.
Stay up to date on the latest real estate trends.

July 17, 2026
Explore Life Near the Panhandle at 536 Broderick

July 14, 2026
June 2026 Pacifica housing market data, including median sale price, days on market, price per square foot, and sale-to-list price trends.

July 9, 2026
What Bernal Buyers and Sellers Should Know
July 2, 2026
Discovering the History and Charm of Precita Park in Bernal Heights
You’ve got questions and we can’t wait to answer them.