San Francisco Housing Market Update: August 2026
August 19, 2026

August 19, 2026
Note: You can find the charts & graphs for the Big Story at the end of the following section.
*National Association of REALTORS® data is released two months behind, so we estimate the most recent month's data when possible and appropriate.
CLICK HERE TO JUMP TO SAN FRANCISCO DATA
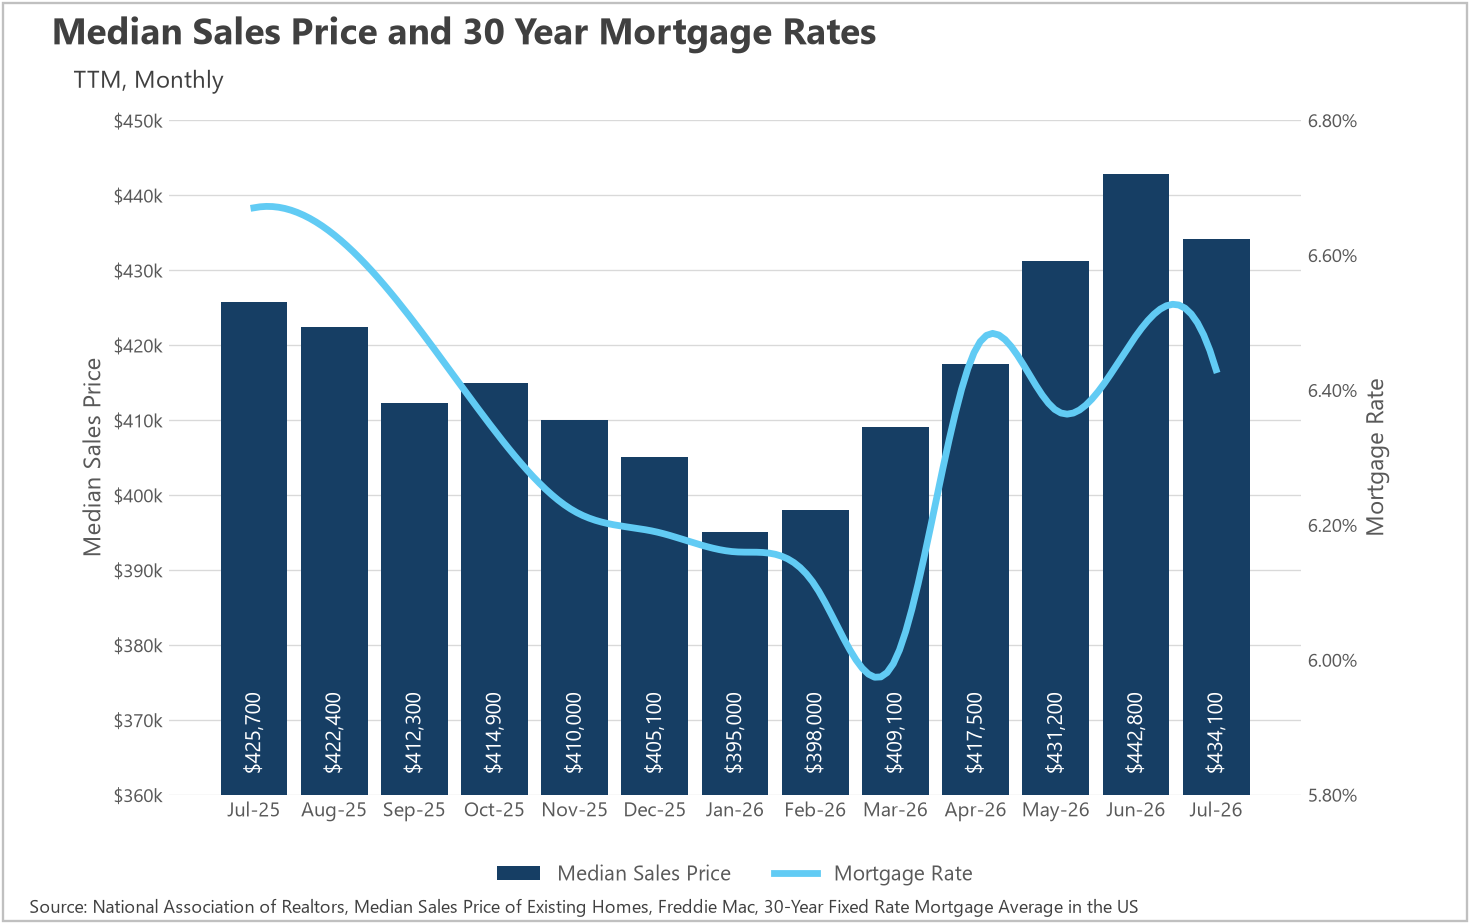
After five straight months of gains carried the median sale price to $442,800 in June, July brought the first pullback of the year. The median home sold for $434,100, a 1.96% decline from June, though still 1.97% higher than the $425,700 we saw in July of last year. A modest summer dip is not unusual, and the bigger picture is that prices have climbed roughly 9.9% since January's $395,000 trough.
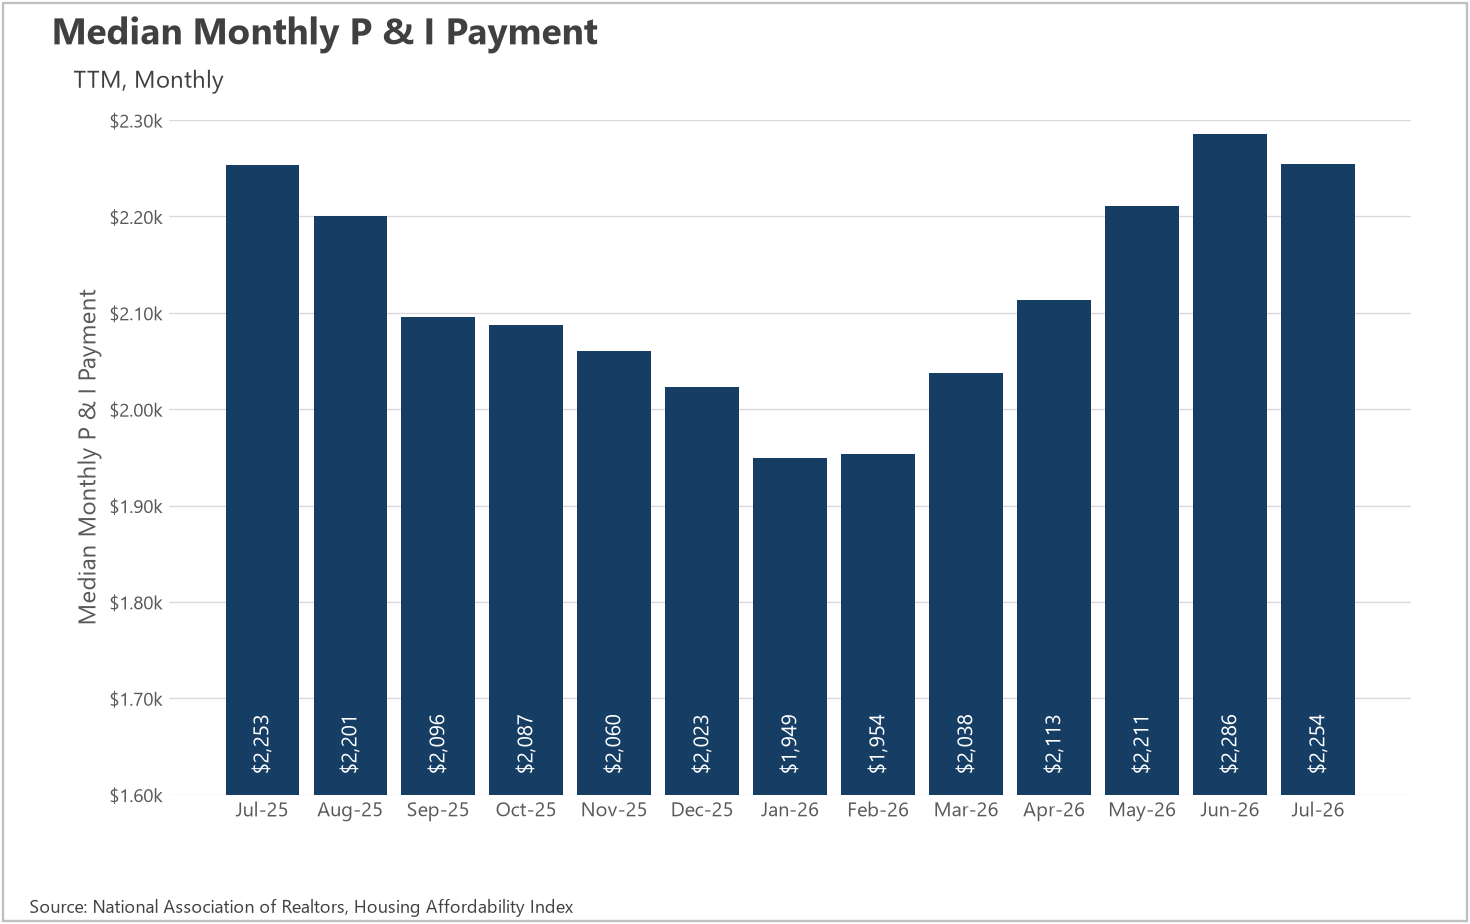
On the financing side, the 30-year mortgage rate eased slightly to 6.43% in July before jumping to 6.69% in August, its highest level since last summer and a meaningful move away from the 6% low we saw back in March. That combination of a slightly lower price and a slightly lower rate trimmed the median monthly P&I payment to $2,254 in July, down from $2,286 in June. The catch is that this figure is now essentially identical to the $2,253 buyers were paying a year ago, meaning the affordability advantage that lower rates delivered earlier in the year has been completely erased. With August rates moving higher, payments look likely to head back up.
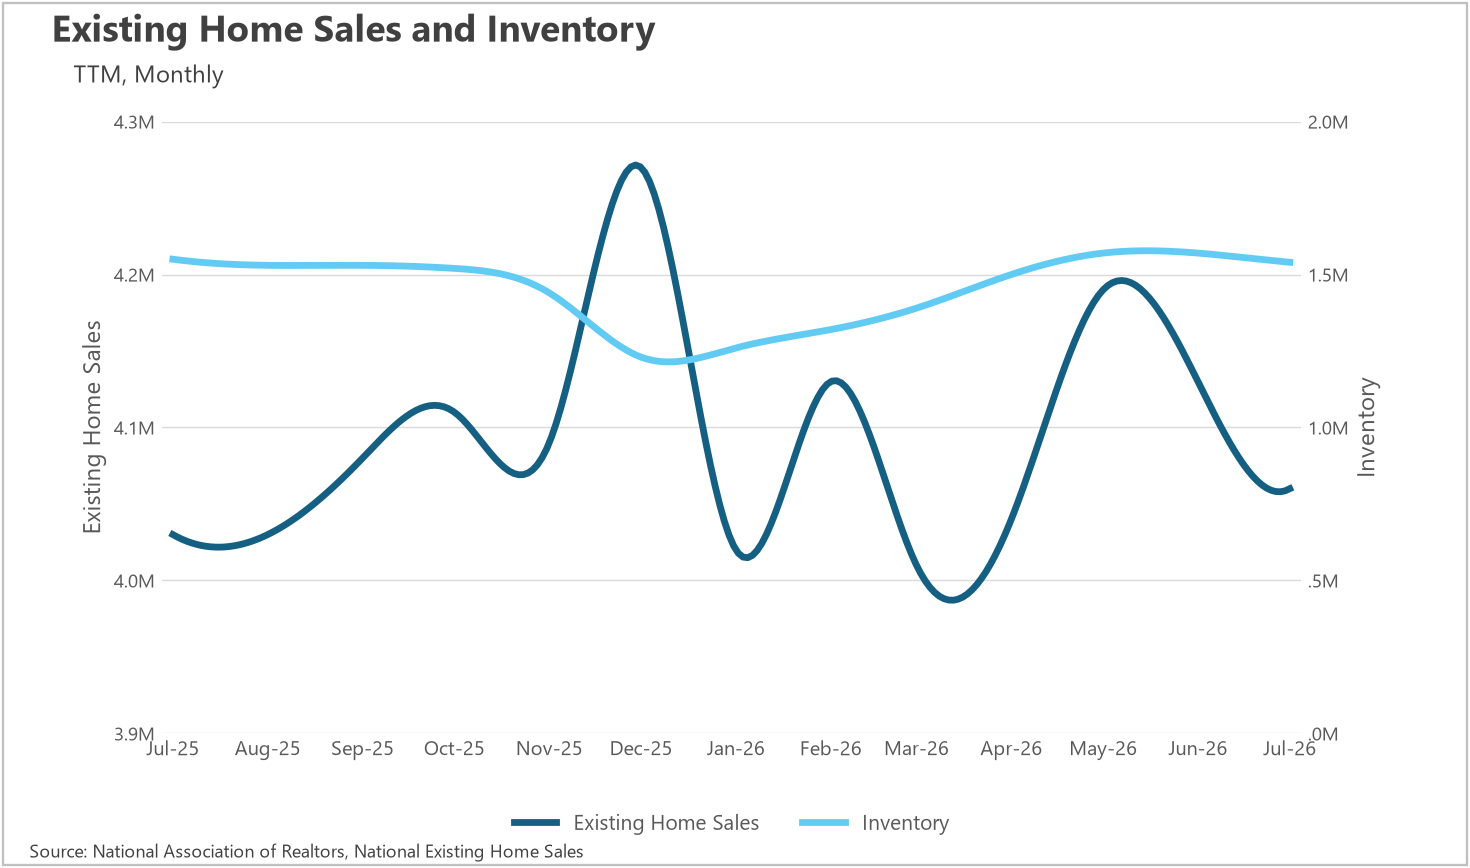
Inventory data runs one month ahead of the other figures, and it tells us the supply build that defined the first half of the year has reversed course. July inventory came in at 1,540,000 homes, a 1.91% decline from the 1,570,000 available in both May and June, and now 0.65% below the 1,550,000 we had at this time last year. That is a notable shift, because inventory had been running above year-ago levels through the spring. New listings reinforce the story.
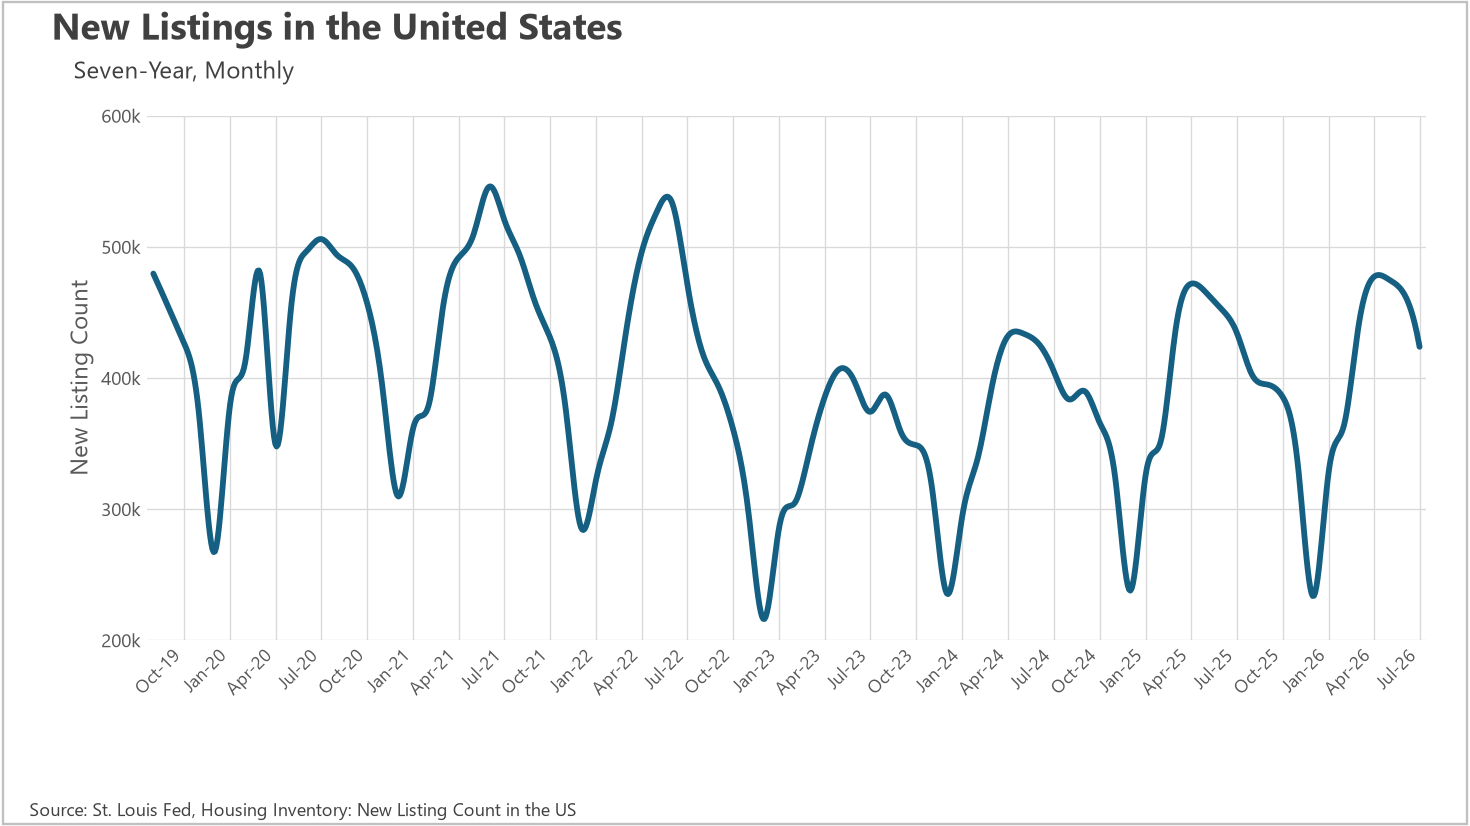
Sellers brought 423,732 new listings to market in July, an 8.58% drop from June and 2.55% below last July's 434,816. Seasonality explains part of that decline, since listing activity typically peaks in late spring, but the year-over-year decrease suggests homeowners are becoming a bit more hesitant as rates push back toward 6.7%. Fewer new listings combined with steady sales activity means the pool of available homes is likely to keep thinning through the back half of the summer.
Existing home sales registered 4,060,000 in July, down 1.69% from June's 4,130,000 and roughly 3% below May's 4,190,000 high for the year. On a year-over-year basis, however, sales are up 0.74% from last July's 4,030,000, which means demand is essentially holding steady rather than deteriorating. That is a reasonable outcome given what buyers are facing. Monthly payments are back to where they were a year ago, and the run of price appreciation from January through June asked buyers to stretch further with every passing month.
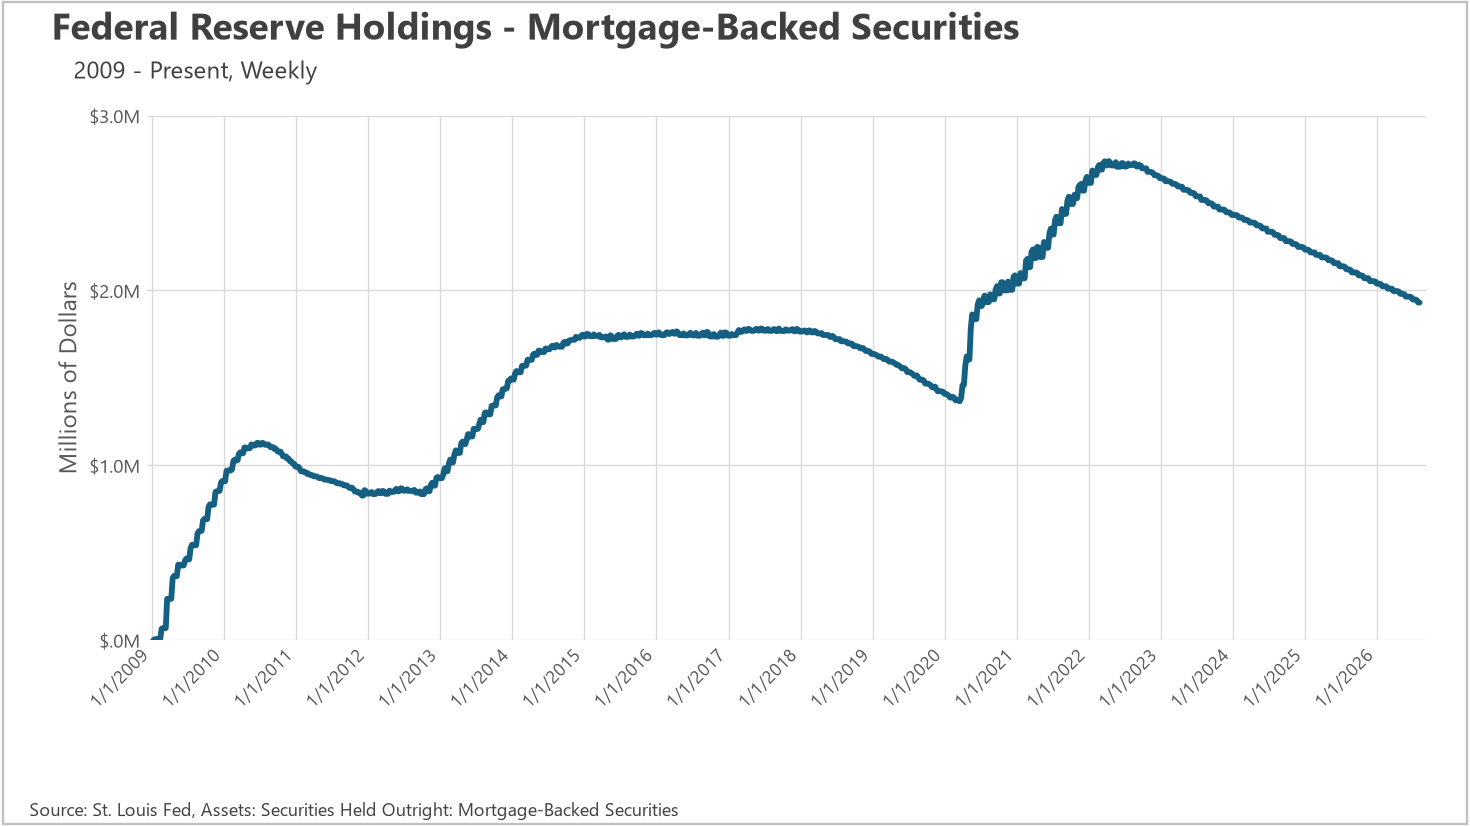
What is encouraging is that sales have stayed in a fairly narrow band between 4,010,000 and 4,190,000 all year, showing a market that has found a floor even as financing costs have moved around. Also worth watching in the background: the Federal Reserve's mortgage-backed securities holdings continue to shrink, falling to $1.93 trillion in August from nearly $2.07 trillion last November, which removes a source of support for mortgage rates over time.
When determining whether a market is a buyers’ market or a sellers’ market, we look to the Months of Supply Inventory (MSI) metric. The state of California has historically averaged around three months of MSI, so any area with at or around three months of MSI is considered a balanced market. Any market that has lower than three months of MSI is considered a seller’s market, whereas markets with more than three months of MSI are considered buyers’ markets.
Nationally, 1,540,000 homes for sale against a sales pace of 4,060,000 homes per year works out to roughly 4.5 months of supply, which puts the country as a whole comfortably in buyers' market territory by California's three-month yardstick. That said, the trend is moving in sellers' favor. A year ago the same math produced closer to 4.6 months, and with inventory down 1.91% month over month, new listings down 8.58%, and sales holding above last year's level, supply is tightening rather than loosening. The counterweight is affordability: with the median P&I payment back at year-ago levels and August rates at 6.69%, demand could soften enough to keep the balance where it is. As always, real estate is a highly localized asset, which is why you should check out what's going on in your local market below in the Local Lowdown!
Note: You can find the charts/graphs for the Local Lowdown at the end of this section.
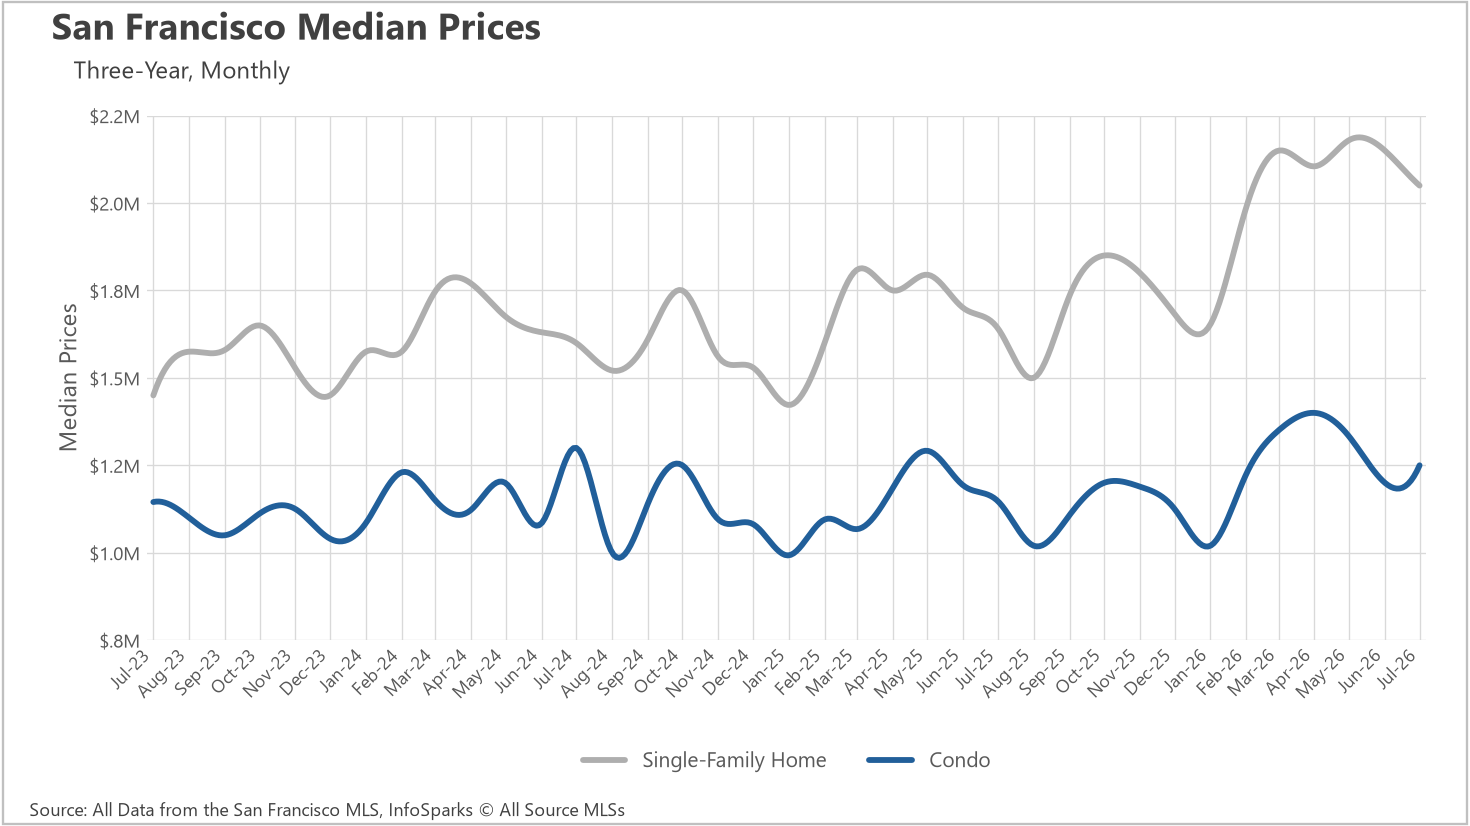
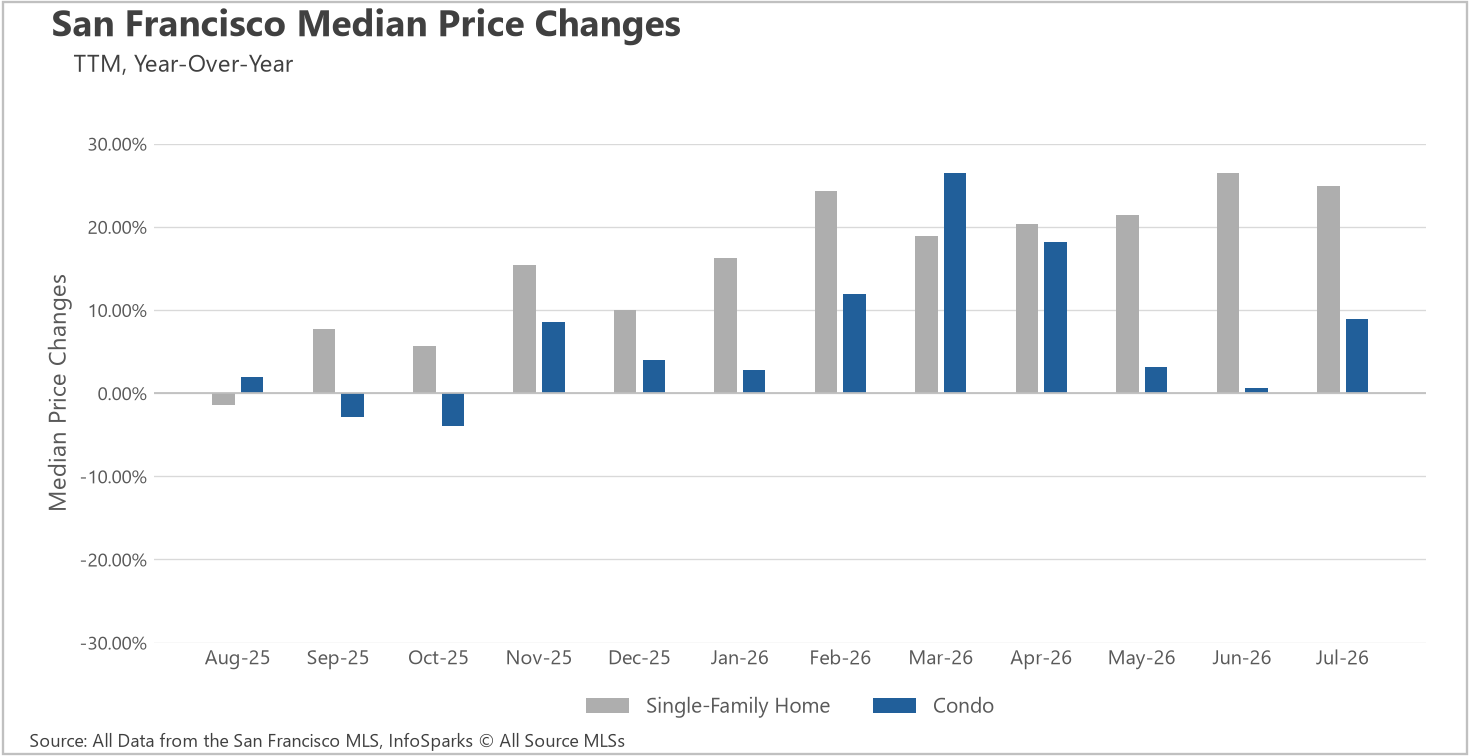
July delivered a slight pullback in San Francisco's single-family home market, with the median sale price settling at $2,050,000 after four consecutive months above $2.1 million. That represents a 4.65% decline from June's $2,150,000, but the year-over-year picture remains striking: prices are up 24.87% from the $1,641,750 median recorded last July. For context, the single-family median has now spent six straight months above the $2 million mark after starting the year at $1,653,325.
The condo market moved in the opposite direction, gaining 4.17% month-over-month to reach $1,250,000 and posting an 8.93% year-over-year increase from $1,147,500. That is a meaningful improvement from the flat annual comparisons condos were producing earlier this summer.
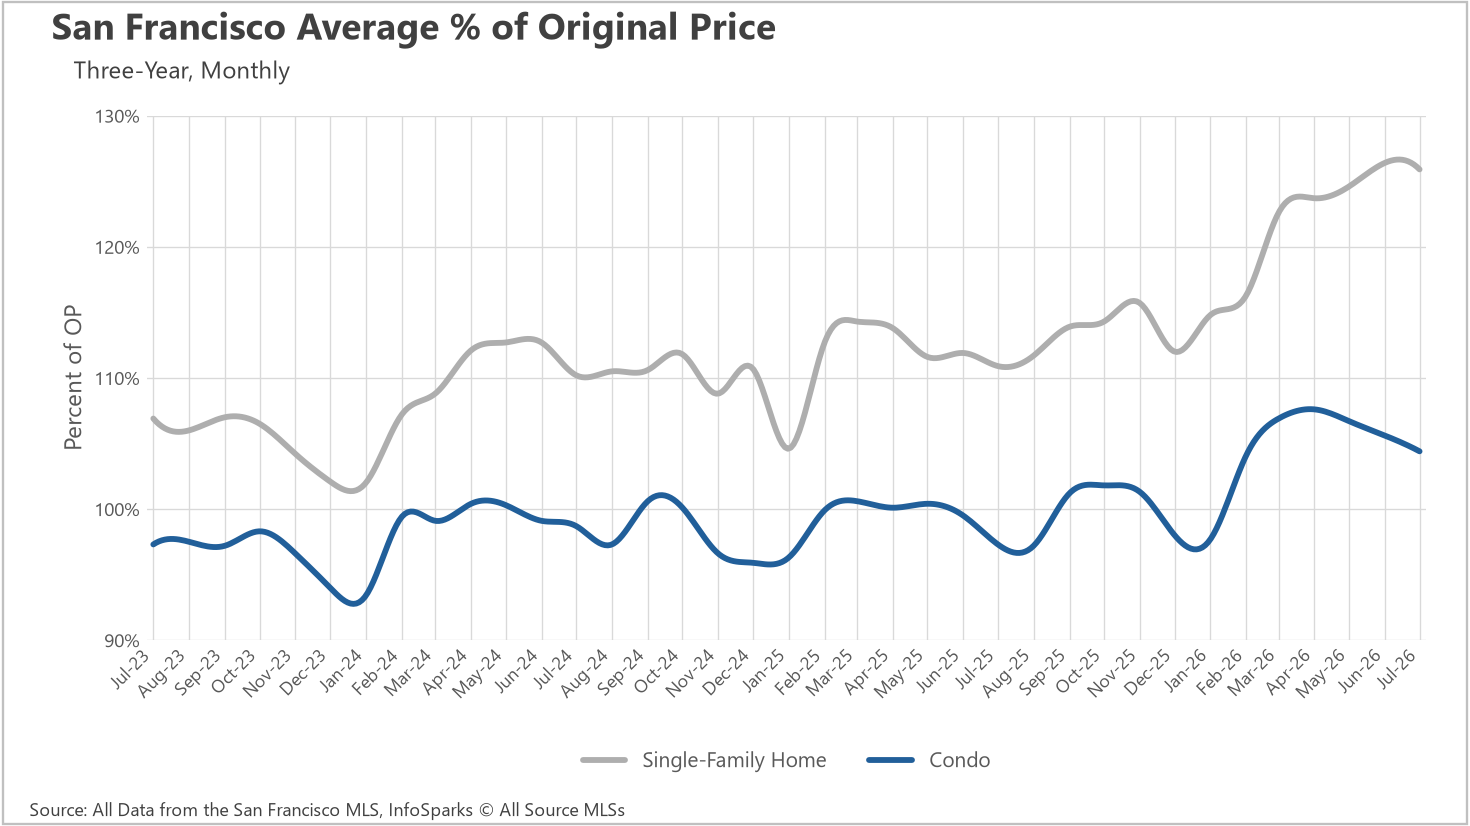
Bidding dynamics tell the rest of the story. Single-family homes continued selling for an average of 26% above their original list price, holding at the highest level in this data series and well above the 11% premium buyers were paying last July. Condos averaged 4% over original asking, down slightly from 6% in June but a substantial improvement from the 3% discount typical a year ago.
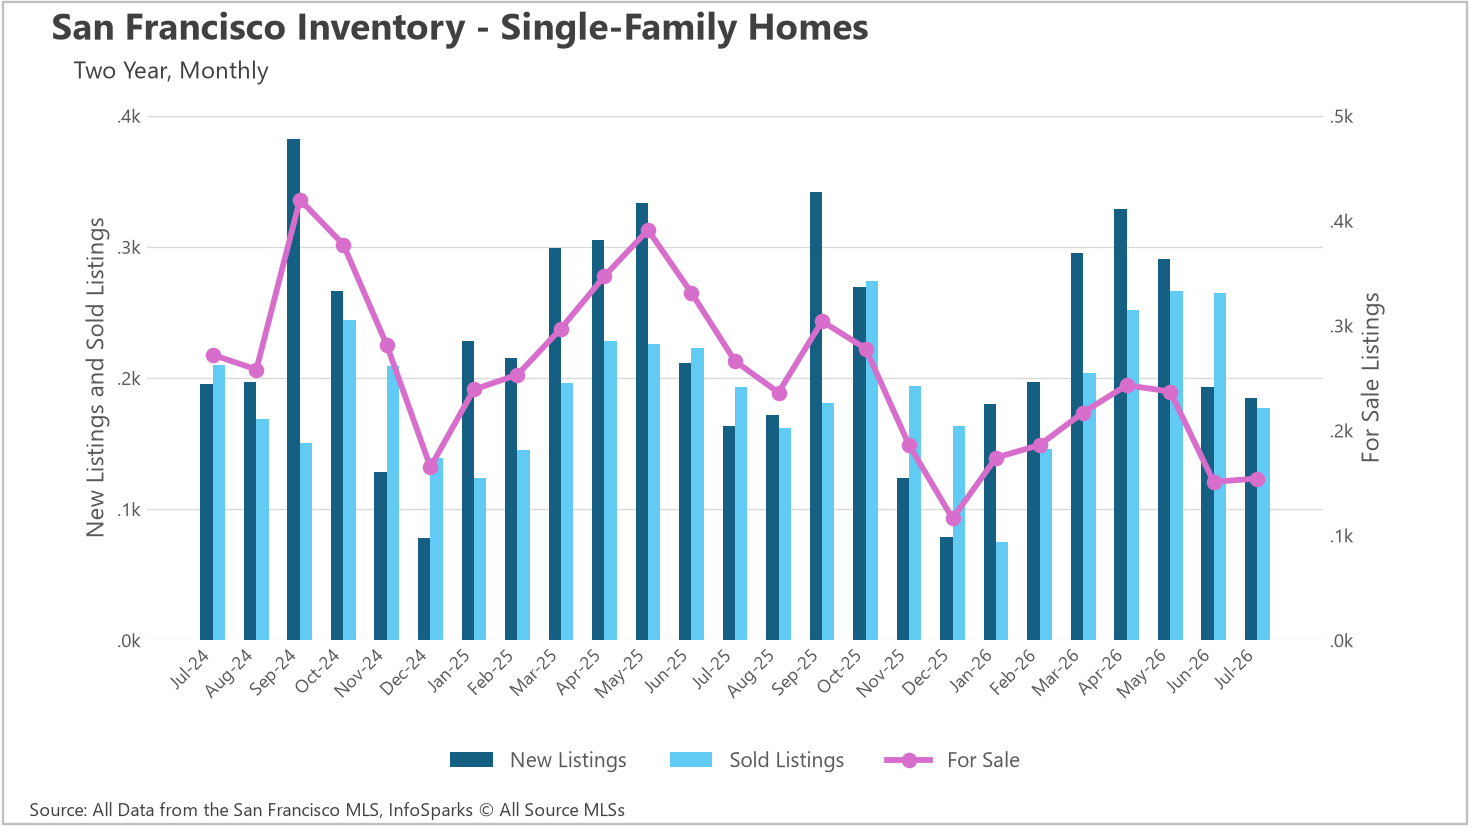
The supply picture remains the defining feature of this market. As of July, there were just 154 single-family homes for sale across San Francisco, a 42.11% decline from the 266 available last July. That figure is essentially flat with June's 151, suggesting the market has found a floor, but it is a remarkably low floor by any historical standard.
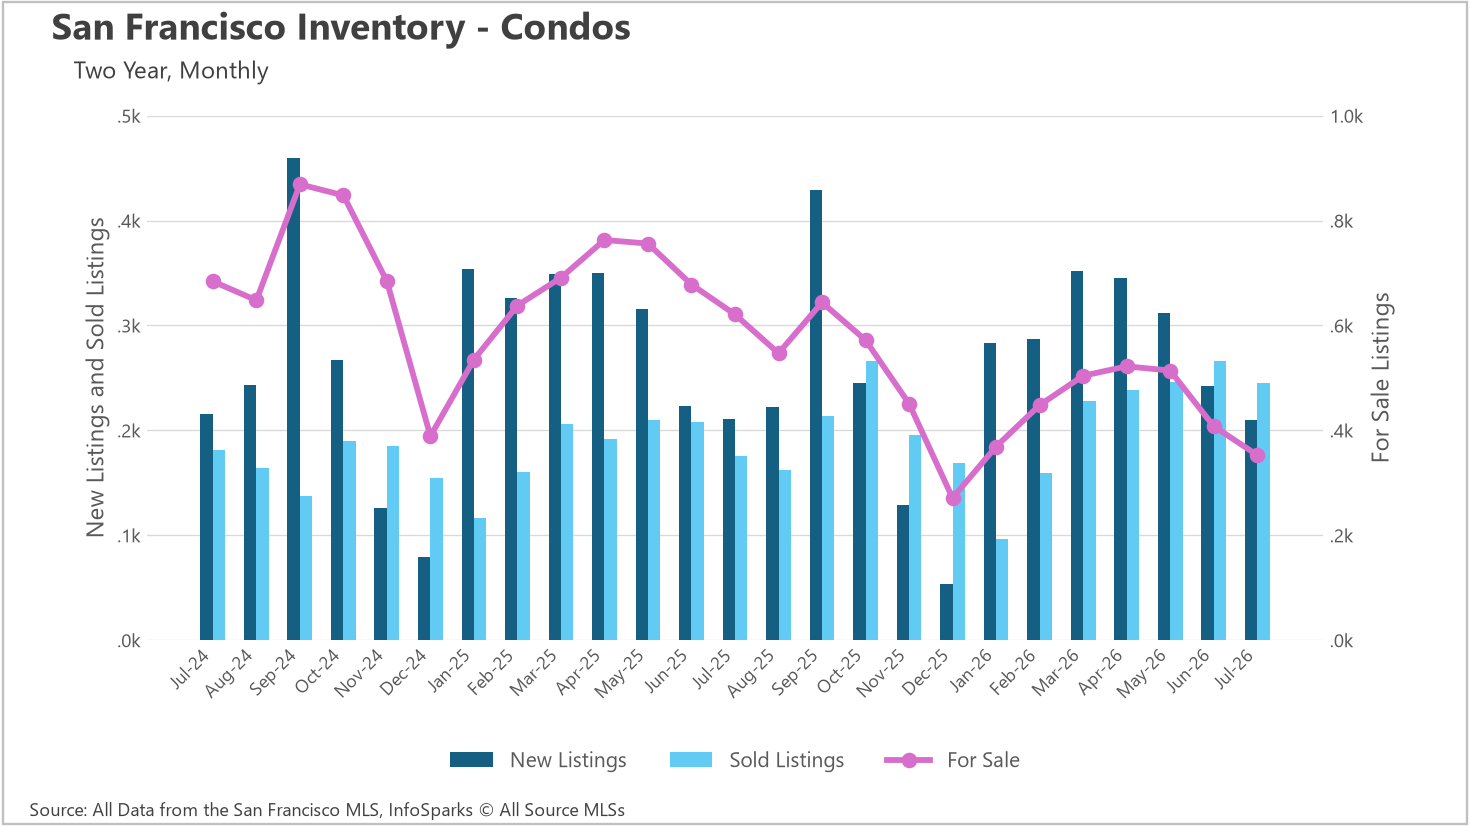
Condo inventory continued to shrink, falling 13.5% from June to 353 units for sale, and down 43.16% from 621 a year ago. Combined, that leaves barely 500 homes of any type on the market in a city of this size.
What makes the condo decline notable is that it is not being driven by a lack of sellers. New condo listings in July totaled 210, essentially unchanged from the 211 recorded last July. Instead, absorption is doing the work: 245 condos sold in July, a 39.2% jump from 176 a year ago. On the single-family side, new listings actually rose 13.5% year-over-year to 185, while sales slipped to 177 from 193. Sellers are coming to the table, but not fast enough to rebuild meaningful selection for buyers.
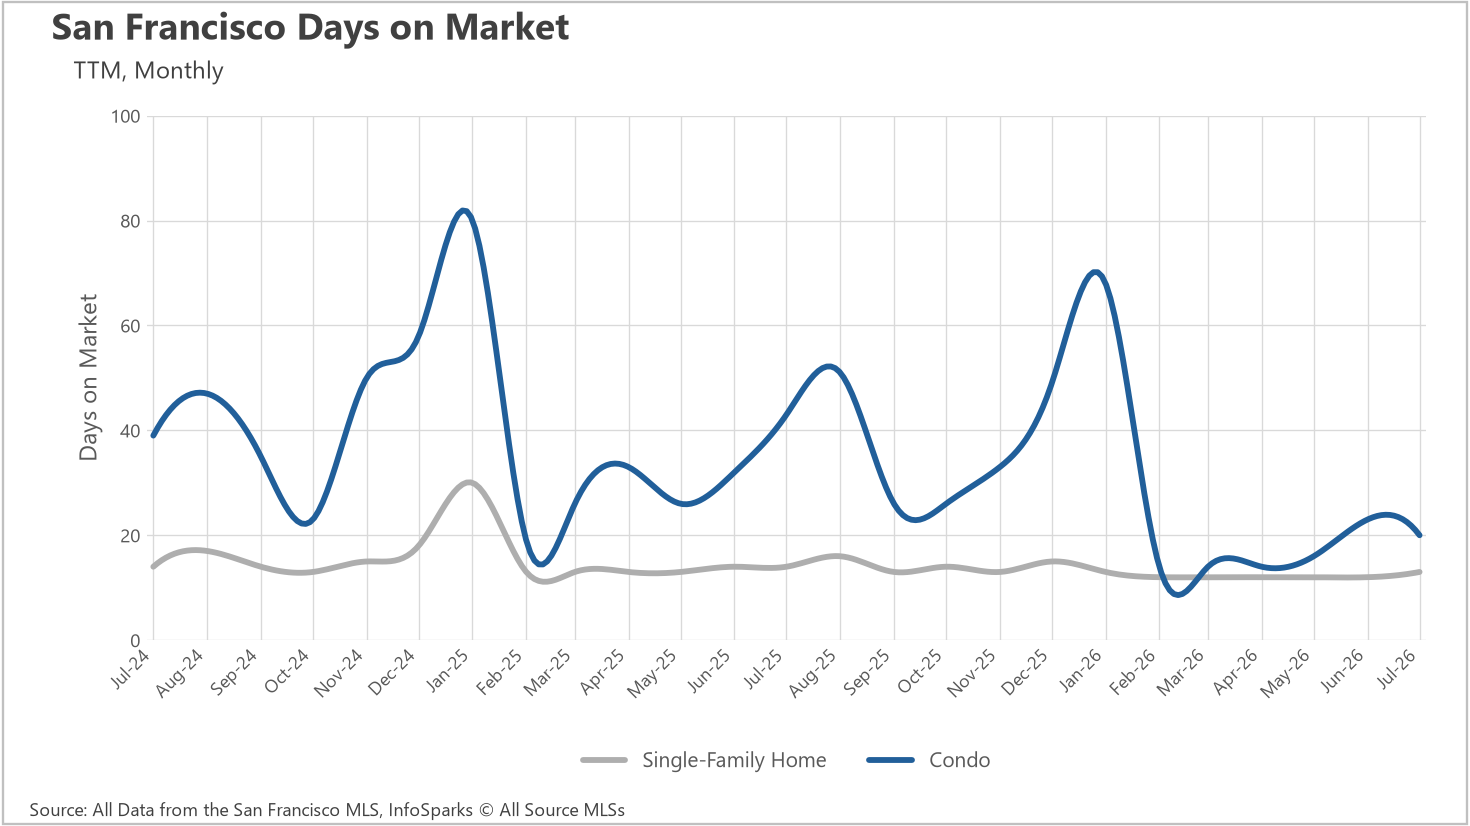
Single-family homes averaged 13 days on market in July, ticking up from the 12-day pace that held steady from February through June. It is a marginal shift, and still 7.14% faster than the 14 days recorded last July, but worth flagging as the first upward move in six months.
The condo market is where the real change has happened. Condos averaged 20 days on market in July, down from 23 in June and a dramatic 53.49% faster than the 43 days condos required last July. Historically, San Francisco condos slowed noticeably in the summer months, with August 2025 stretching to 51 days. This year, that seasonal drag has largely disappeared. Both property types are now clearing in under three weeks, which is a fundamentally different market than the one buyers navigated twelve months ago.
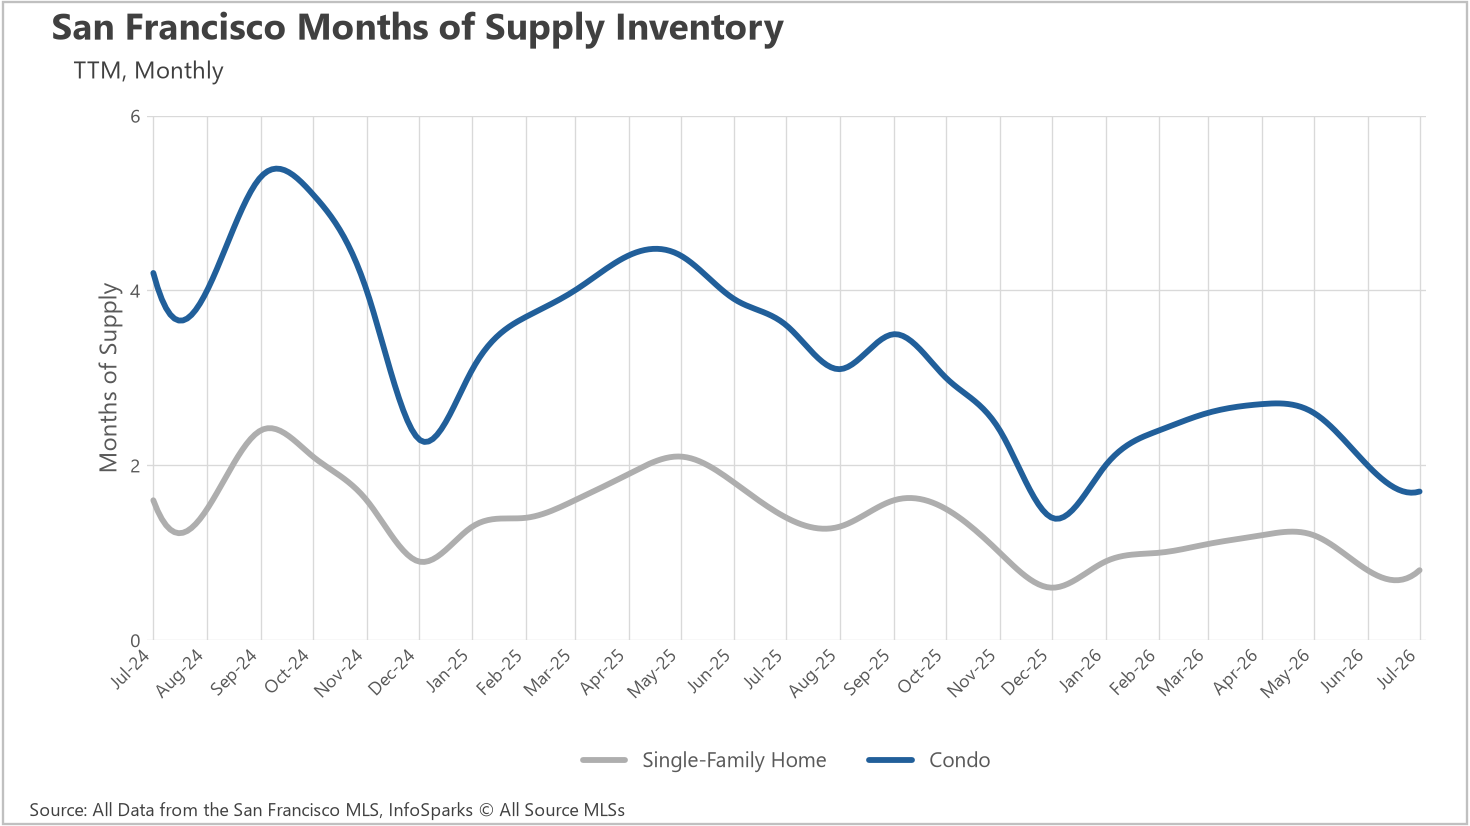
When determining whether a market is a buyers’ market or a sellers’ market, we look to the Months of Supply Inventory (MSI) metric. The state of California has historically averaged around three months of MSI, so any area with at or around three months of MSI is considered a balanced market. Any market that has lower than three months of MSI is considered a seller’s market, whereas markets with more than three months of MSI are considered buyers’ markets.
San Francisco sits firmly in seller's market territory on both fronts. Single-family homes carry just 0.8 months of supply, unchanged from June and down 42.86% from 1.4 months last July. At the current sales pace, every available single-family home in the city would be gone in roughly 24 days. Condos, meanwhile, have moved from a balanced market to a clear seller's market over the past year, dropping from 3.6 months of supply last July to 1.7 months now, a 52.78% decline and the lowest reading since December.
The significance here is that the condo segment, which spent most of 2024 and early 2025 above four months of supply, no longer offers buyers the negotiating room it once did. With both property types under two months of supply, faster sale times, and above-asking premiums holding firm, sellers retain substantial leverage heading into the fall.
San Francisco’s housing market can vary considerably by neighborhood, property type and price range. These additional resources offer more context for buyers and sellers:
Market statistics provide helpful context, but the value and competitive position of an individual property depend on its neighborhood, condition, layout, features and recent comparable sales. Contact Legacy Real Estate for a closer look at how current conditions relate to your home or buying plans.
Stay up to date on the latest real estate trends.

October 13, 2026
A thoughtful conversation can help you feel more confident about your home-buying journey.

October 12, 2026
September 2026 Sales Show Where Buyers Are Competing

September 30, 2026
Explore the vibrant neighborhood surrounding Dolores Park, from local markets and restaurants to green spaces and everyday city living.

September 25, 2026
While the national market cools, San Francisco continues to see strong demand, limited inventory, and a competitive market.
You’ve got questions and we can’t wait to answer them.